Key Concepts
This page defines the core nouns of the platform — the words that appear on menus, buttons, and column headers — so that you meet them here, once, with a definition, rather than for the first time in a dialog box. It is written for someone in their first hour with the product: a new analyst, a new administrator, or an evaluator deciding whether the product fits. Every concept below is a one-paragraph orientation, not a full reference; each links onward to the section of the manual that covers it in depth.
Fluency and Ingext are two live product brands from the same company, not an old name and a new one. Ingext is the streaming data pipeline and lakehouse product; Fluency is the AI-native SIEM. Both names appear in this manual, in the interface, and in support material, and both are current. Where this page needs a generic name for the software as a whole, it says "the platform".
How the Pieces Fit Together
A one-screen map of the whole system, to be read before the individual definitions: data enters through a pipeline, lands in a data lake, is evaluated by behavior rules that raise behaviors, which aggregate into behavior summaries and surface as tickets, and is reported on through reports and dashboards. Each stage in that sentence is a section below.
The vocabulary problem this page solves
The same data is called an event in one menu, a record in another, and a behavior in a third. The name depends on which stage of the system is looking at it, so the words are not interchangeable but they are not contradictory either.
The Pipeline Model
The pipeline is how data physically moves from an external system into storage. Its shape is always the same: Sources → Routers (containing pipes of Processors) → Sinks. The live diagram of your own pipeline is on the Platform → Configuration page, which draws those three stages as three columns read left to right in the direction data flows.
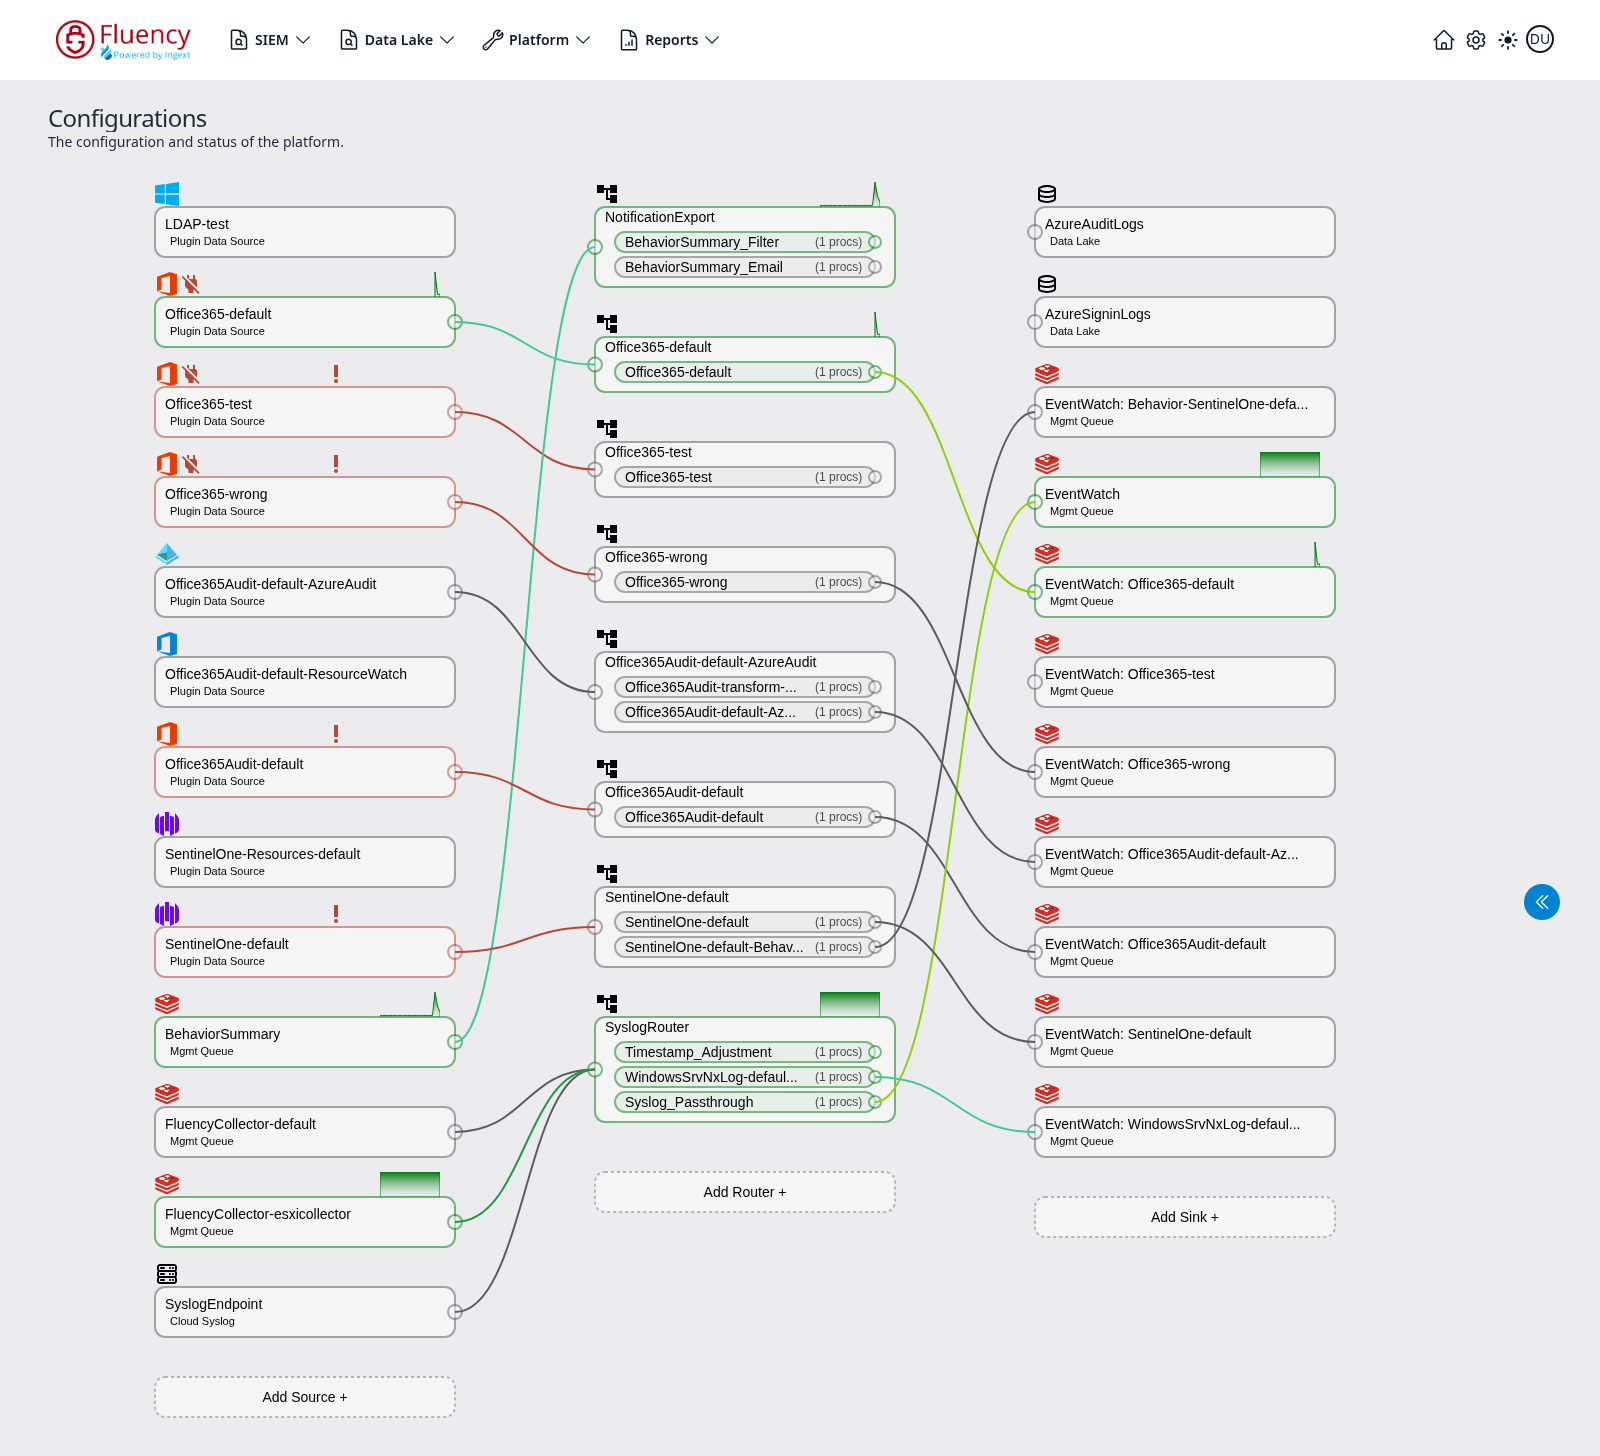
Nodes that are actively moving data are outlined in green and display a small throughput graph; idle nodes are gray, and a node in error is outlined in red and marked with an exclamation mark. The colored lines running between the small circular ports on each card trace the exact path an event takes through the platform.
Sources
A source is an entry point where data arrives — a syslog port, an HTTP event collector endpoint, a cloud API poller, a queue subscription. A source owns the connection, the credentials and the raw format; it does not interpret the content.
Routers and pipes
A router receives records from one or more sources and decides where each record goes. Inside a router, a pipe is an ordered chain of processors that a record passes through. Routing is the decision; the pipe is the work.
Processors
A processor is a unit of transformation applied to a record inside a pipe: parsing raw text into fields, normalizing field names, enriching, filtering, or dropping. Note that processors are written in FPL and that the same word is also used for report processors, which are a different thing (see below).
Sinks
A sink is the destination a record is written to — most commonly a data lake index, but also external forwarding targets. A record can reach more than one sink, and a record that reaches no sink is discarded.
What a "record" is at each stage
Raw bytes at the source, a structured record inside the pipe, a stored event once written to a sink.
Storage: Data Lakes, Indexes, Schemas, and Virtual Tables
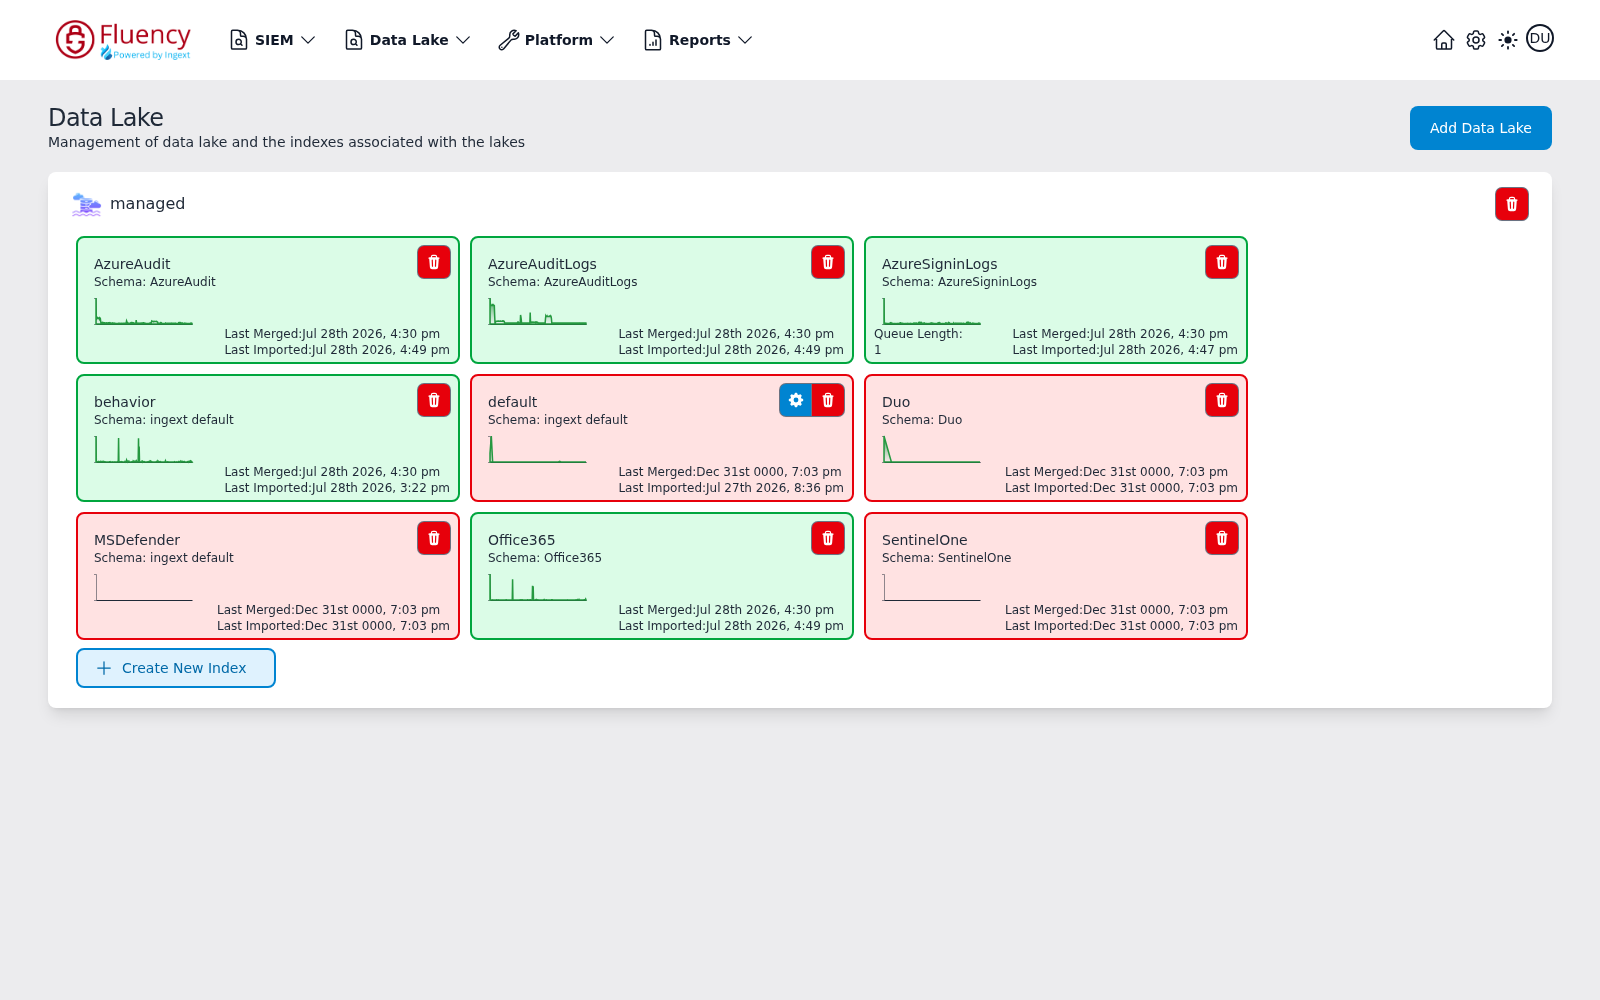
Where data lives after the pipeline is finished with it, and how it is organized so that it can be searched. All four terms below appear on the Data Lake → Management and Data Lake → Schemas pages. Management shows one panel per data lake, holding a card for every index in that lake; an index card names the index and the schema it uses, and its gear button opens that index's Virtual Tables dialog.
Data lake
The top-level storage container for an account. An account can hold more than one data lake, and the lake is where retention, storage location and cost are governed.
Index
The unit inside a data lake that events are actually written to and searched against. Index choice is the first thing a search asks for. Indexes are usually organized by data source or data type, and ingress and storage figures are reported per index.
Schema
The definition of the fields an index contains — names, types, and how they map to normalized field names. The schema is what search and detection logic rely on to find a field by name. See Normalization.
Virtual table
A named, query-backed view over an index that presents stored data in a table shape for querying and reporting. An index is physical storage; a virtual table is a defined view over it. See KQL Query Builder.
Retention, ingress, and scanned data
The platform meters and displays three volume measures — data ingested, data stored, and data scanned by searches. They drive both sizing and, on metered plans, cost. See Platform → Usage.
Events, Behaviors, Behavior Summaries, and Tickets
These four words describe the same underlying activity at four levels of aggregation, and confusing them is the single most common source of misunderstanding for new users. This section should present them as a ladder, smallest to largest, with a worked example carried through all four.
Event
A single stored record — one log line, one API record, one audit entry. Searchable on the Data Lake → Search page. Note that most events are never interesting on their own.
Behavior
A scored observation raised when a behavior rule matches. A behavior points at the event or events that triggered it, carries a severity and a risk contribution, and is attached to an entity. This is the smallest unit an analyst normally looks at.
Behavior summary
The aggregation of all behaviors for one entity over a time window, carrying the entity's accumulated risk score. This is the unit of triage — an analyst reviews a summary, not individual behaviors. See SIEM → Behavior Summary and the Behavior Summary walkthrough.
Ticket
The queue item created from a behavior summary that crosses a threshold or matches a notification condition — the thing that appears in the SIEM → Overview Summary counters and gets assigned, worked, and closed.
Detection Logic: Behavior Rules and Behavior Filters
How the platform decides that stored data is worth an analyst's attention. Both are managed on the SIEM → Behavior Rules page.
Behavior rule
The detection logic itself: a condition evaluated against incoming or stored data that, when it matches, raises a behavior with a severity and a tag set. Rules ship with the product and can also be written locally. See Creating a Behavior Rule.
Behavior filter
An exception to a rule — the mechanism for suppressing known-good activity without disabling the rule that flags it. A filter is the correct answer to a noisy rule: unlike disabling the rule, it is recorded and reviewable. See Managing Rules.
Tuning as an ongoing activity
Detection content is not set-and-forget, and the filter mechanism is the intended tuning surface.
Risk Scoring and Severity
The platform does not present detections as a flat list of equally important alerts; it scores them and ranks the entities they attach to. See Risk Scoring for the full model.
Risk score
An open-ended numeric score accumulated by an entity from the behaviors attached to it. Open-ended means there is no maximum, and the score is an aggregate rather than a property of any single event.
Severity levels
The five bands the interface uses to label risk, in order: Critical, High, Serious, Medium, Low. These are the same five values offered by the Severity Filter on the Overview Summary page.
Scoring inputs
A summary of what feeds a score — rule severity tags, behavioral models, confidence, and analyst suppression feedback. See Risk Scoring for the detail.
Why scores aggregate per entity
The UEBA idea behind it: several medium-severity behaviors on one user can outrank a single high-severity behavior elsewhere.
Entities and Enrichment
Resources and entities
The users, devices, accounts, and other actors the platform tracks across events. The SIEM → Resources page lists the integration-collected records — Applications, Devices, Groups and Users — that these actors are drawn from.
EntityInfo lookup tables
Tables of reference data — user directories, asset inventories, allow lists, threat lists — that the pipeline and detection logic can look up to enrich or qualify a record. See SIEM → EntityInfo Tables.
Applications, Integrations, and Collectors
Three words for three different things, all of which show up when you go to connect a data source. This section exists mainly to disambiguate them.
Application
A packaged bundle that stands up everything one data source needs — source, processors, and sink — from a template, so that connecting a source is a form to fill in rather than a pipeline to build. Managed on Platform → Applications.
Integration
The connection to an external service that an application uses: the credentials, endpoints, and permissions. Managed on Platform → Integrations. One integration can serve more than one application.
Collector
Software you run inside your own network to reach data that the cloud cannot reach directly — on-premises syslog, LDAP, local files. See Fluency Collector and Why Use a Collector.
Which one you need
Which you need depends on where the data lives: a cloud service is reached with an integration, an on-premises device usually needs a collector. See How Data Gets In and the Integration Matrix.
FPL and Its Object Types
FPL (Fluency Programming Language) is the language used to express everything the platform does to data — parsing, enrichment, detection, notification, and reporting. See the FPL section for the syntax.
Processors
FPL programs that transform records inside a pipe. The most common object type, and the one a new user is most likely to read before they write. Managed on Platform → Processors.
Receivers
FPL objects that accept data into the pipeline from a protocol or endpoint. A receiver is the implementation behind a source: the source is the pipeline node, the receiver is the FPL object that accepts the bytes.
Packers
FPL objects that batch, format, and hand off records on the way out of the pipeline. A packer runs just before the sink that sends the records on.
Actions
FPL objects that do something outside the platform — send an email, post to Slack, call a webhook, open a ticket. Note that notification endpoints are backed by actions, which is why they are configured together. See Actions.
Rules
FPL objects that express detection conditions.
Where each type is managed
All five object types share the Platform → Processors page, separated by its tab bar.
Reports and Dashboards
Report processor
The FPL program that produces a report's data. Managed on Reports → Processors.
Report dashboard
The rendered, viewable output — charts and tables — grouped in the interface into scheduled and on-demand reports. See Reports → Dashboard.
Scheduled versus on-demand
The difference between a report that runs on a timetable and delivers itself, and one you run when you need it. See Reports → Scheduler.
Dashboards versus search
A clarifying note on when to build a report and when to just save a search, since both answer "show me this data regularly".
Notifications and Endpoints
Notification endpoint
A configured destination for outbound notifications — email or Slack — each backed by an FPL action. Configured on Platform → Administration → Notifications.
Notification rule
The condition that decides which events or tickets are sent to which endpoint. The endpoint is where it goes; the rule is what goes there.
Accounts, Users, and Roles
Account
The tenant boundary: one organization's data lakes, pipeline, rules, and users. Note the MSSP case, where one provider oversees many accounts, and link to MSSP Sync.
User and role
How access is granted and scoped. Link to Managing Users and Managing Roles.
API token
Programmatic access to the same functions the interface exposes. Link to API Tokens and the REST API reference.
Related
- Glossary — the full alphabetical term list; this page covers only the concepts you need before your first session
- Quickstart — the same concepts, applied, in about an hour
- How Data Gets In — the five ingestion methods in detail
- Page Functionality — a page-by-page reference for every screen named above
- Fluency Platform and the pipeline pages: Source, Router, Processor, Sink
- Data Storage — how the data lake stores and retains events
- Risk Scoring — the full scoring and severity model
- FPL — language reference