Reports
Reporting turns stored events into a repeatable, shareable answer: an FPL processor gathers and shapes the data, a report binds that processor to a set of arguments, a schedule decides when it runs, and a dashboard displays the result. This section teaches the workflow end to end — how to author a report, how to build the dashboard that presents it, and how to schedule and deliver it. The three screens involved — Dashboard, Processors, and Scheduler — are shown under The Three Reports Pages below.
What a Report Is
The word is overloaded, so start with the object. A report is a saved FPL processor plus a declared set of arguments, which produces a result set that can be rendered as dashboard widgets, exported, or consumed by API. Distinguish it from an ad-hoc search in Data Lake → Search and from a streaming detection in Detections: a report runs on demand or on a schedule over stored data, and its output is a document, not a stream.
Report Categories
The product groups report processors into three categories on the Processors page — Dashboard Reports, Reports, and Tasks. Dashboard reports render widgets, plain reports produce tabular or document output, and tasks perform work (such as loading a resource table) rather than producing a report to read.
How Reporting Works End to End
The lifecycle, in order, with each step naming the page where it happens. This is the spine of the section.
1. Author the Processor
Write the FPL that queries and shapes the data, in the report editor reached from Reports → Processors → Add Report. Covered in Creating a Report.
2. Declare Arguments
The report's typed parameters and defaults — commonly a from/to window with defaults such as ago(7d) and now() — let the same processor be re-run over different ranges and subjects without editing code.
3. Run and Iterate
Run the report from the editor or from the Scheduler's run dialog, read the output, and refine. Trace and error logs in the editor are the primary debugging surface.
4. Present the Result
The widgets that render the result, and the dashboard that groups them. Covered in Dashboards.
5. Schedule and Deliver
Set the recurrence, timezone, and export targets, and monitor prior runs. Covered in Scheduling and Delivery.
6. Maintain
Clone, export, and import report definitions to move them between accounts; review run cost and duration; retire reports nobody reads.
The Three Reports Pages
How the product's three screens map onto the lifecycle above.
Dashboard
Reports → Dashboard (/reports/Dashboard) is the consumption surface: a card grid of report dashboards split across Scheduled Reports and On-Demand Reports tabs, with a widget preview on each card and a "Report has not been run yet" placeholder on reports that have never run.
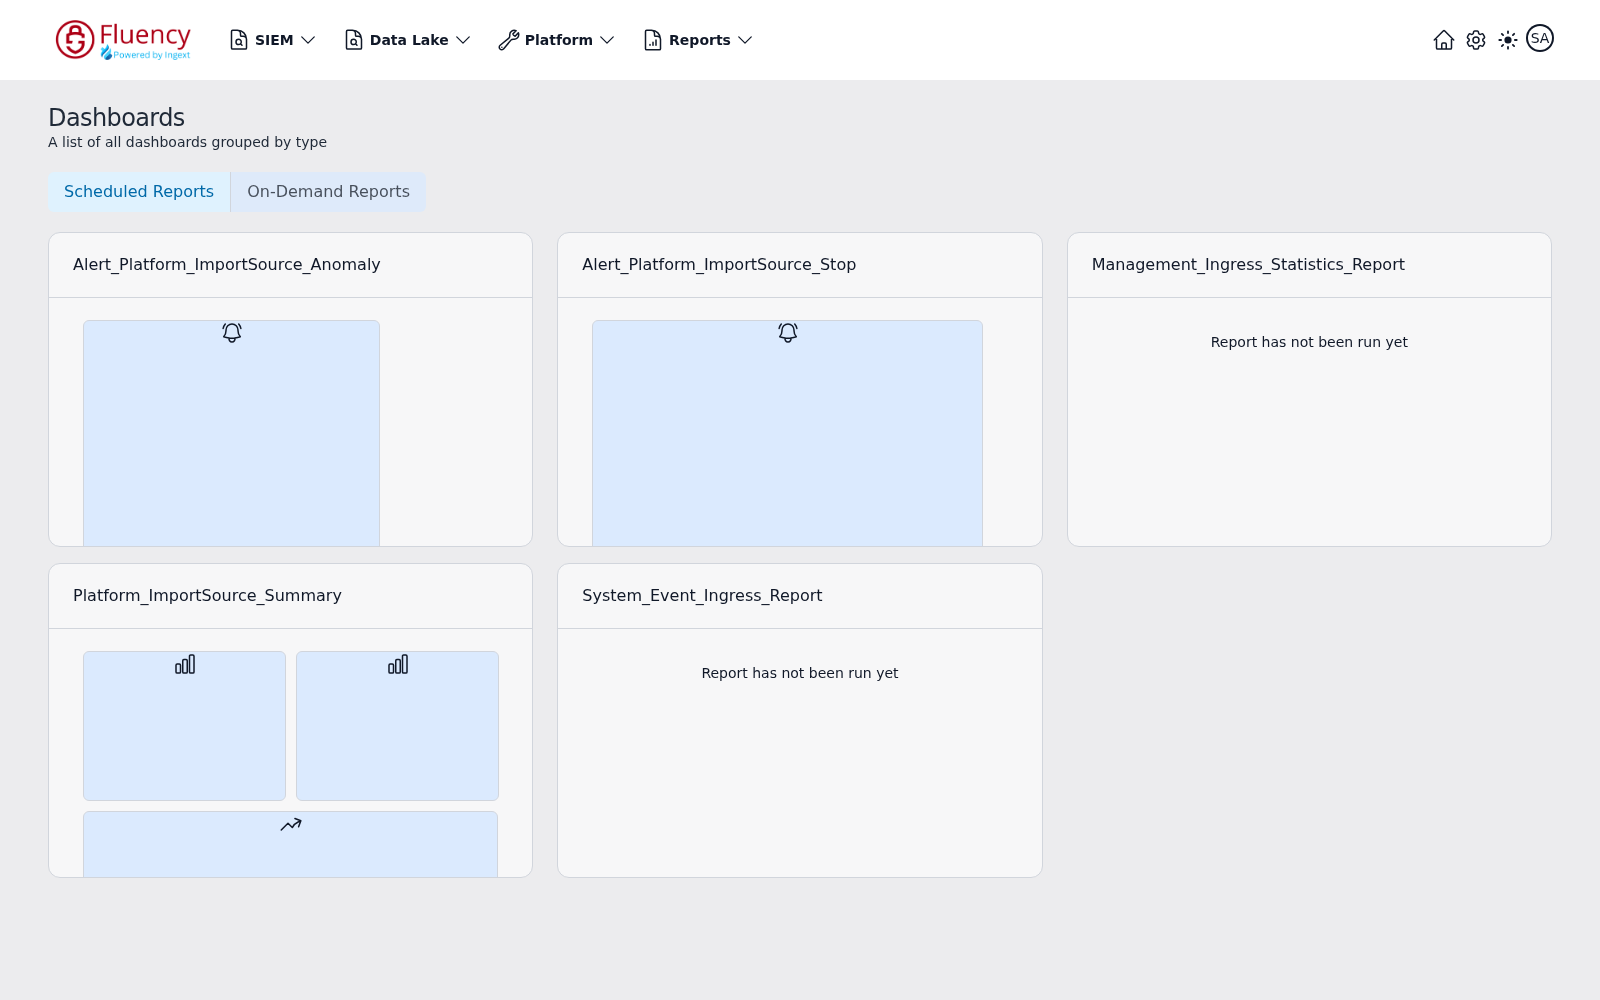
The header reads Dashboards, subtitled A list of all dashboards grouped by type. Scheduled Reports is the tab selected by default. Cards are laid out three per row; each has a title bar carrying the report name and a body that previews the report's widgets as thumbnail tiles, the tile icon indicating the widget type.
Processors
Reports → Processors (/reports/processors) is the authoring surface: a searchable, sortable card list of FPL report processors filtered by the Dashboard Reports / Reports / Tasks category tabs, with Import Report and Add Report actions, per-card Clone, and an inline prior-runs history.
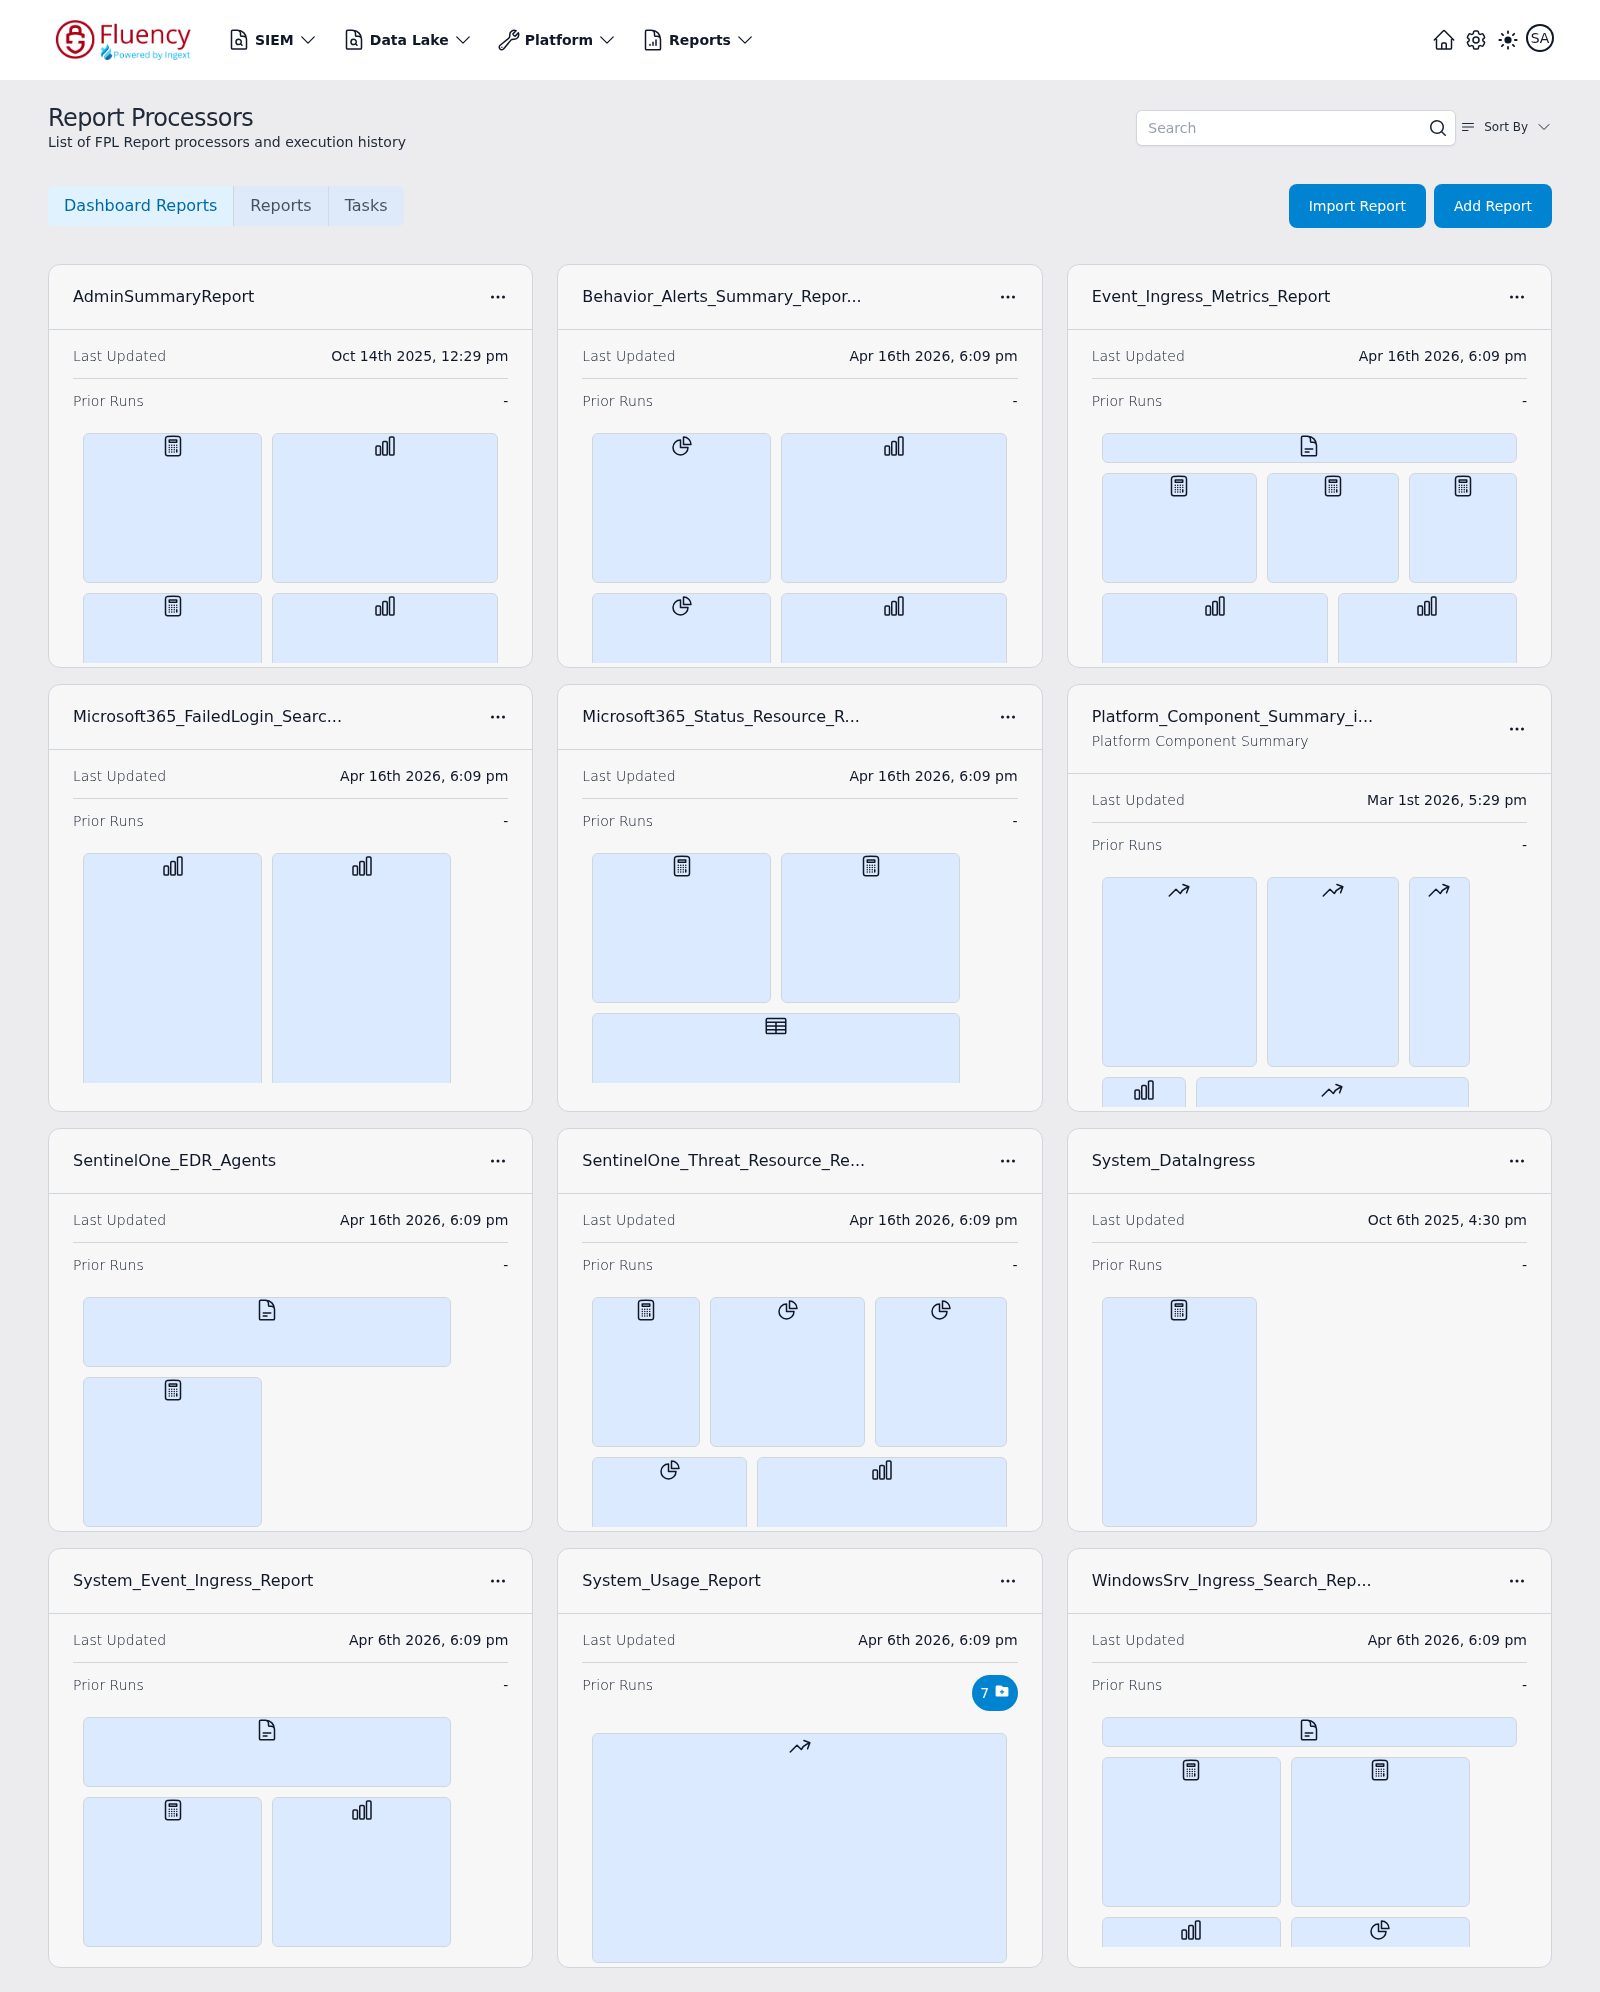
The header reads Report Processors, subtitled List of FPL Report processors and execution history, with a Search box and a Sort By dropdown (Name: A-Z, Name: Z-A, Last Updated) on the right. Each card shows the processor name, an optional description, Last Updated, and Prior Runs — a dash when there is no recent run history, or a blue count badge that expands the run list inside the card.
Scheduler
Reports → Scheduler (/reports/scheduler) is the operations surface: a table of schedulable reports with Edit, Schedule, and Run actions per row, expandable run history showing ID, status, launch time, duration, and cost, and Import / Export of report definitions.
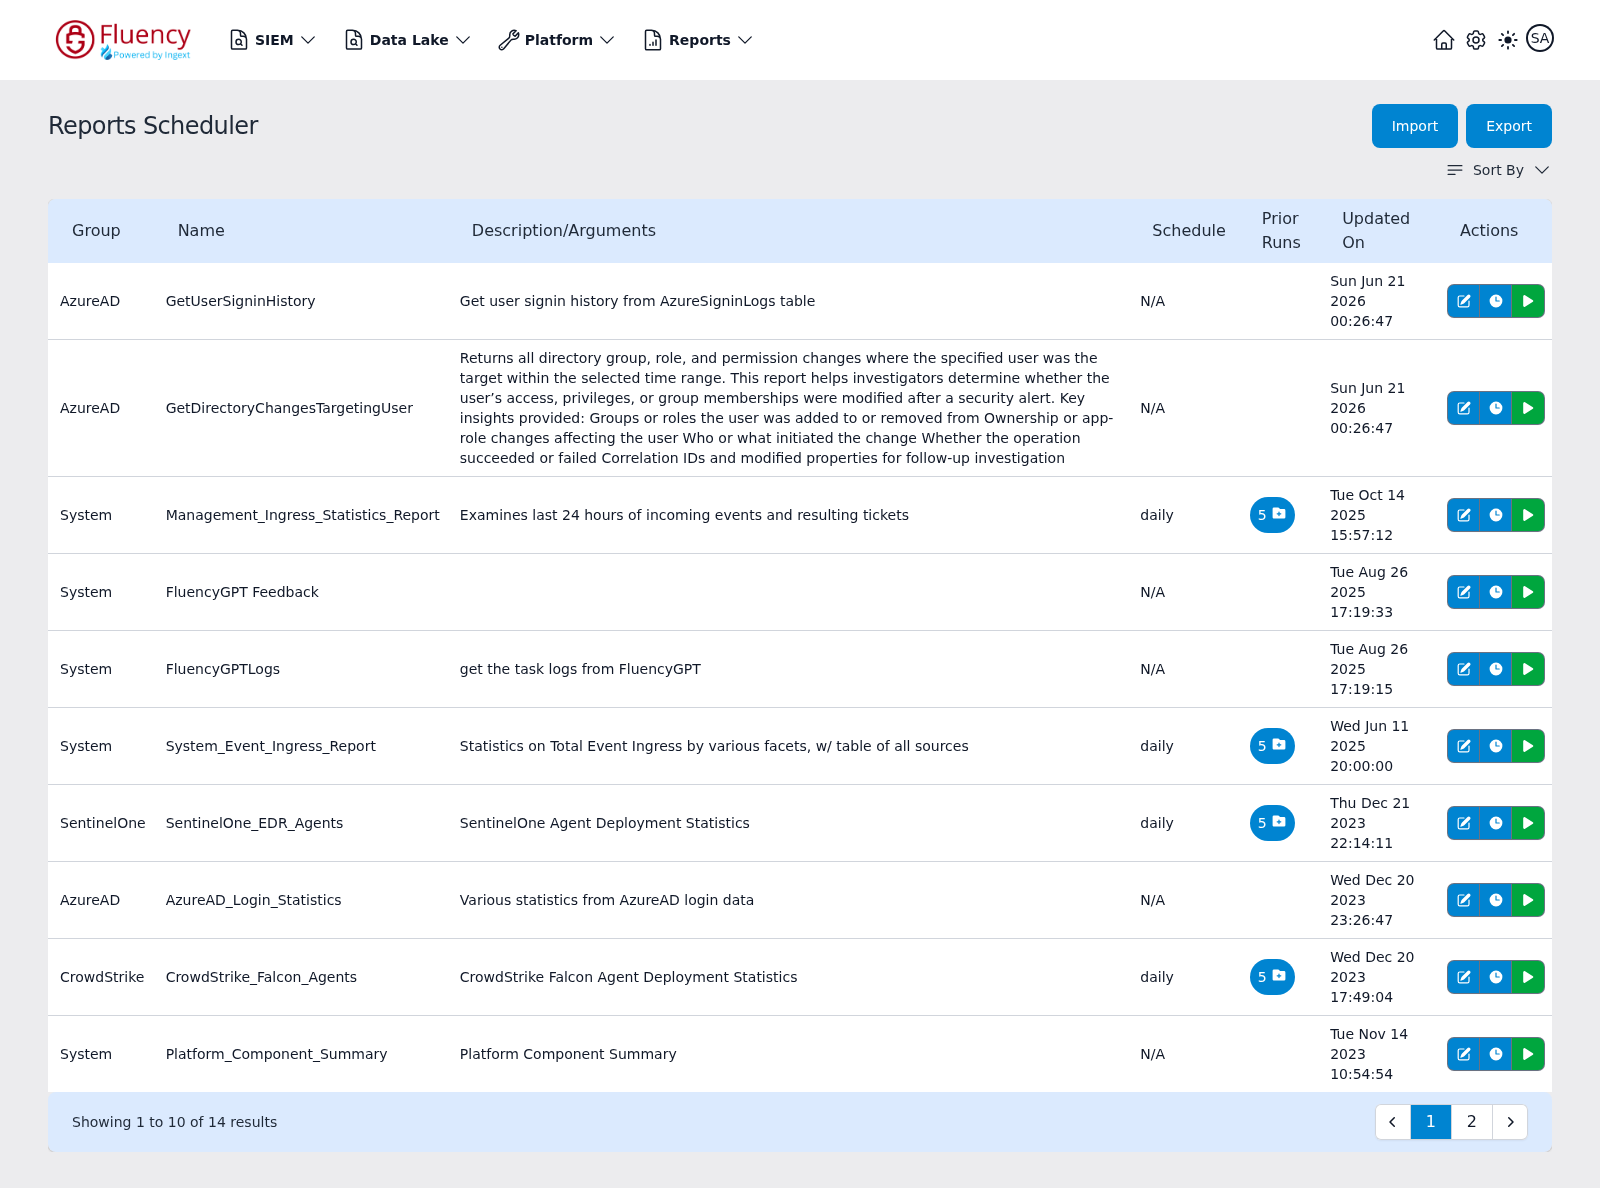
The table's columns are Group, Name, Description/Arguments, Schedule, Prior Runs, Updated On, and Actions; the three action icons are edit (pencil), schedule (clock), and run (green play). A footer bar reports the visible range and pages through the table.
How the Three Relate
The relationship is the thing readers get wrong: a processor on the Processors page is the code, a report row on the Scheduler is that processor bound to arguments and a schedule, and a dashboard on the Dashboard page is the rendered output of the most recent run. Note that a report's name and its processor's name can differ.
Cost and Resource Use
Reports read stored data, and stored-data reads are billable. Run cost is visible in the Cost column of the Scheduler's run history. Bounded time ranges, index selection and avoiding overlapping schedules are what keep it down. See Platform → Usage.
Related
- Creating a Report — authoring an FPL report processor
- Dashboards — building and reading report dashboards
- Scheduling and Delivery — schedules, exports, and run history
- Report Cookbook — worked examples
- Page Functionality → Reports — the interface reference
- Programming Language — the language reports are written in
- Appendix → Cookbooks → Reports — existing report scripts