Scheduling and Delivery
A report that has to be run by hand is a report that stops being run. This page covers the operational half of reporting: putting a report on a recurrence, getting the timezone right, sending the output somewhere useful, and reading the run history afterward to confirm it worked and to see what it cost. Everything here happens on Reports → Scheduler (/reports/scheduler).
The Scheduler Page
What the Table Shows
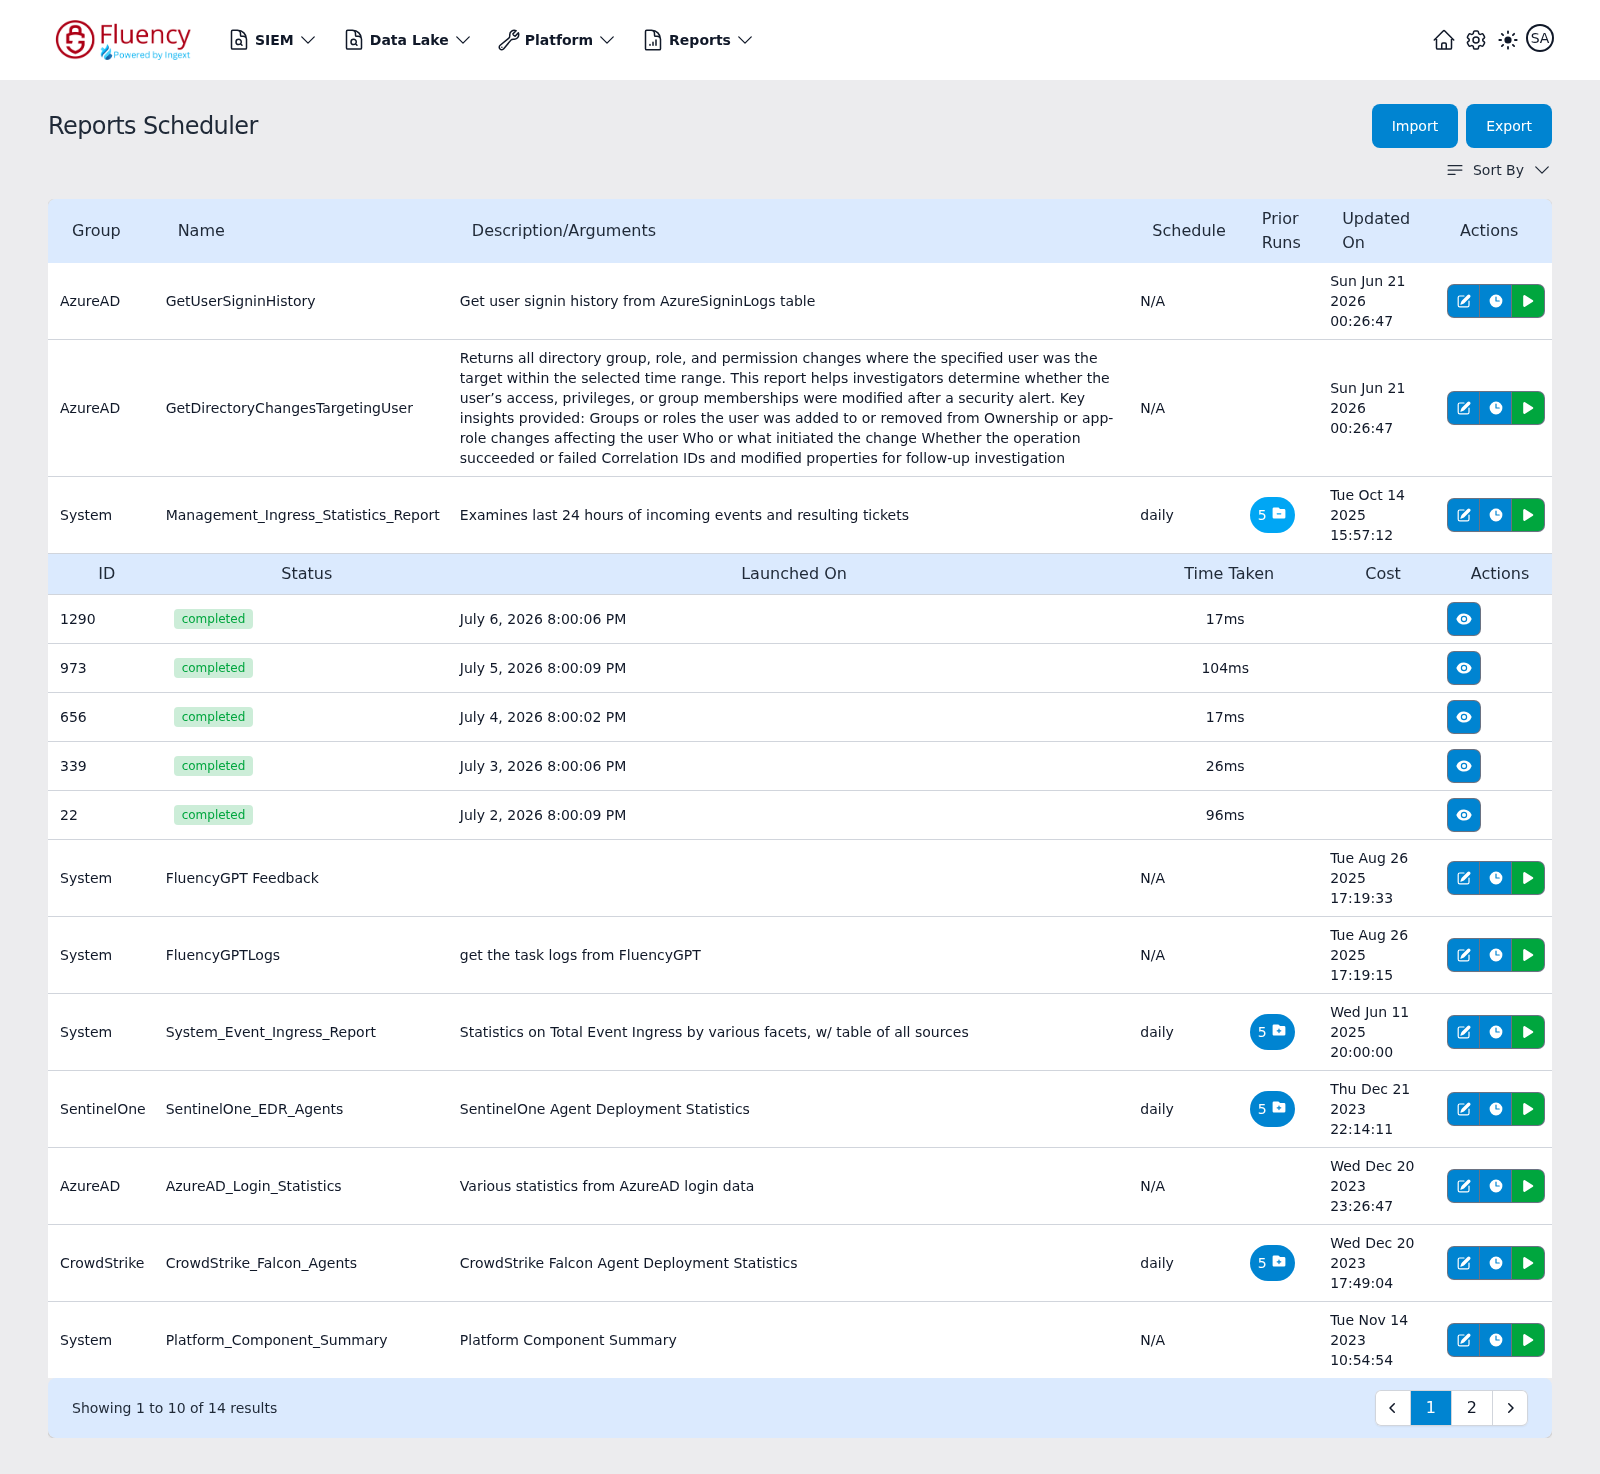
One row per schedulable report, with Group, Name, Description/Arguments, Schedule, Prior Runs, Updated On, and Actions. Group is the category or origin of the report — a vendor name, or System. An unscheduled report shows N/A in the Schedule column.
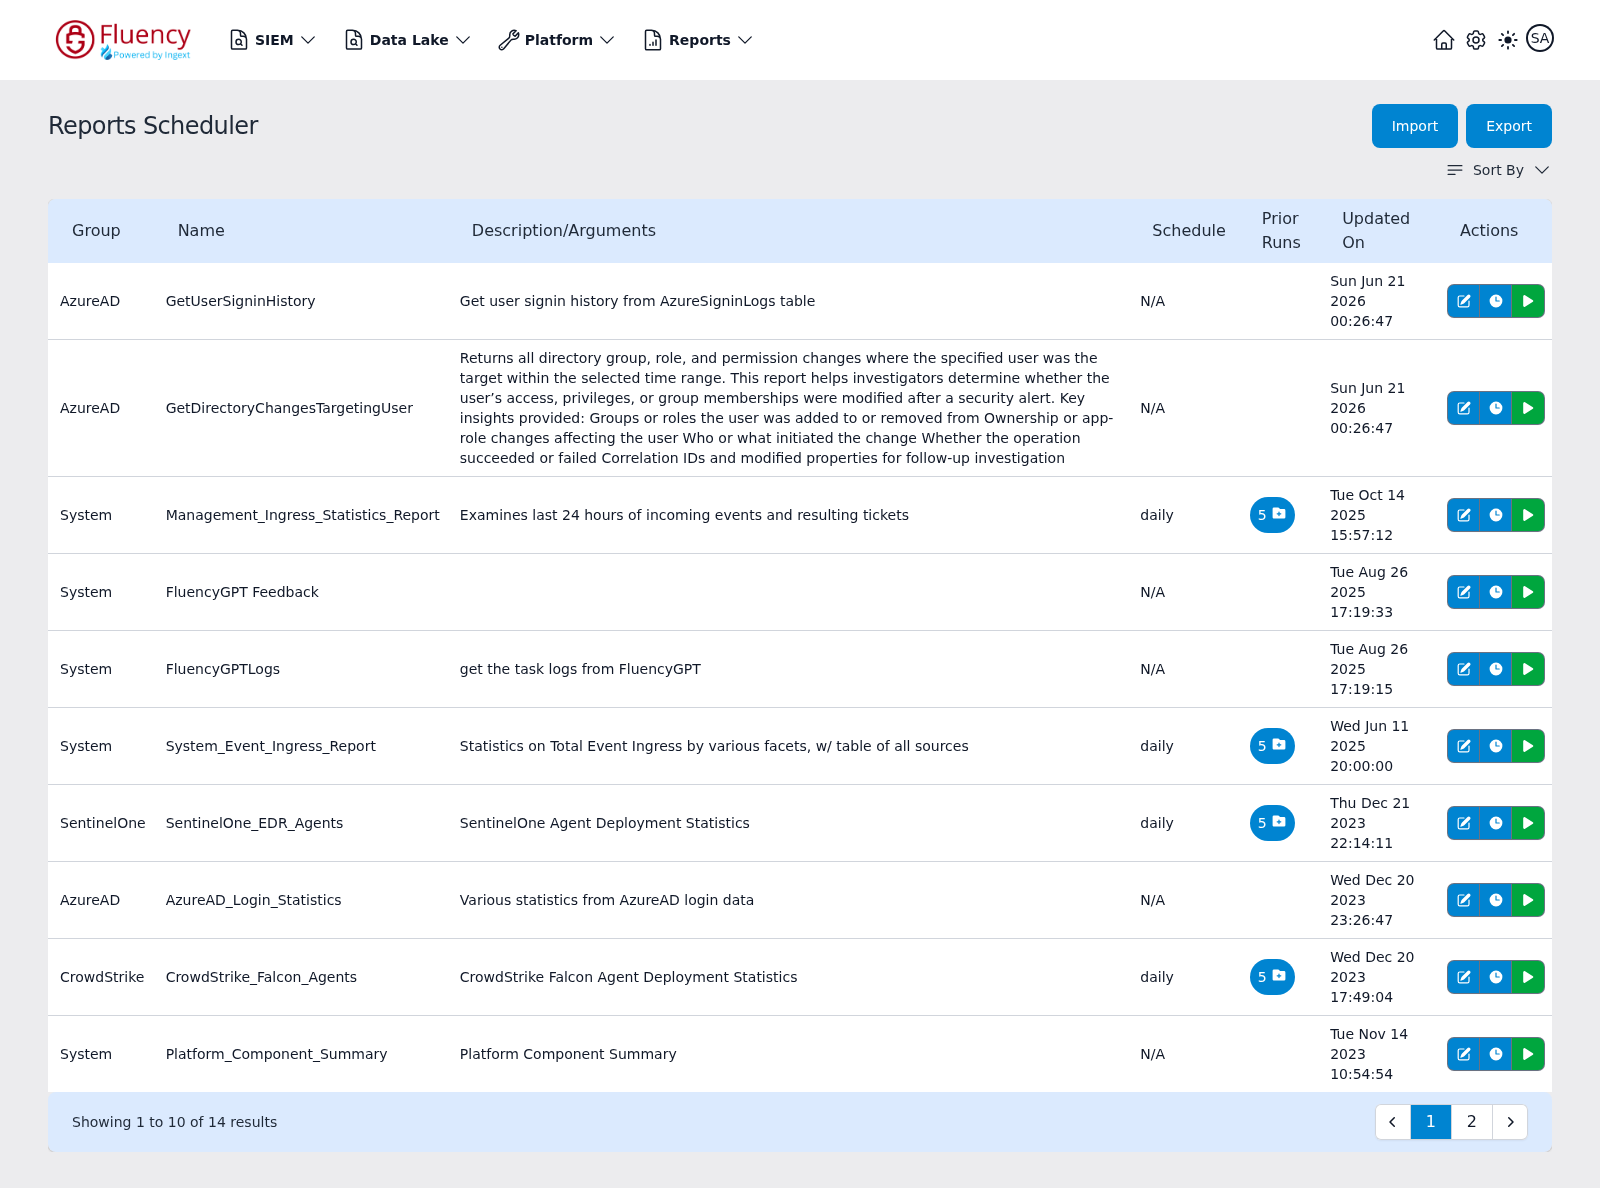
The page header carries the title Reports Scheduler with the Import and Export buttons on the right, and a Sort By dropdown sits above the table. The footer bar reports the visible range (for example Showing 1 to 10 of 14 results) with previous and next arrows and numbered page buttons.
Finding a Report
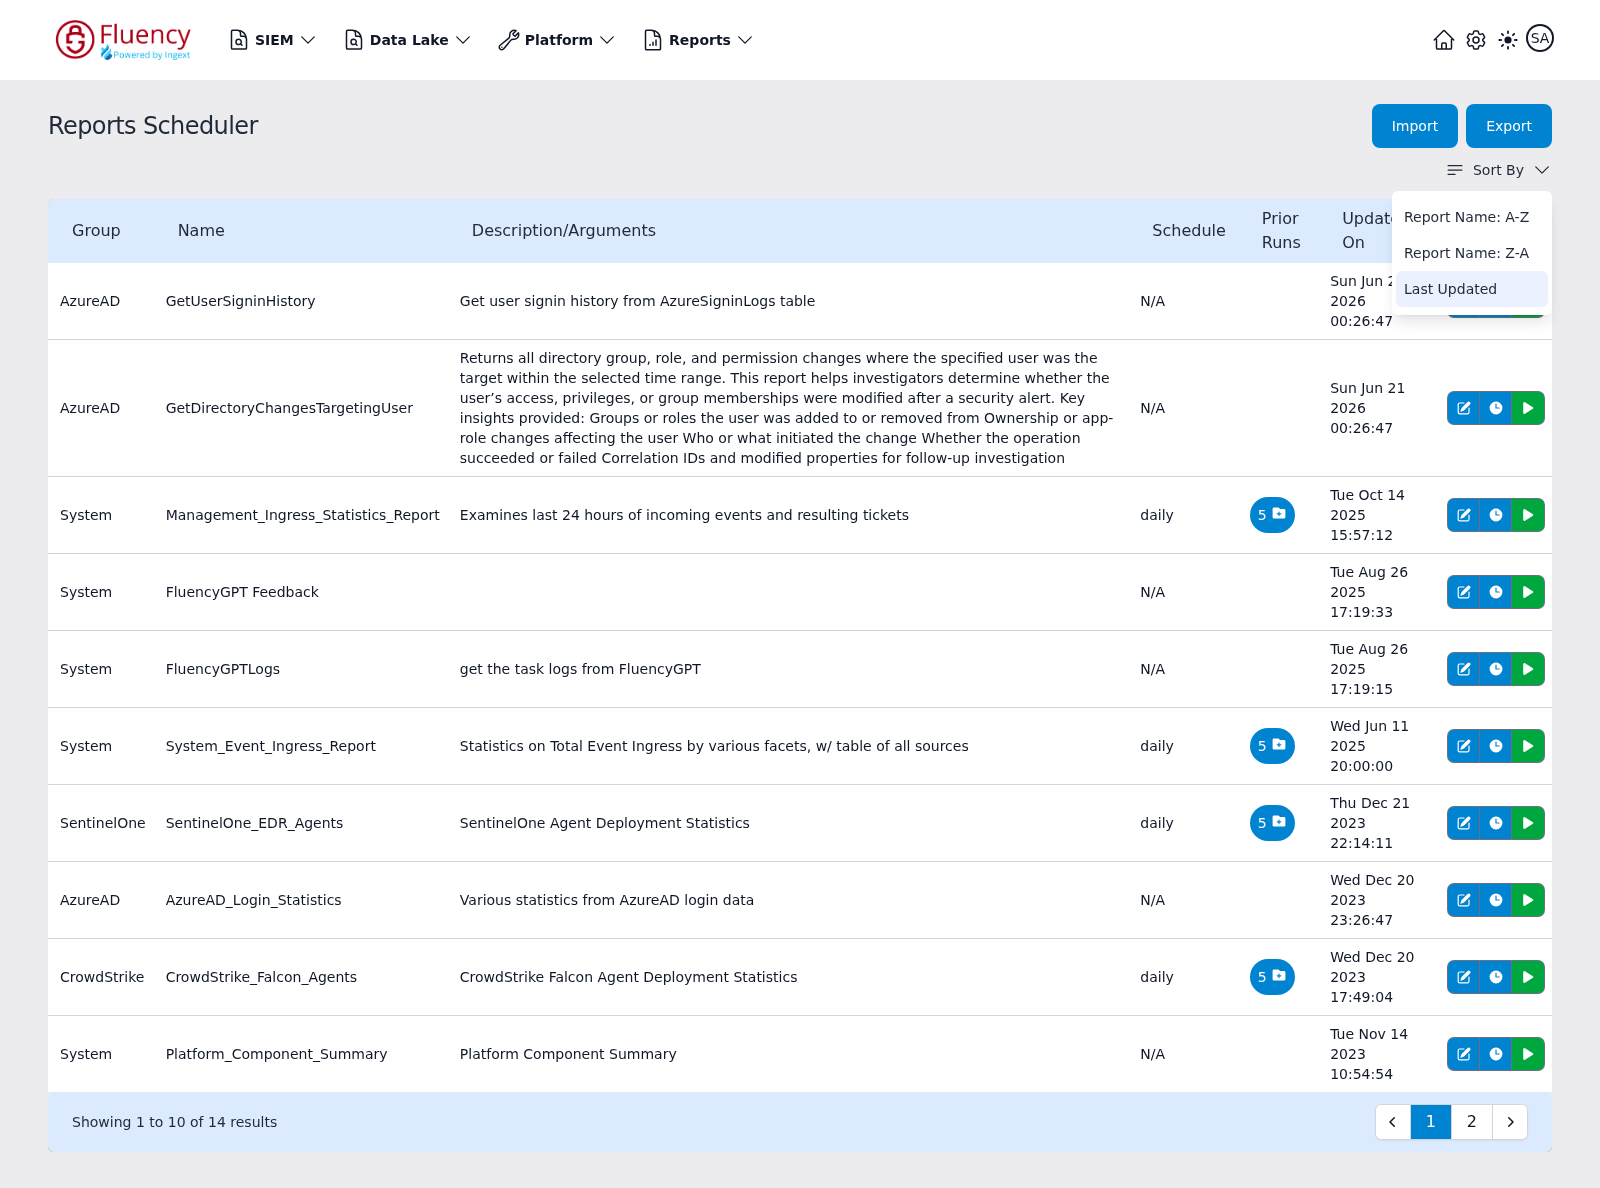
Sort by Report Name: A-Z, Report Name: Z-A, or Last Updated, and page through the table. The table reorders as soon as an option is picked.
Row Actions
Three icons sit on every row: edit (pencil), schedule (clock), and run (green play). The clock and play icons are covered below.
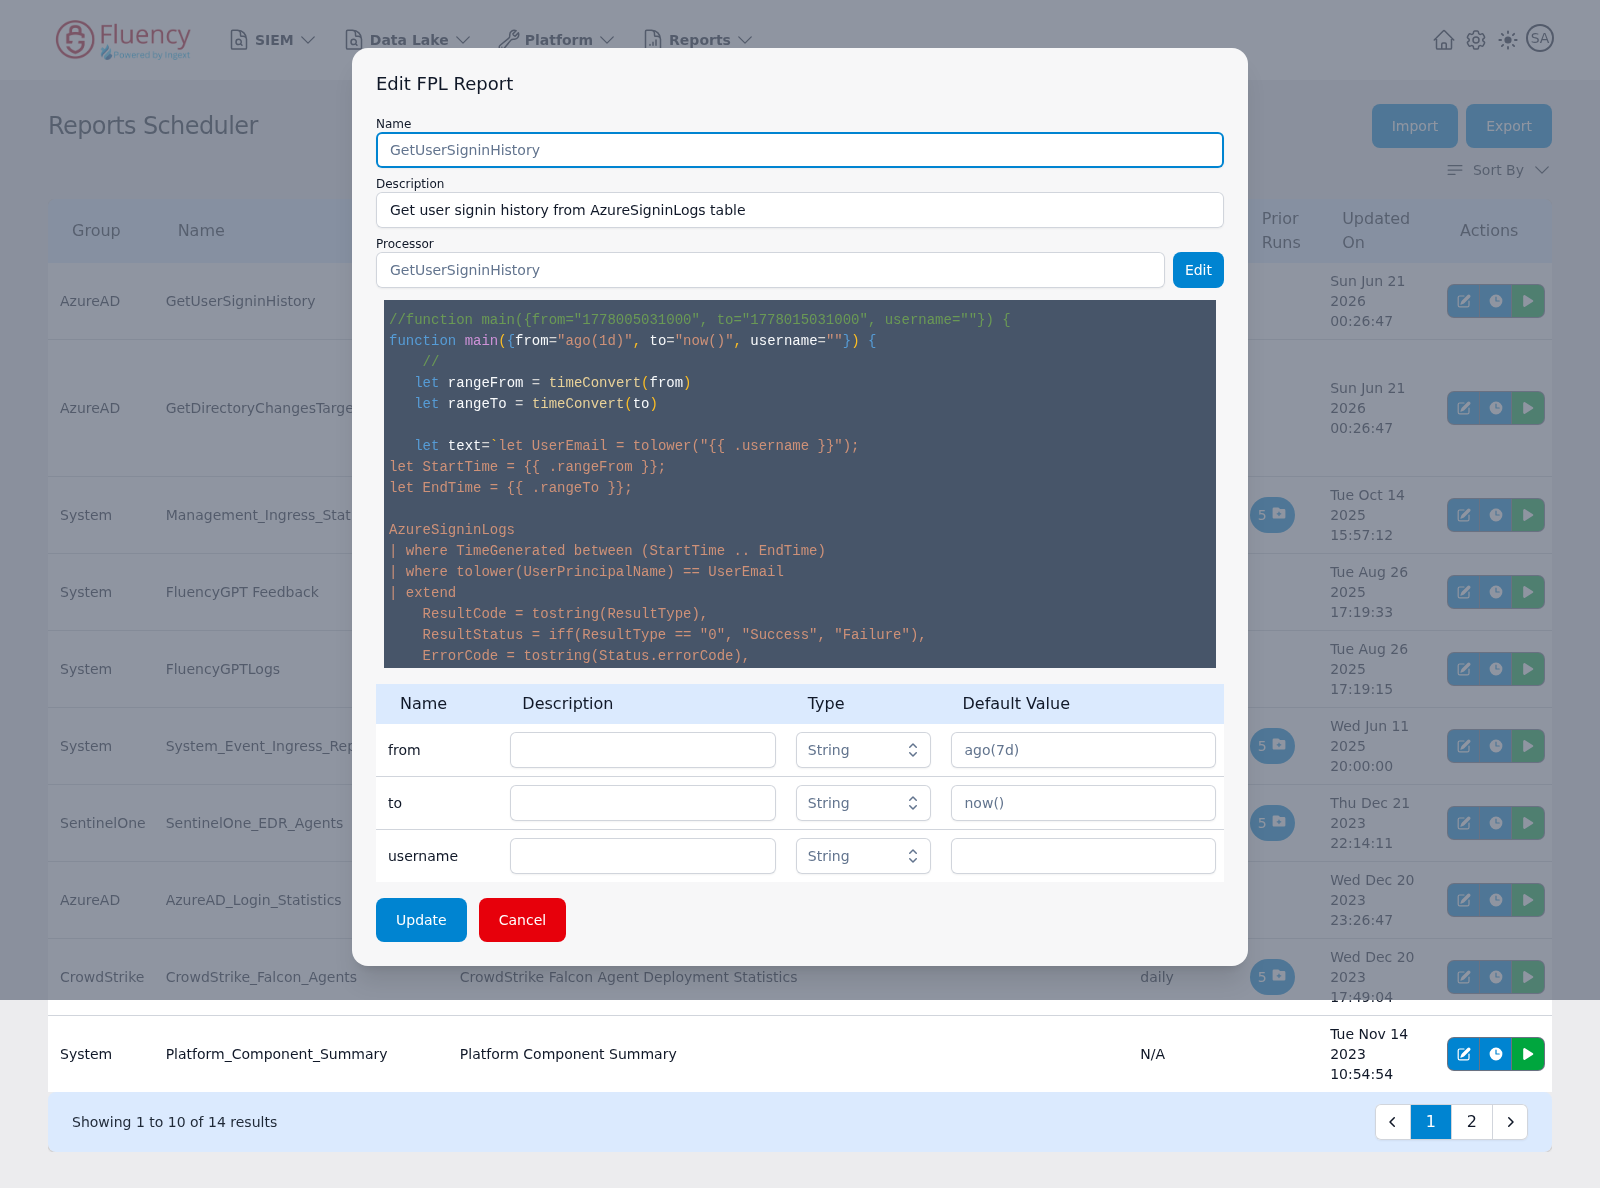
The pencil icon opens Edit FPL Report, which holds the report's Name and Description, the Processor the report is based on with an Edit button that opens that processor (the processor can carry a different name than the report), a read-only preview of its FPL code, and an arguments table with Name, Description, Type, and Default Value columns — one row per declared argument. Update saves the changes; Cancel closes without saving.
Running a Report on Demand
The Run Dialog
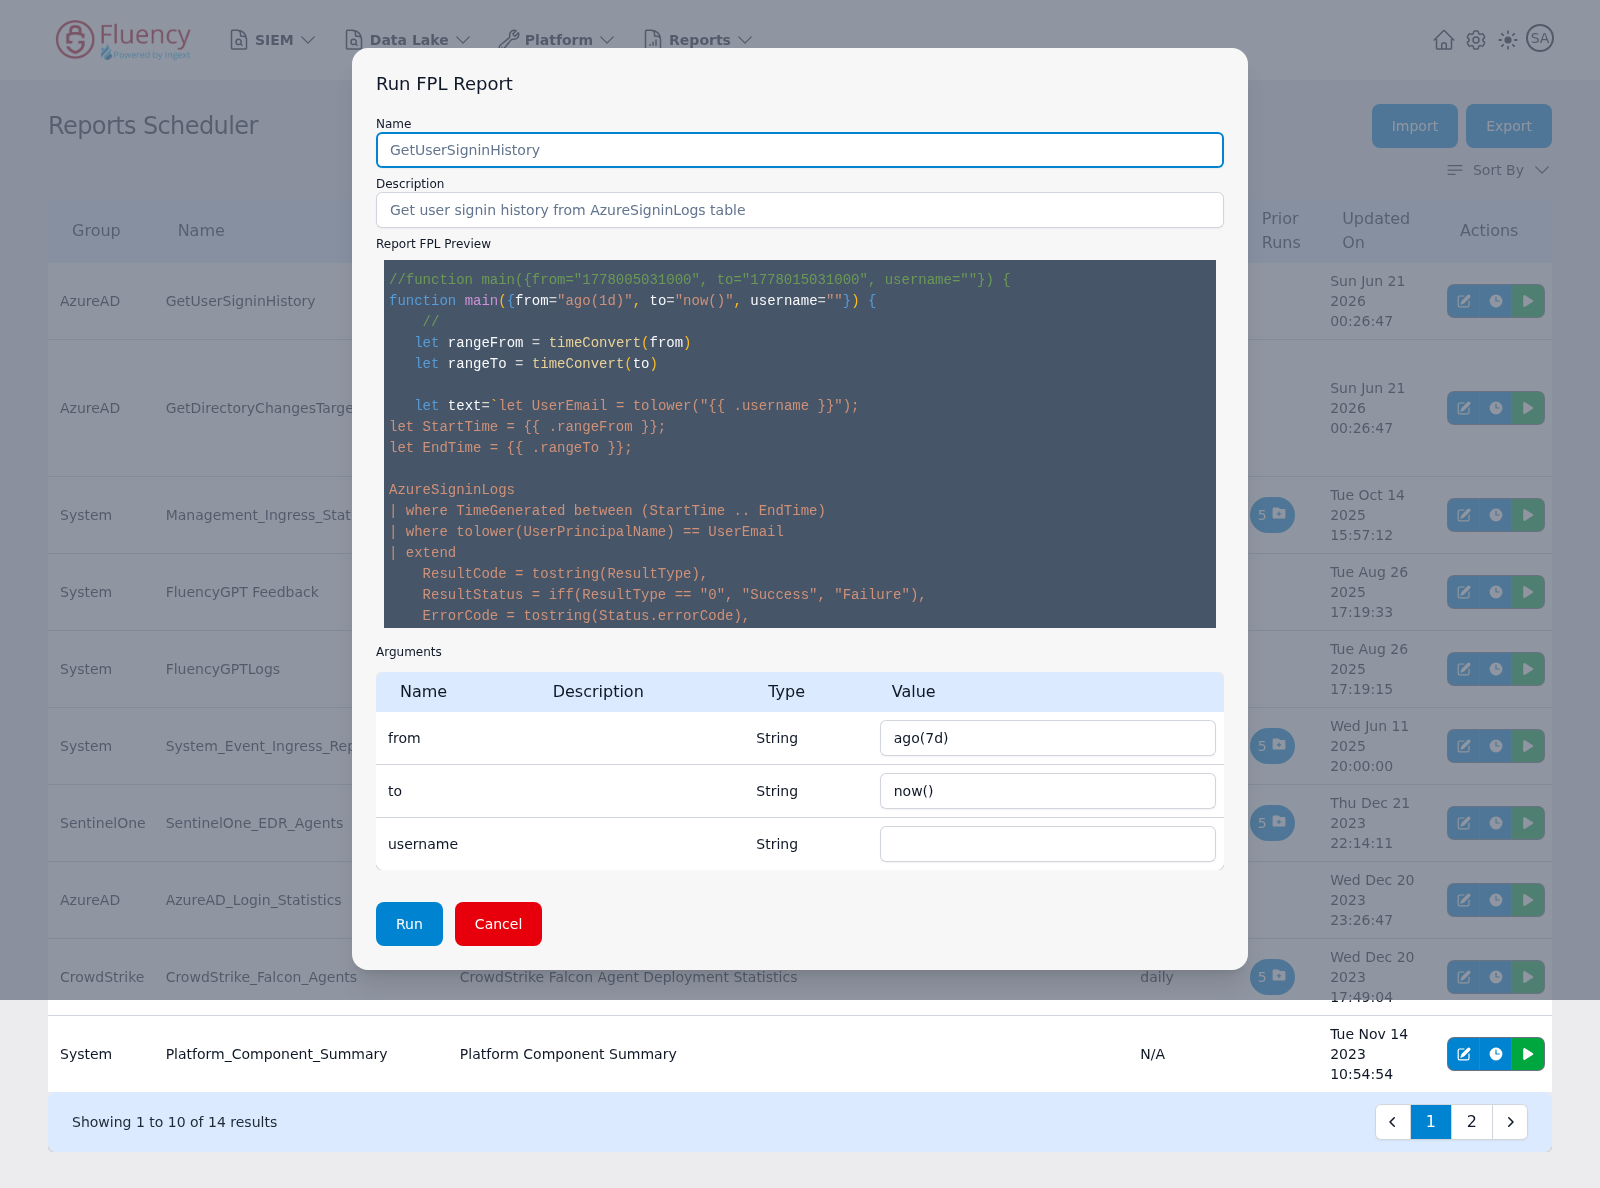
The play icon opens Run FPL Report, which shows the report name and description, a read-only Report FPL Preview, and an editable arguments table with Name, Description, Type, and Value columns. Run starts the run; Cancel closes the dialog without running.
Supplying Arguments for a Run
Overriding the declared defaults for this run only — for example setting from to ago(7d) and to to now(), or naming the user a per-subject investigation report should cover. The argument model itself is in Creating a Report.
Scheduling a Report
Enabling the Schedule
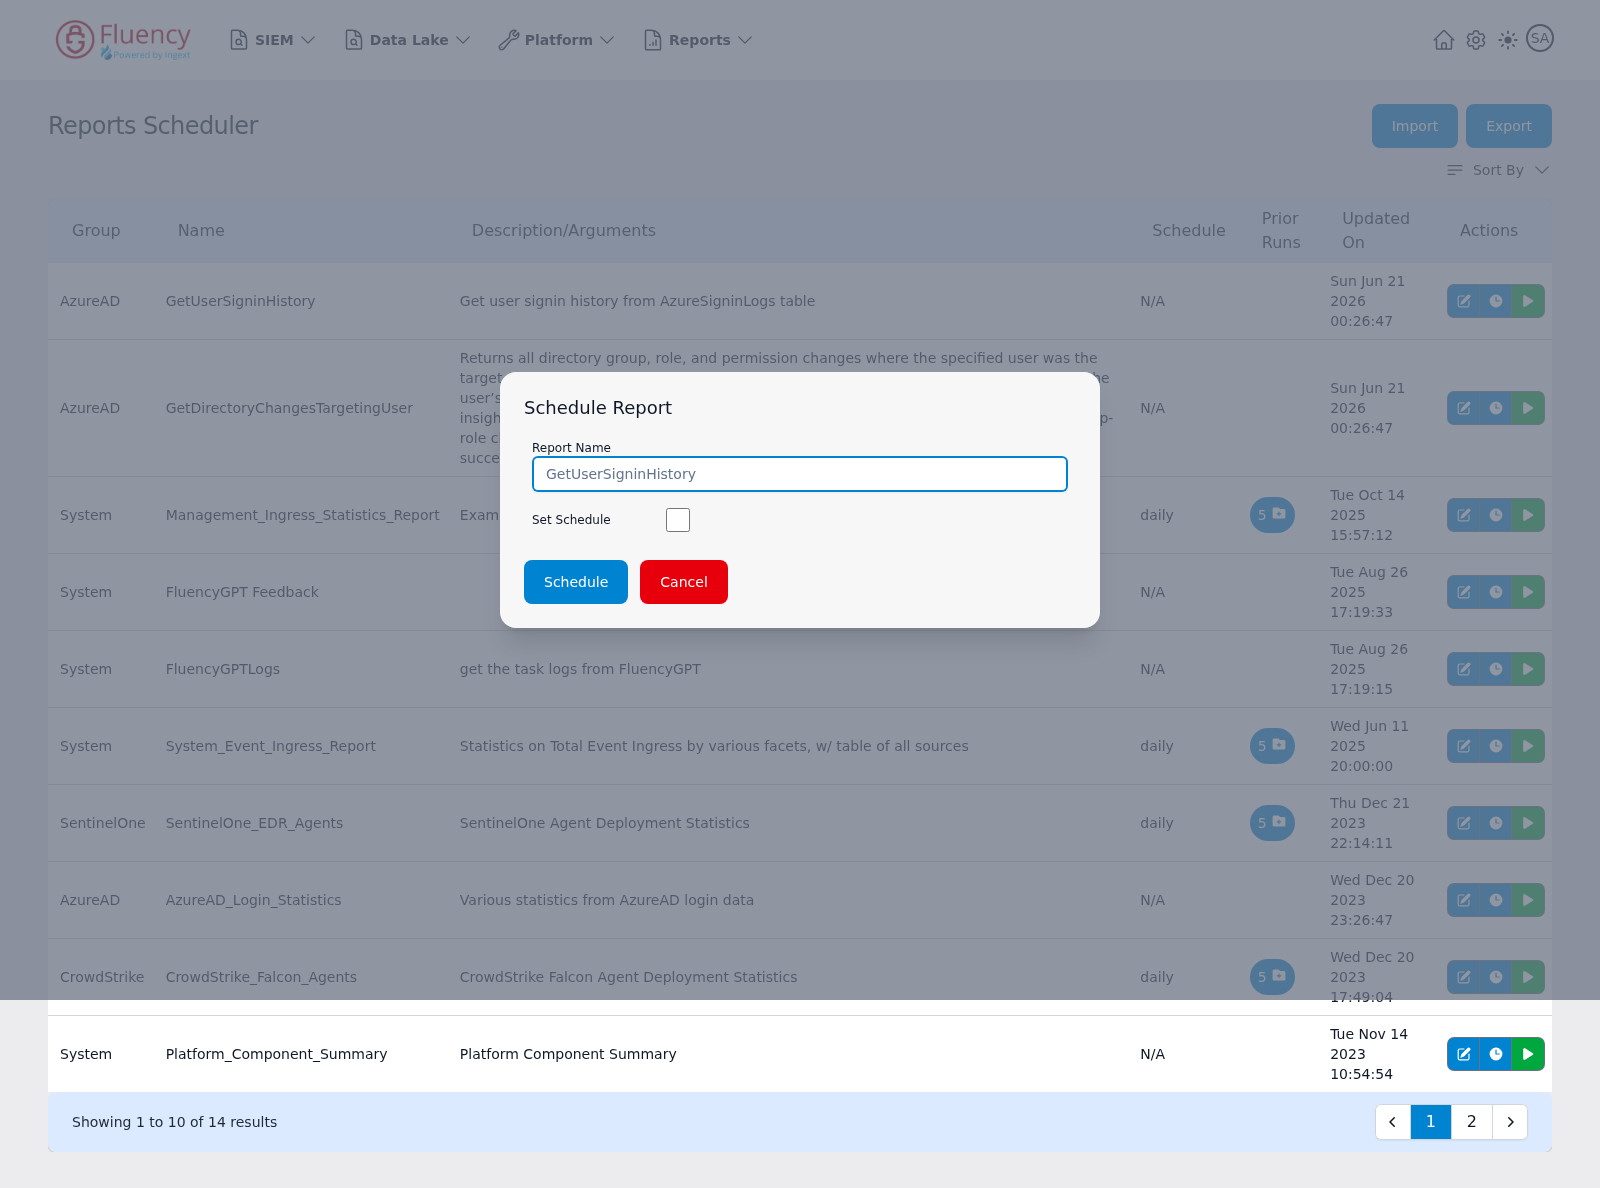
The clock icon opens Schedule Report. For an unscheduled report it shows only the Report Name and an unchecked Set Schedule box, with Schedule and Cancel buttons at the foot.
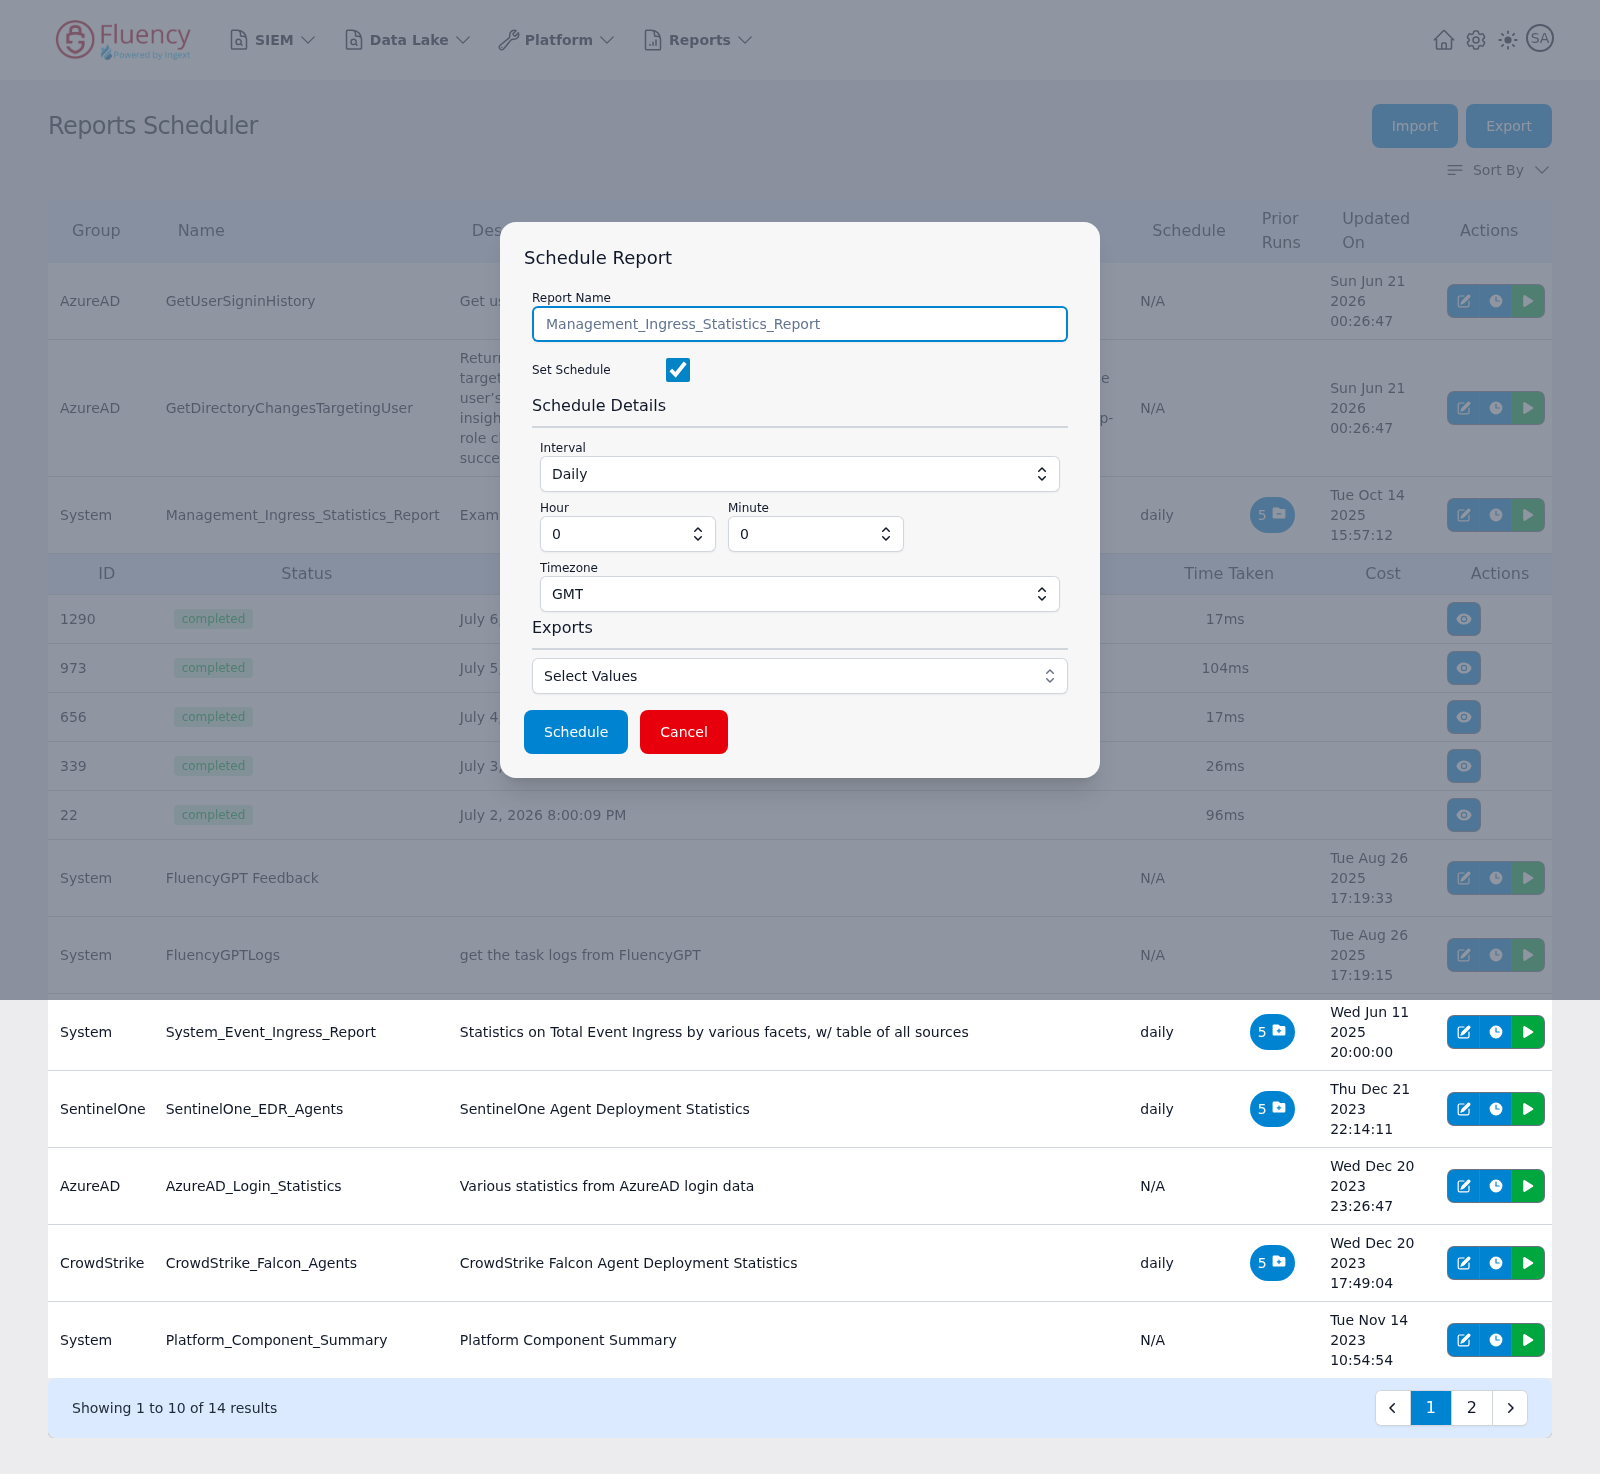
Checking Set Schedule expands the dialog to reveal a Schedule Details block — an Interval dropdown with Hour, Minute, and Timezone selectors — and an Exports dropdown. For an already-scheduled report the dialog opens with Set Schedule already checked and the current settings loaded.
Timezone
The timezone selector (for example GMT) that the hour and minute are interpreted in. This is the single most common source of "the report ran at the wrong time" tickets: the schedule's timezone, the timezone the data is stamped in, and the timezone the reader is in are three separate things and need not agree.
Delivery and Exports
The Exports Setting
The Exports control in the Schedule dialog is a Select Values dropdown that chooses export targets for a scheduled report's output.
This manual does not list the export targets the Exports dropdown offers, or how each is configured. Open the dropdown in your own account for the targets available to your deployment.
Exporting the Report Definition
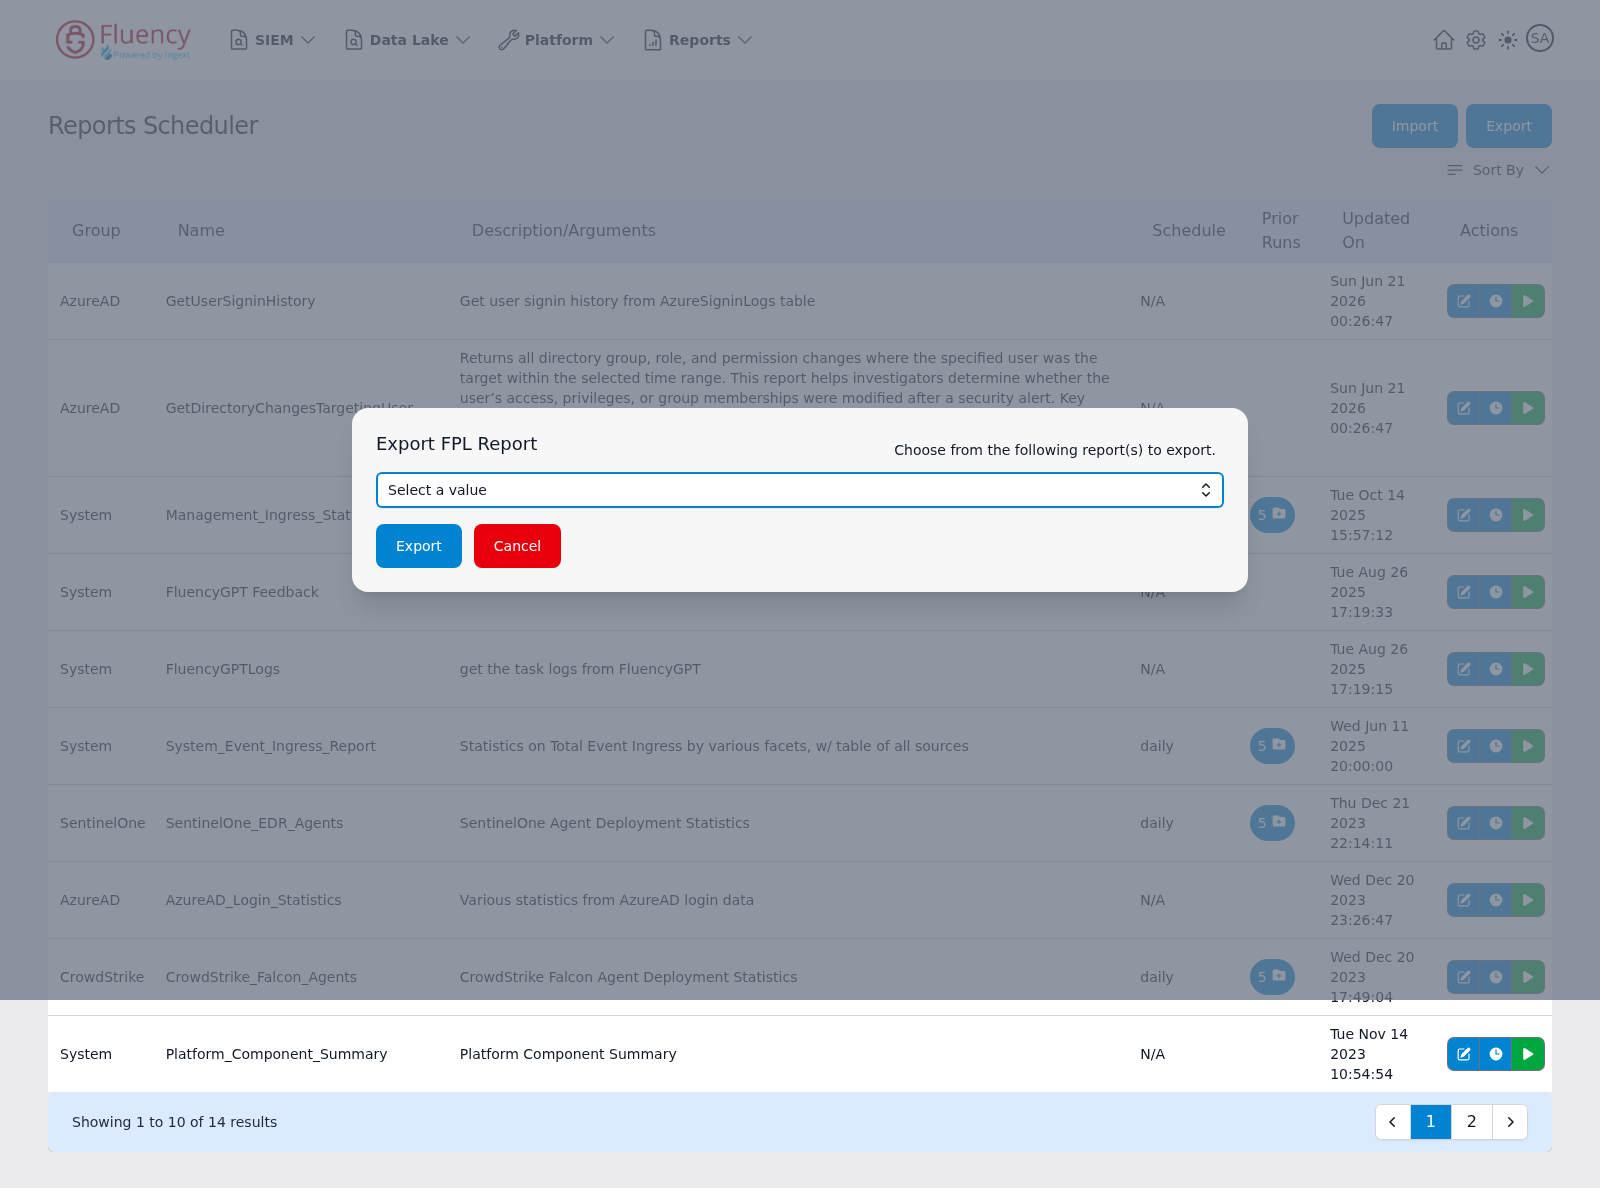
Distinct from delivering output: the Scheduler's Export button opens Export FPL Report, labeled Choose from the following report(s) to export. It holds a Select a value dropdown for picking the report, an Export button that downloads its definition, and Cancel.
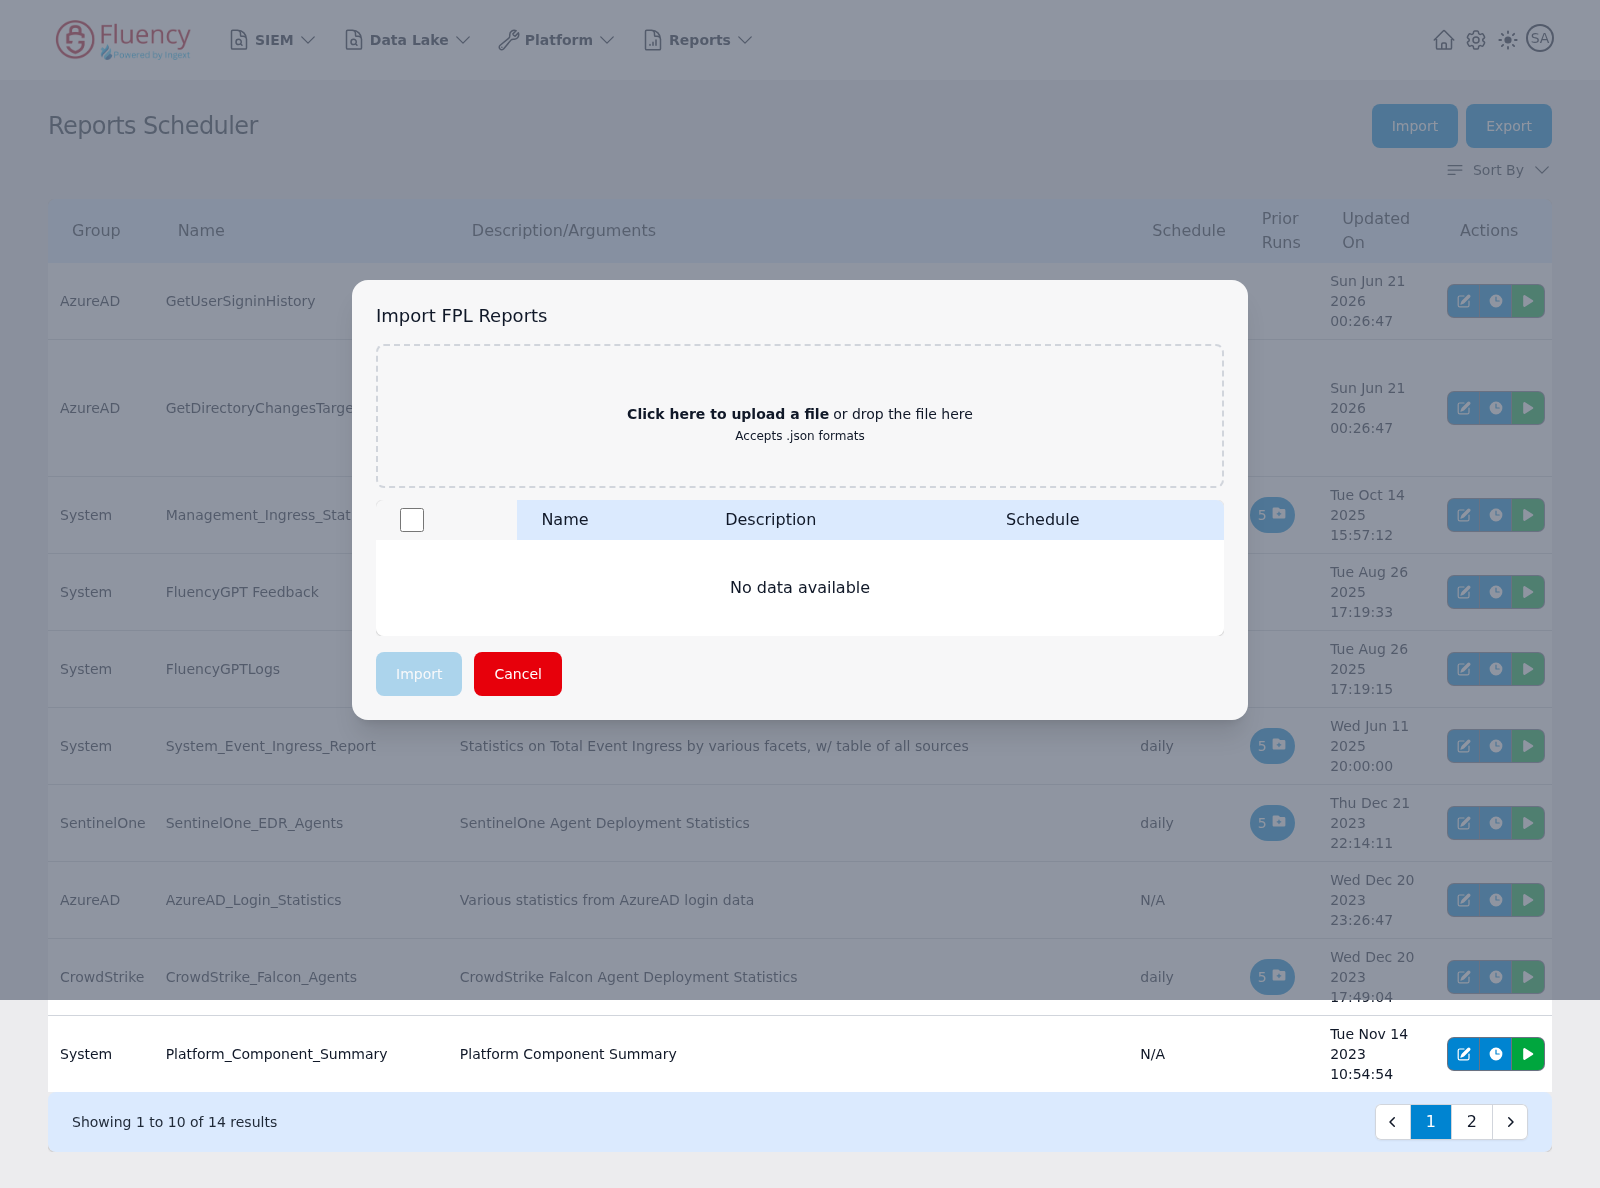
Import opens Import FPL Reports, which loads report definitions from a .json file: an upload area labeled Click here to upload a file (or drop the file on it), a selection table with a checkbox column and Name, Description, and Schedule columns reading No data available until a file is loaded, and Import and Cancel buttons — Import stays disabled until a file is loaded and a row is selected.
This is how reports move between accounts and into source control.
Run History
Prior Runs
The blue count badge in the Prior Runs column expands a run-history sub-table under the row, with ID, Status, Launched On, Time Taken, Cost, and an Actions column whose view (eye) icon opens that run. Click the badge again to collapse the history.
Run Status
completed (green) for a normal finish and aborted (red) for a run that did not. Timeouts, errors in the processor and missing indexes are the usual causes — the same Aborted state that applications show, described in Troubleshooting.
Cost
The Cost column shows what a run was billed. Cost follows bytes scanned, so narrower windows, fewer indexes and earlier filtering are what bring a costly report down. See Platform → Usage.
Related
- Reports — how reporting works end to end
- Creating a Report — arguments and defaults
- Dashboards — what a scheduled run refreshes
- Page Functionality → Scheduler — the page, control by control
- Platform → Usage — ingress and search volume
- Alerts & Actions — notification endpoints used for delivery