Reports
The Reports page holds two kinds of report. Dashboard reports are the site's built-in system reports (event ingress, ticket analysis, and usage), each opening as an interactive dashboard over a time range you choose. FPL reports are report processors written in FPL, the platform's processing language, which you can open, run, and save in an editor on this page.
Menu path: Reports · URL path: /v2/reports (Dashboard; /v2/reports?kind=dashboard opens it too) · /v2/reports?kind=fpl (FPL reports)
Task guide: Creating a Report: writing, running, and saving an FPL report.
Page Layout
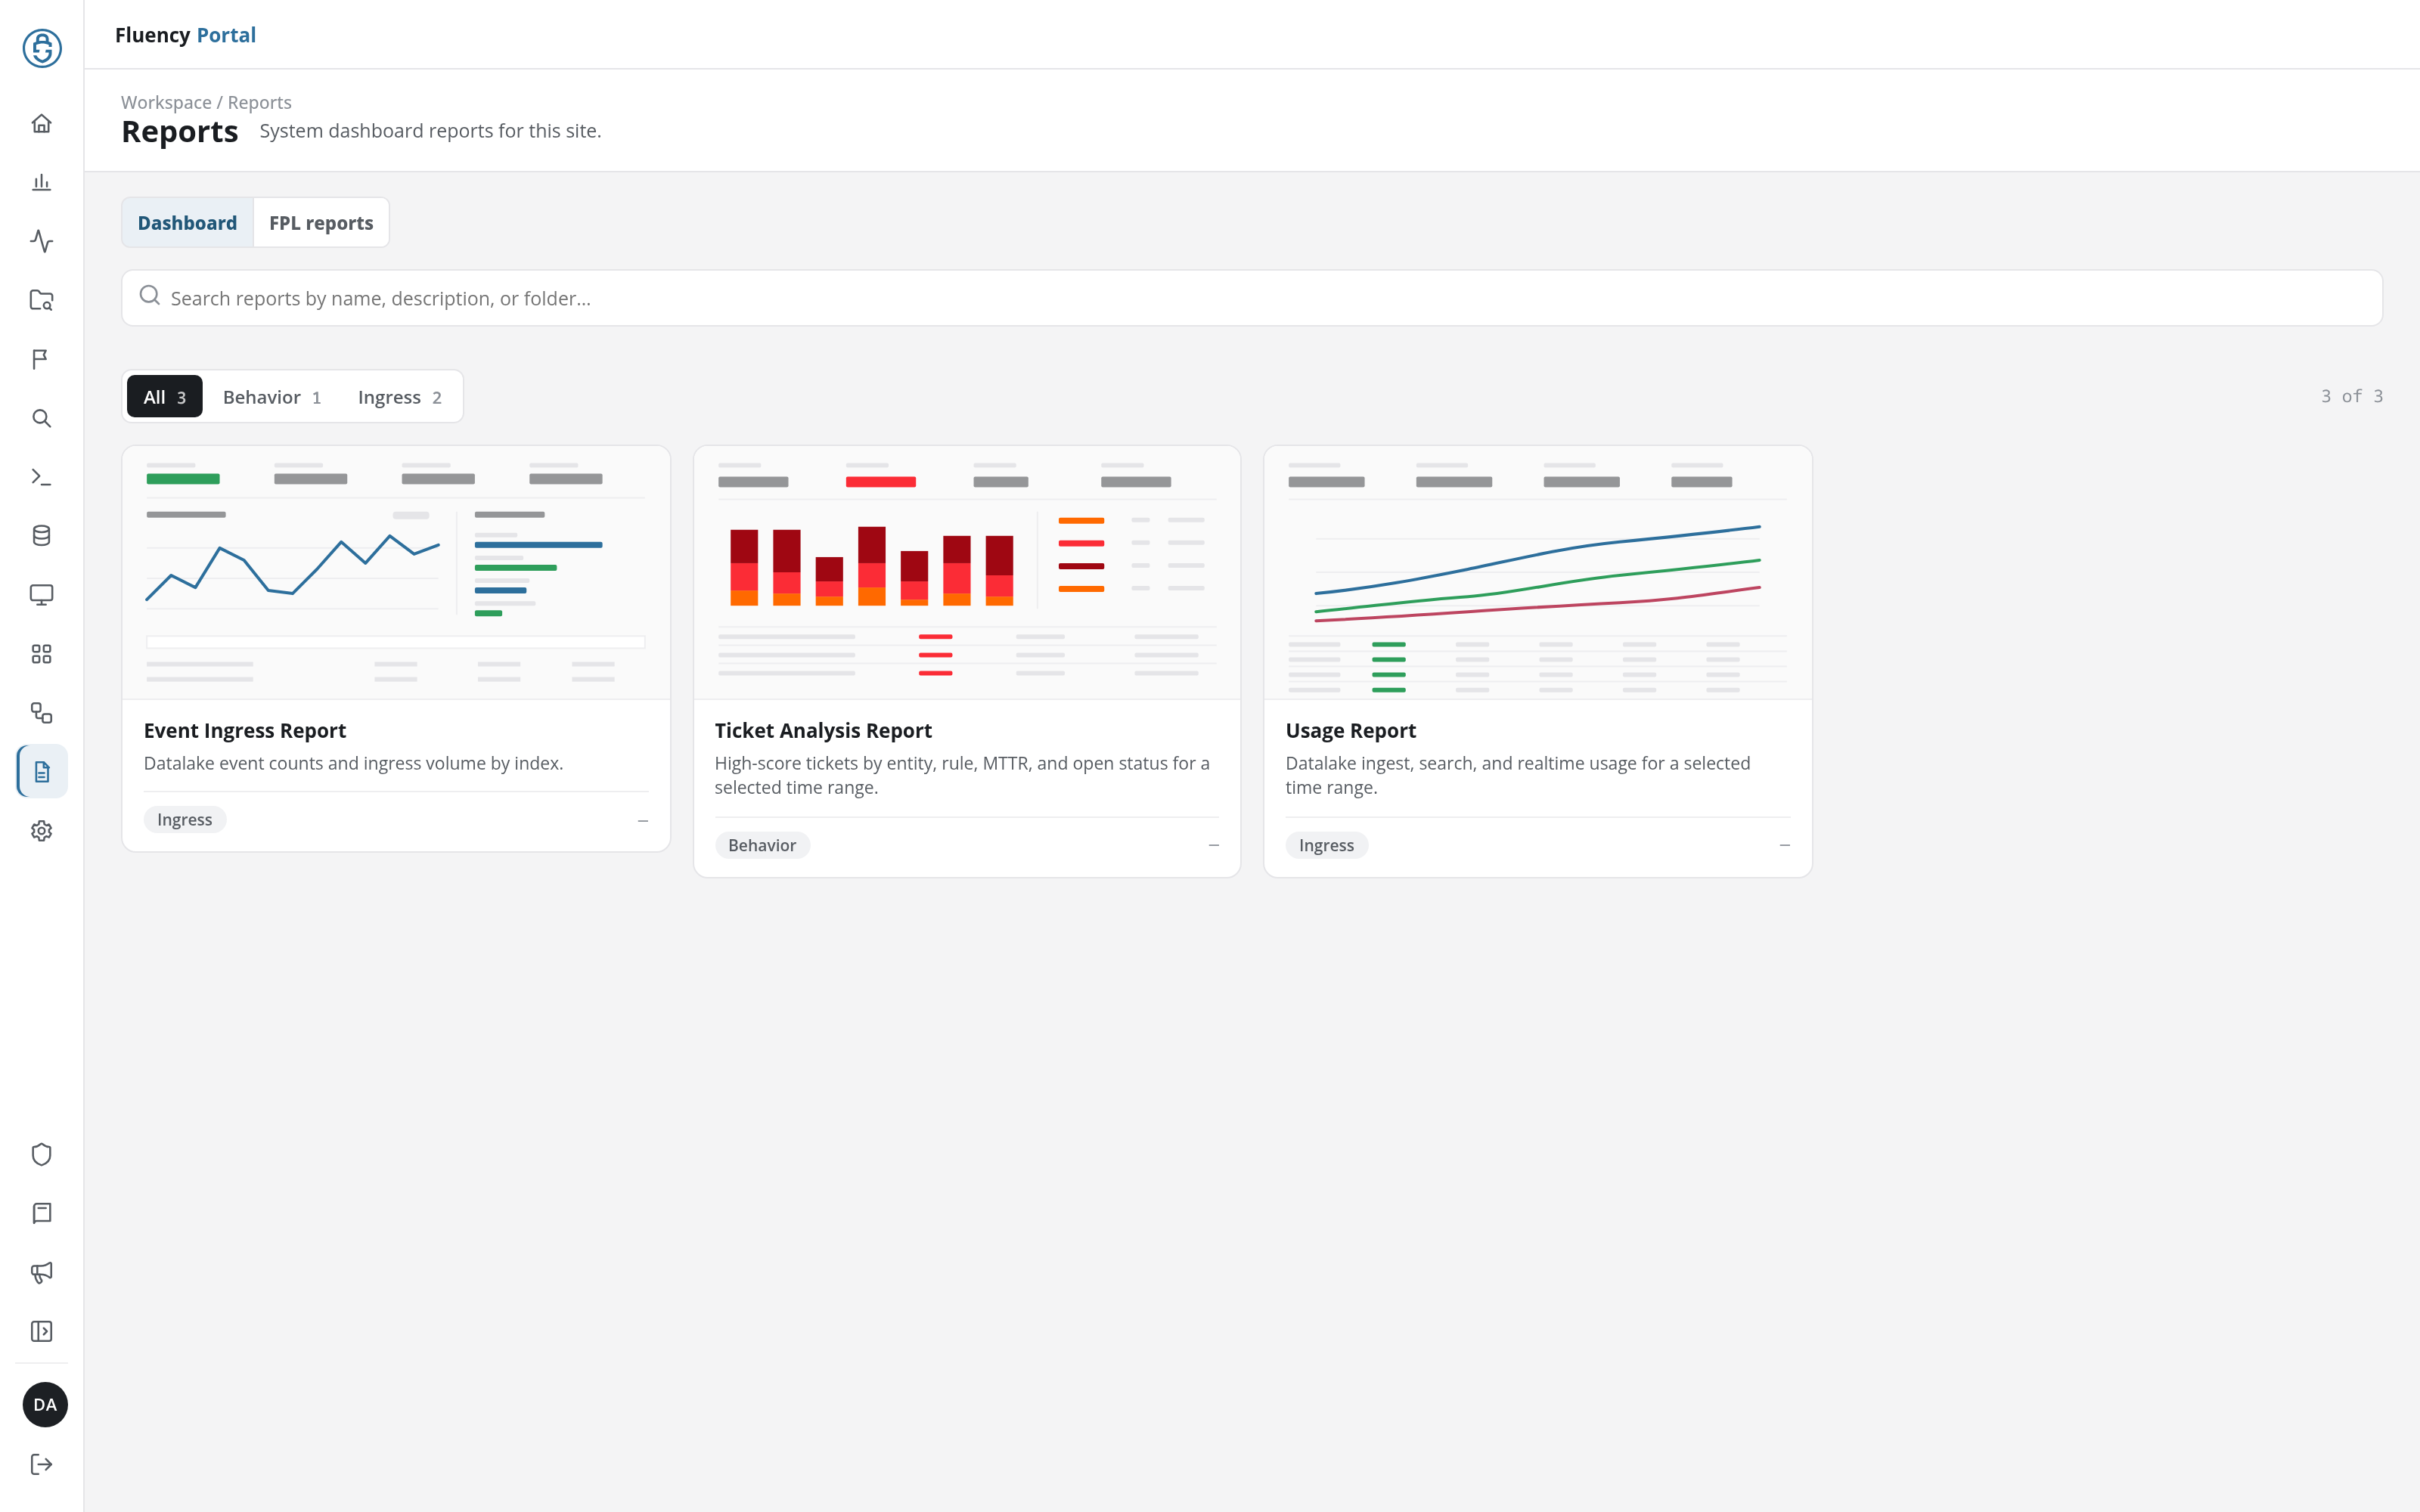
The header shows the breadcrumb Workspace / Reports and the title Reports, with a subtitle naming the current tab. Below it:
- Tabs: Dashboard (the default) and FPL reports.
- Search field: across the full width: Search reports by name, description, or folder… on the Dashboard tab, and Search reports by name, description, folder, or FPL script… on the FPL reports tab.
- Filter bar: filter buttons, each with a count of the reports it holds, and, on the right, how many reports are shown out of the total (for example 3 of 3).
- Report list: cards on the Dashboard tab, a table on the FPL reports tab.
Dashboard
The Dashboard tab (System dashboard reports for this site.) shows one card per report. Each card has a preview of the report's layout, its name and description, and a tag for its kind. The filter buttons (All, Behavior, and Ingress) narrow the cards to one kind, and the search field narrows them by name, description, or folder.
| Report | Tag | What it covers |
|---|---|---|
| Event Ingress Report | Ingress | Datalake event counts and ingress volume by index. |
| Ticket Analysis Report | Behavior | High-score tickets by entity, rule, MTTR, and open status for a selected time range. |
| Usage Report | Ingress | Datalake ingest, search, and realtime usage for a selected time range. |
Click a card to open its report. Every report page has a Back to Reports link above its title, a row of time-range buttons in the upper left, and a Download report button in the upper right. Download report saves the report as it is shown, as a self-contained HTML page named after the report and the day it is saved (for example event-ingress-report-<YYYY-MM-DD>.html): its title, the range (in UTC), the time it was generated, and the figures, charts, and tables.
Event Ingress Report
URL path: /v2/reports?kind=dashboard&name=ingress&range=7d
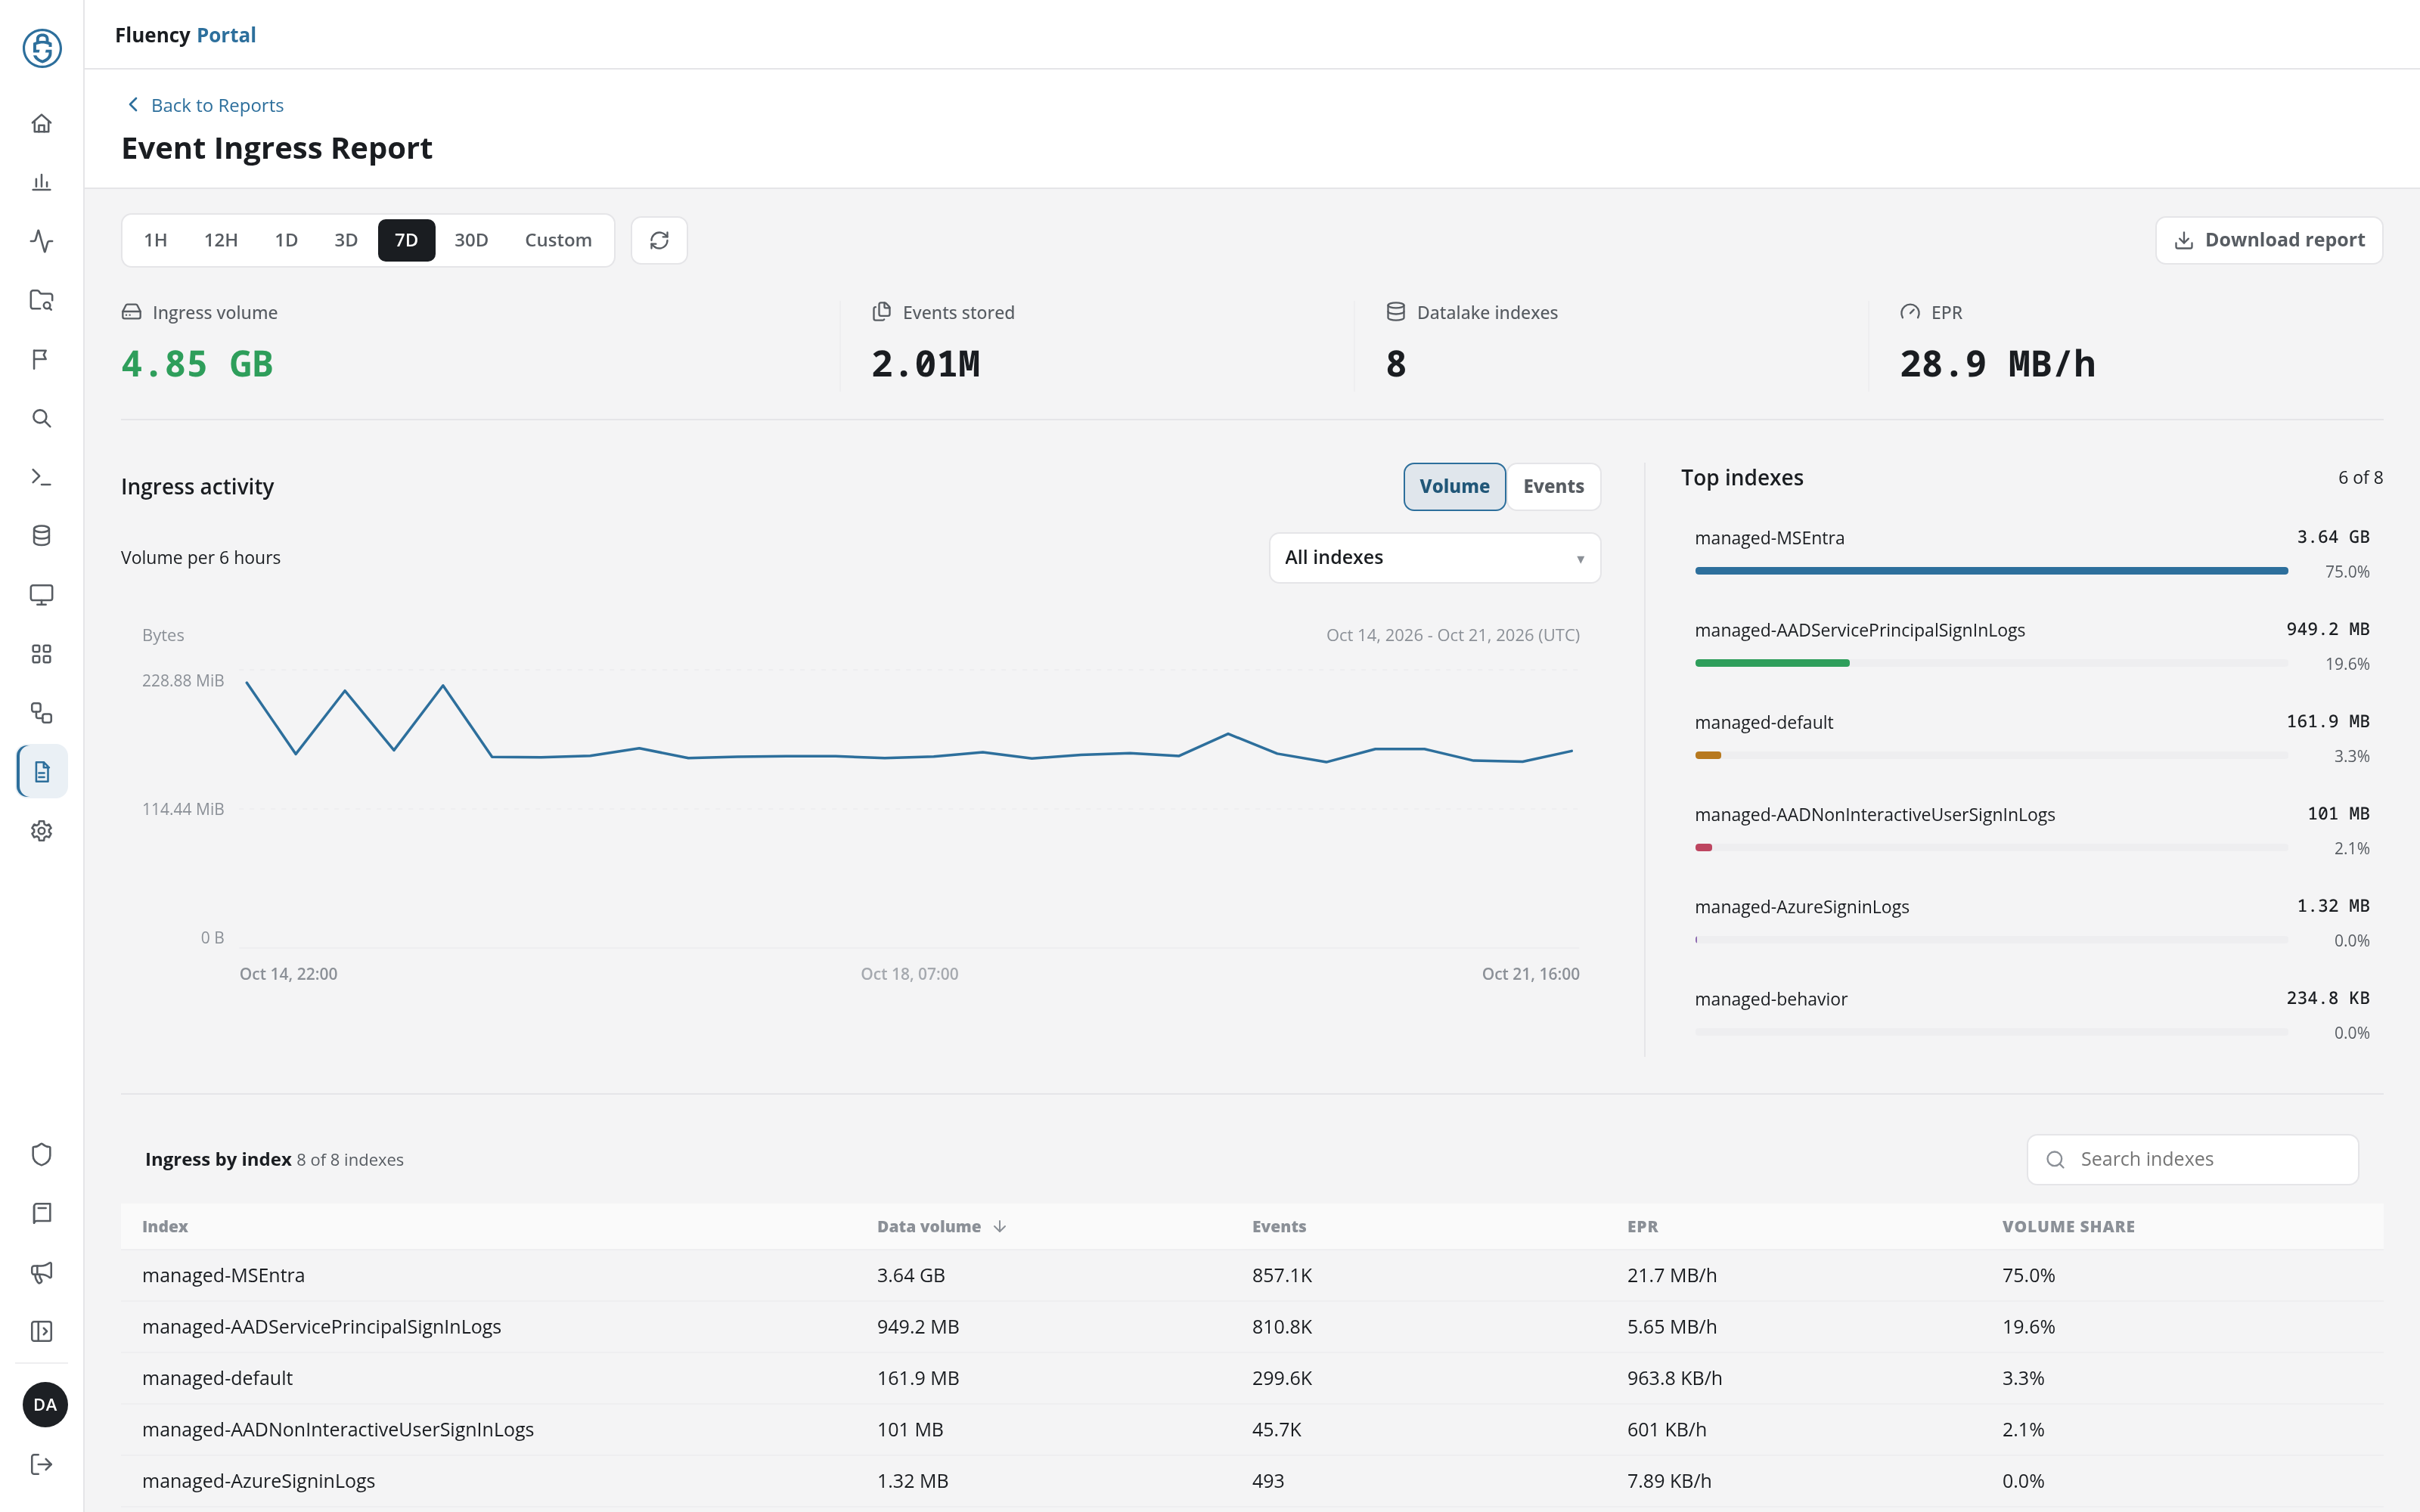
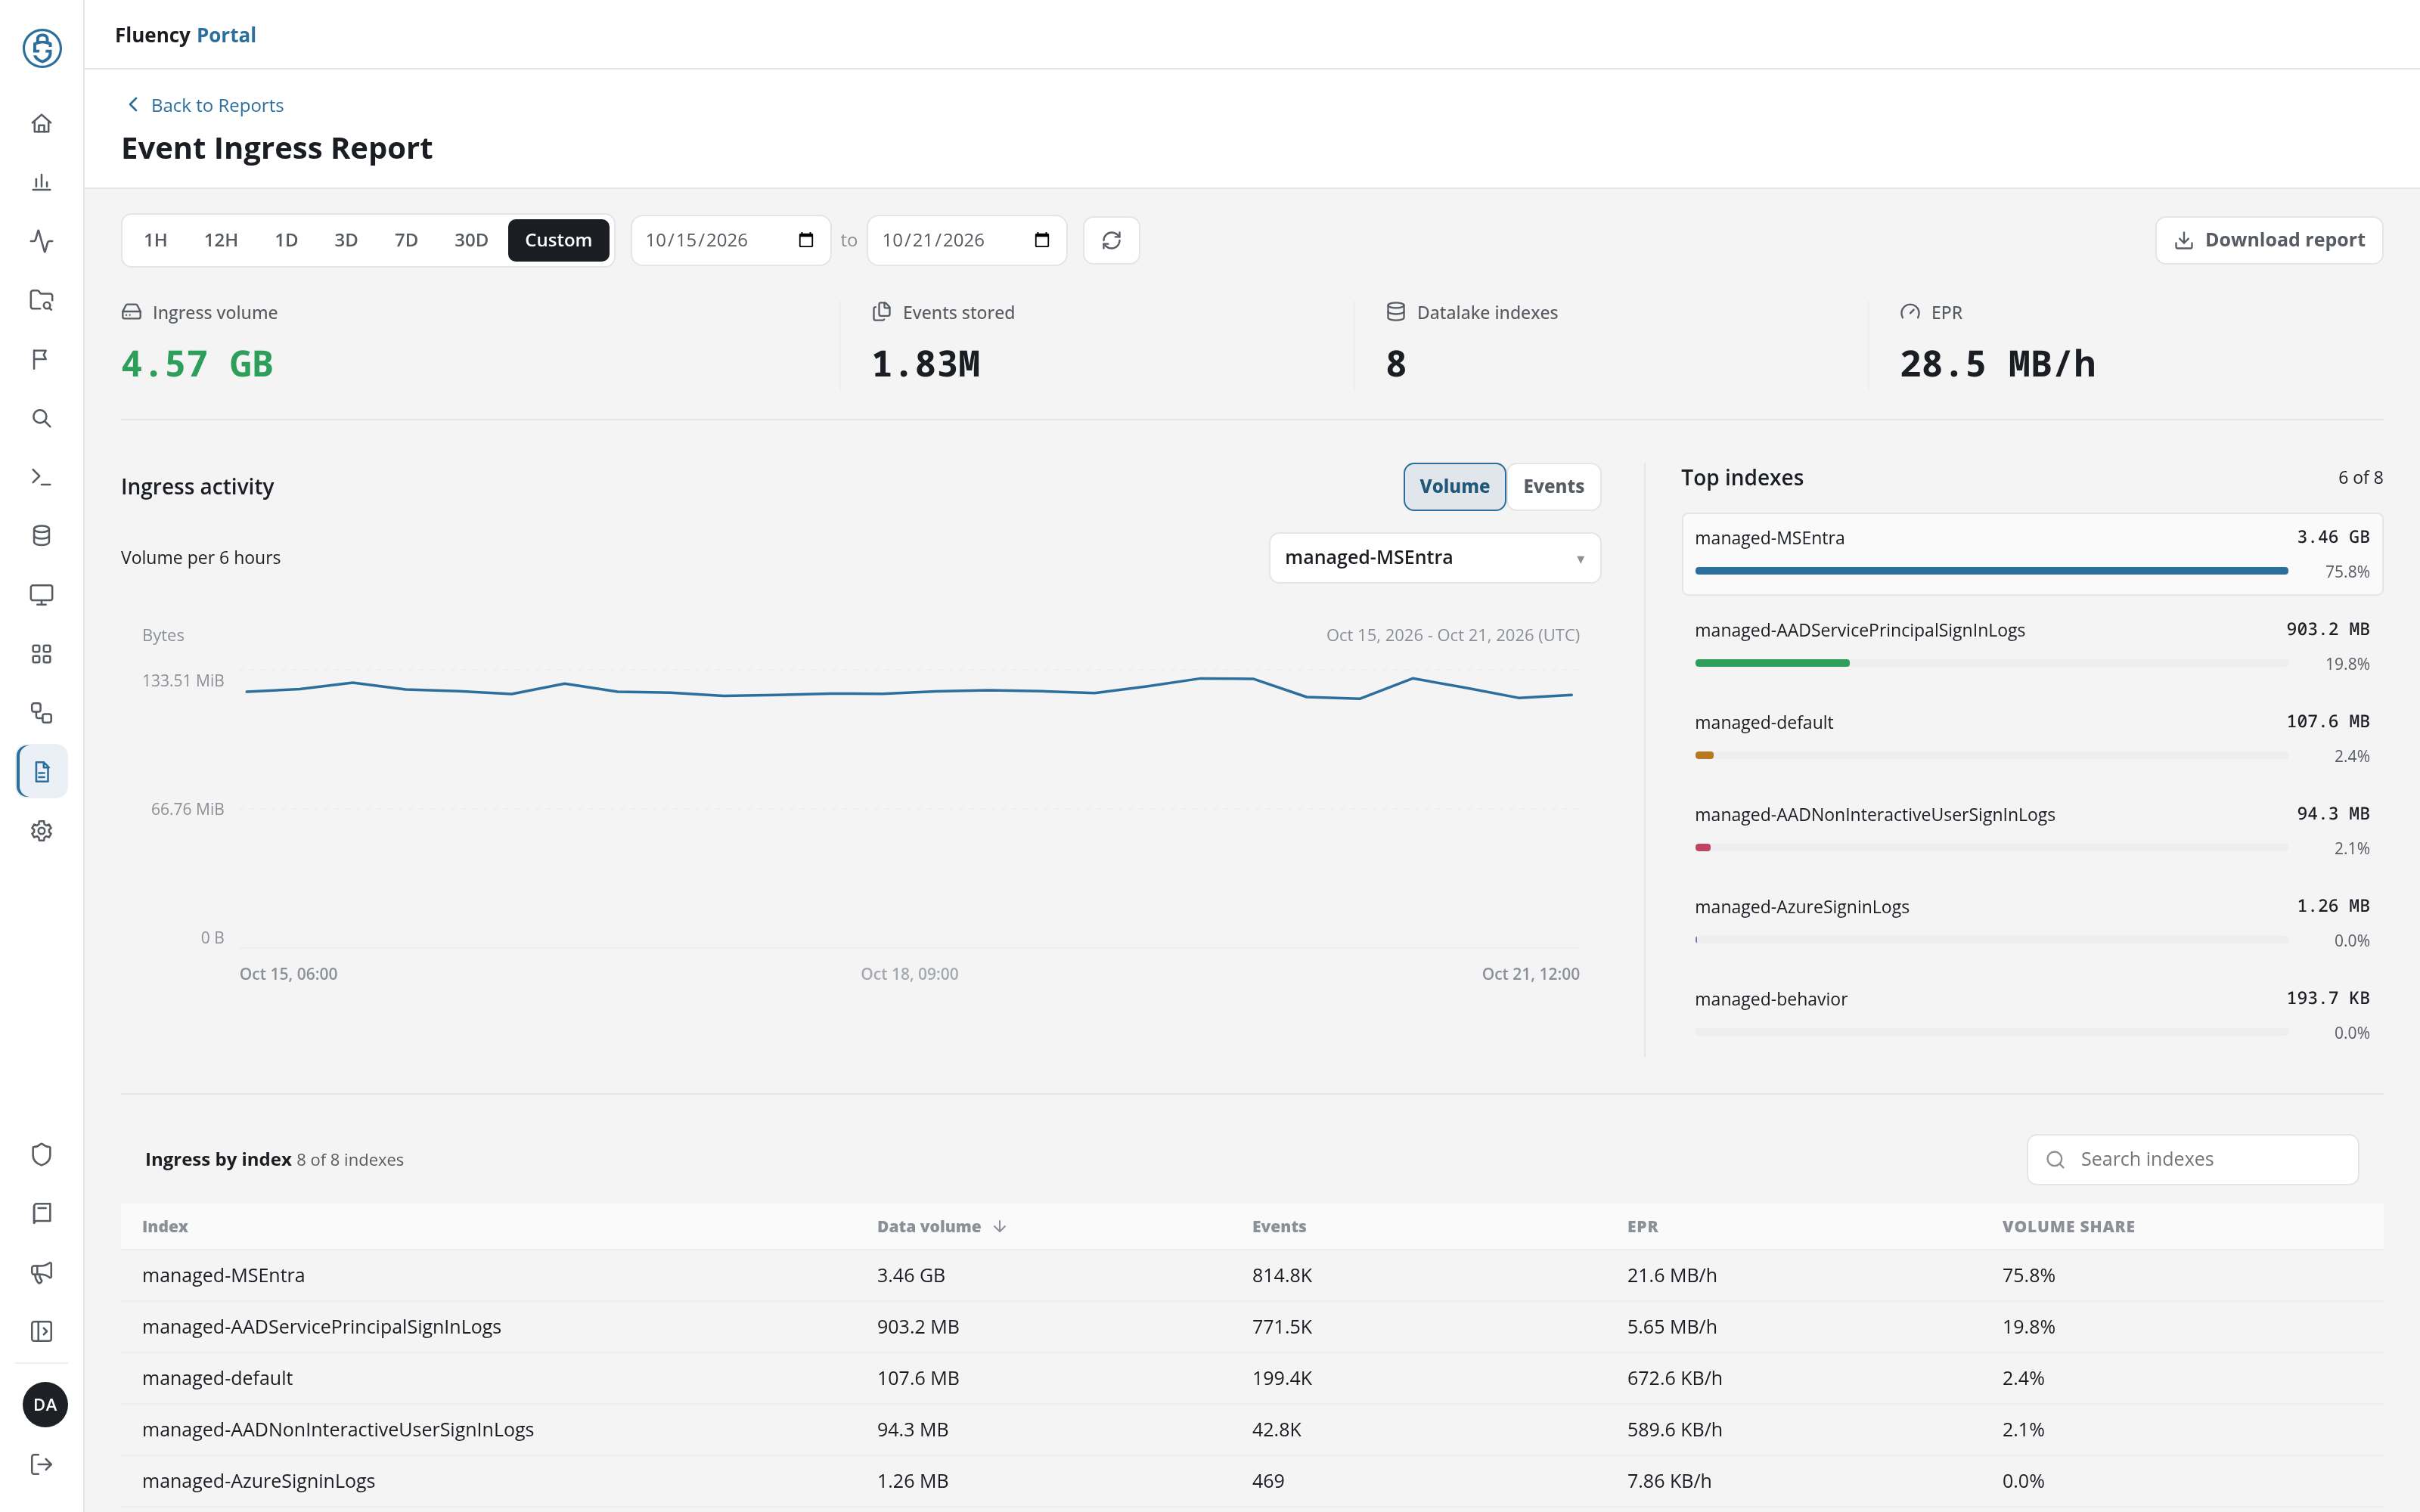
- Time range: 1H, 12H, 1D, 3D, 7D (the default), 30D, and Custom. The range is part of the URL (
range=1h,range=12h, …). Custom adds two date fields, Start date (UTC) and End date (UTC), joined by to, for the first and last day, written to the URL asrange=custom&from=<YYYY-MM-DD>&to=<YYYY-MM-DD>; changing a date reloads the report at once. The circular-arrow button beside the range (Refresh ingress report) reloads the report. - Headline figures: Ingress volume, Events stored, Datalake indexes (the number of indexes in the report), and EPR, the ingress rate per hour.
- Ingress activity: a line chart of ingress over the range, bucketed as the label above it says (for example Volume per 6 hours), with the range's dates in UTC. Volume and Events switch what it plots, and the index drop-down (All indexes by default) limits it to one index.
- Top indexes: the busiest indexes (for example 6 of 8), each with its volume, a bar, and its share of the total. Click an index to chart it alone: the chart's drop-down switches to that index and the entry is outlined.
- Ingress by index: every index (8 of 8 indexes) with its Data volume, Events, EPR, and Volume share. The table is sorted by Data volume; the Index, Data volume, and Events headers re-sort it, and Search indexes narrows it.
Ticket Analysis Report
URL path: /v2/reports?kind=dashboard&name=tickets&range=7d
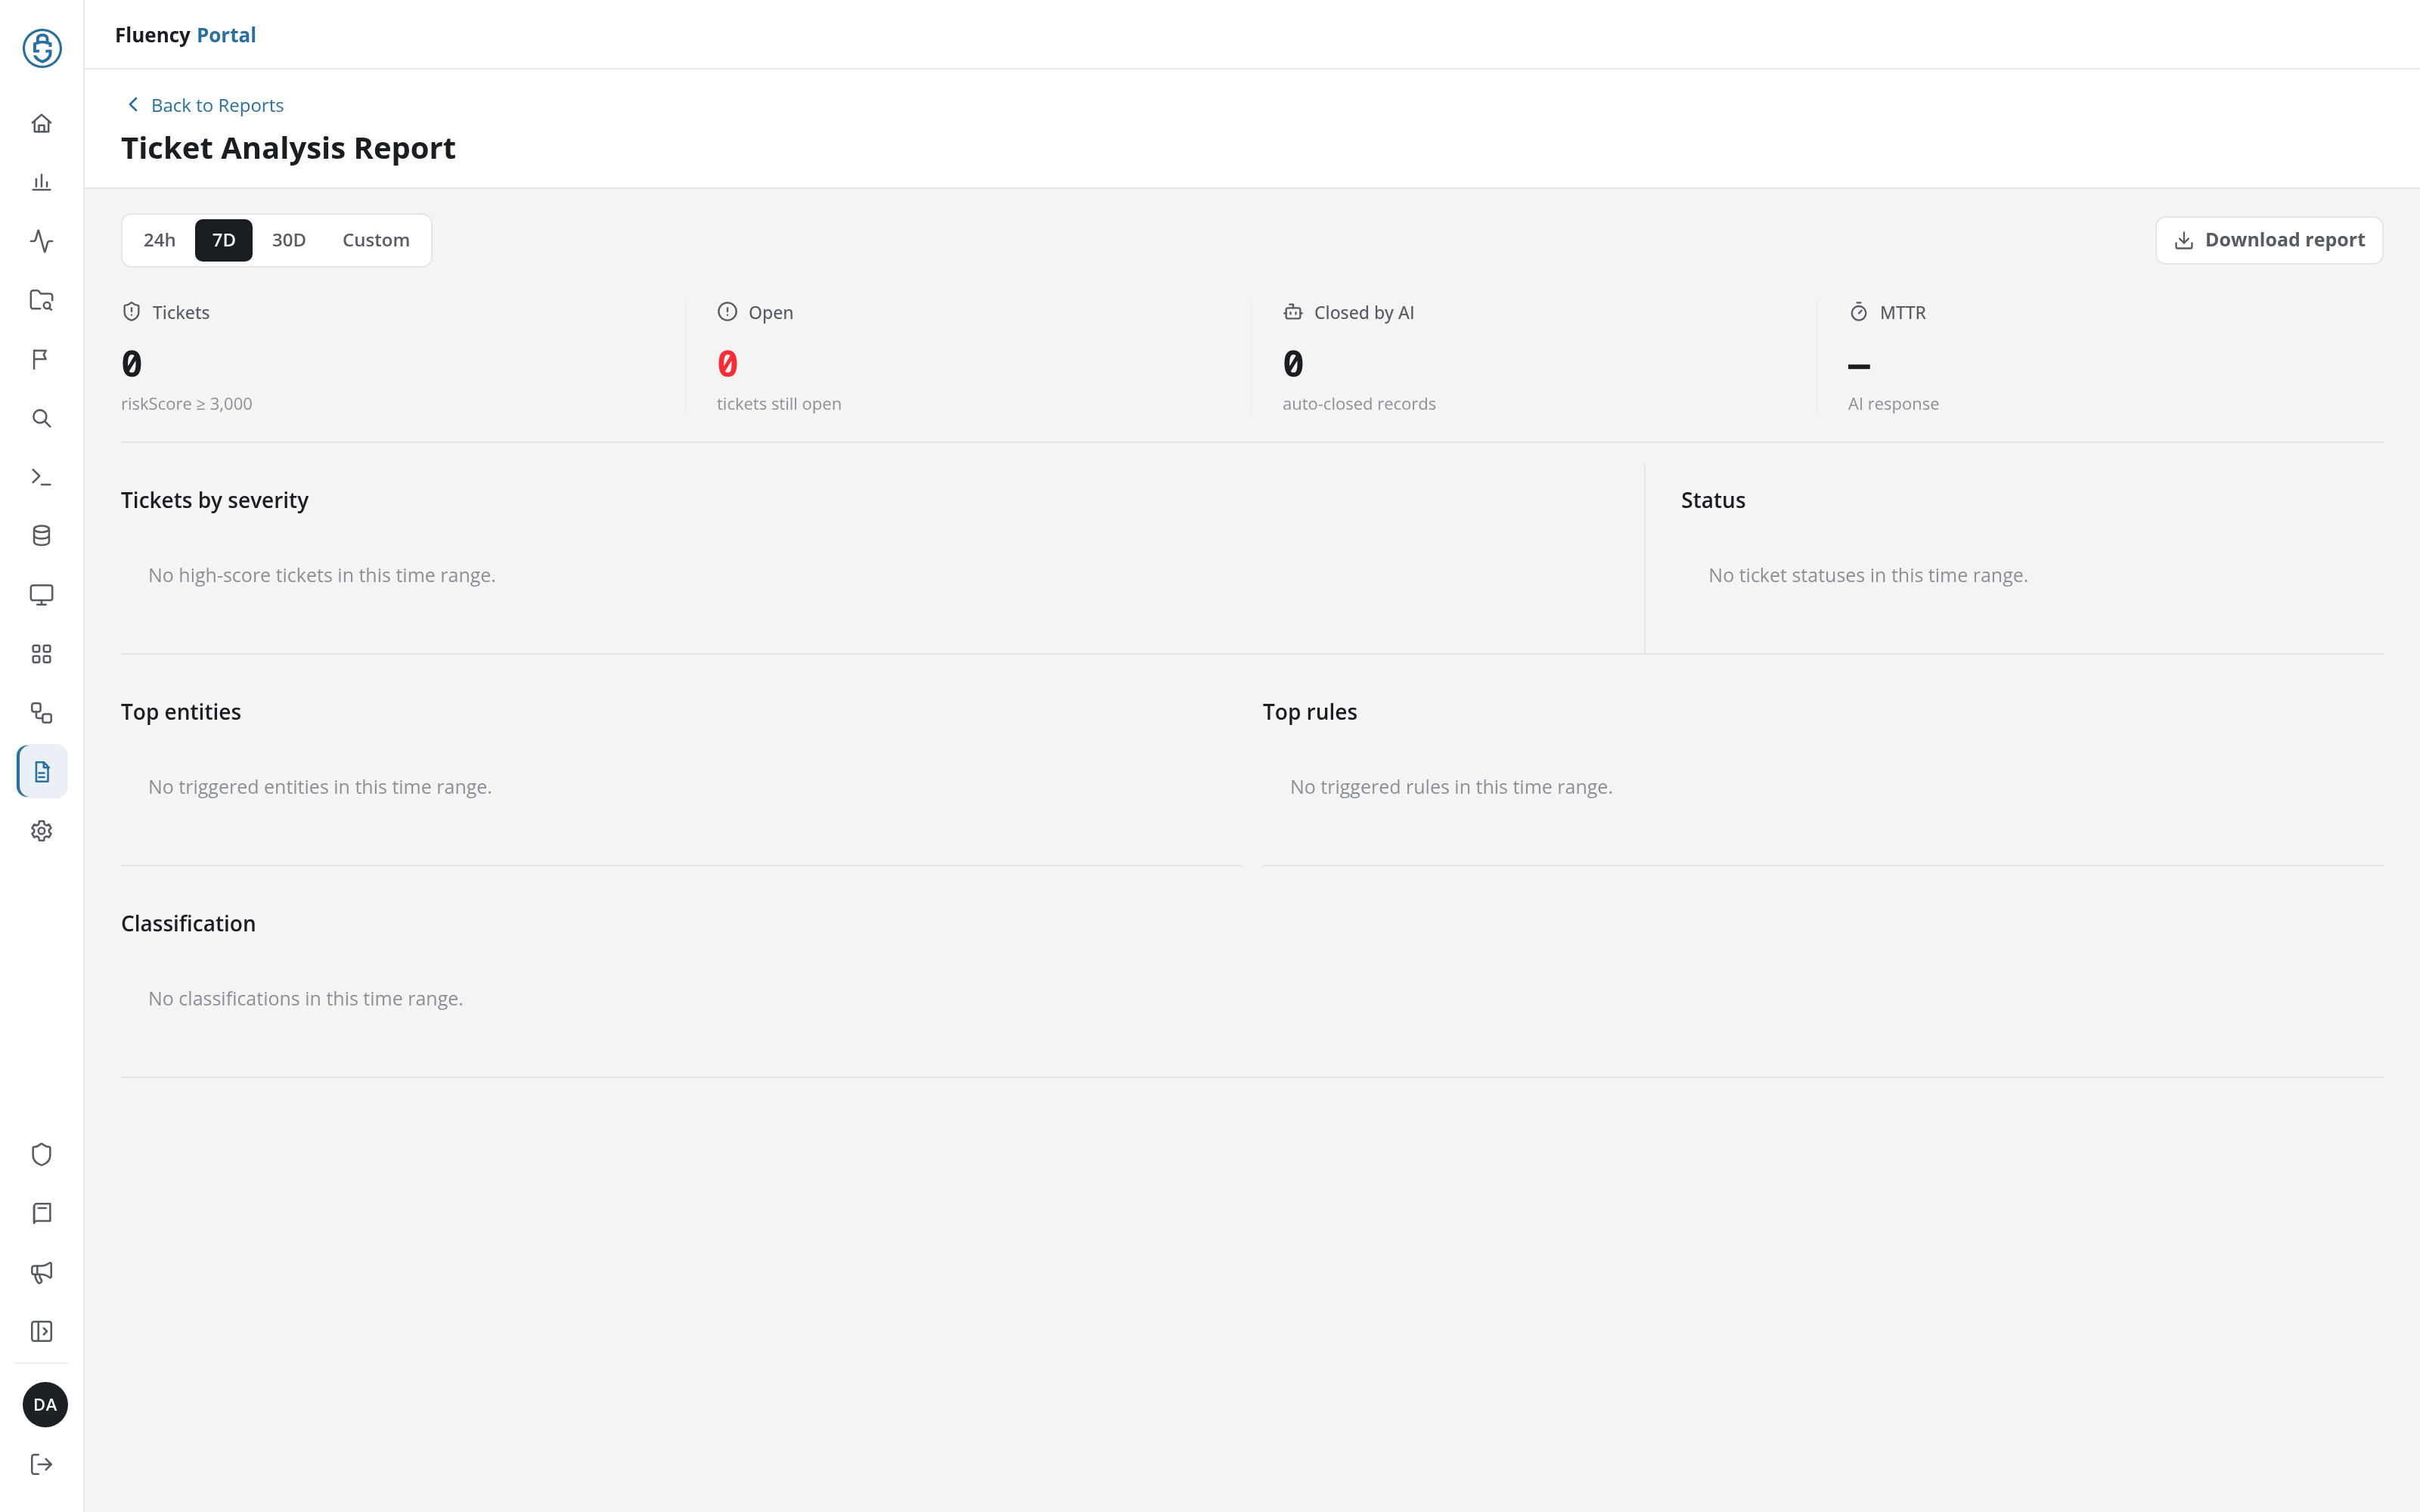
- Time range: 24h, 7D (the default), 30D, and Custom. The range is part of the URL (
range=24h,range=7d,range=30d); Custom adds Start date (UTC) and End date (UTC) fields and is written asrange=custom&from=<date>&to=<date>. - Headline figures: Tickets (tickets with a
riskScoreof at least 3,000), Open (tickets still open), Closed by AI (auto-closed records), and MTTR (the time to an AI response). - Panels: Tickets by severity, a bar chart of the range's tickets coloured by severity; Status, Top entities, and Top rules, tables of the tickets per status, entity, and rule, each with its Share of the total (click a column header to re-sort the table); and Classification. A panel with nothing in the range says so, for example No high-score tickets in this time range.
- Open tickets: when the range holds open tickets, a panel between Status and Top entities lists them, with the columns Entity (the entity, with the rule that raised the ticket beneath it), Severity (a badge such as CRITICAL), Score, Status (such as New), and Detected (the date). Each entity is a link to its Behavior Summary page for the ticket's day (
/v2/behavior-summary?id=%22<entity>%22&dayIndex=<YYYYMMDD>). The entities in Top entities link to Behavior Summary too, by entity alone (/v2/behavior-summary?id=%22<entity>%22).
Usage Report
URL path: /v2/reports?kind=dashboard&name=usage&from=<date>&to=<date>
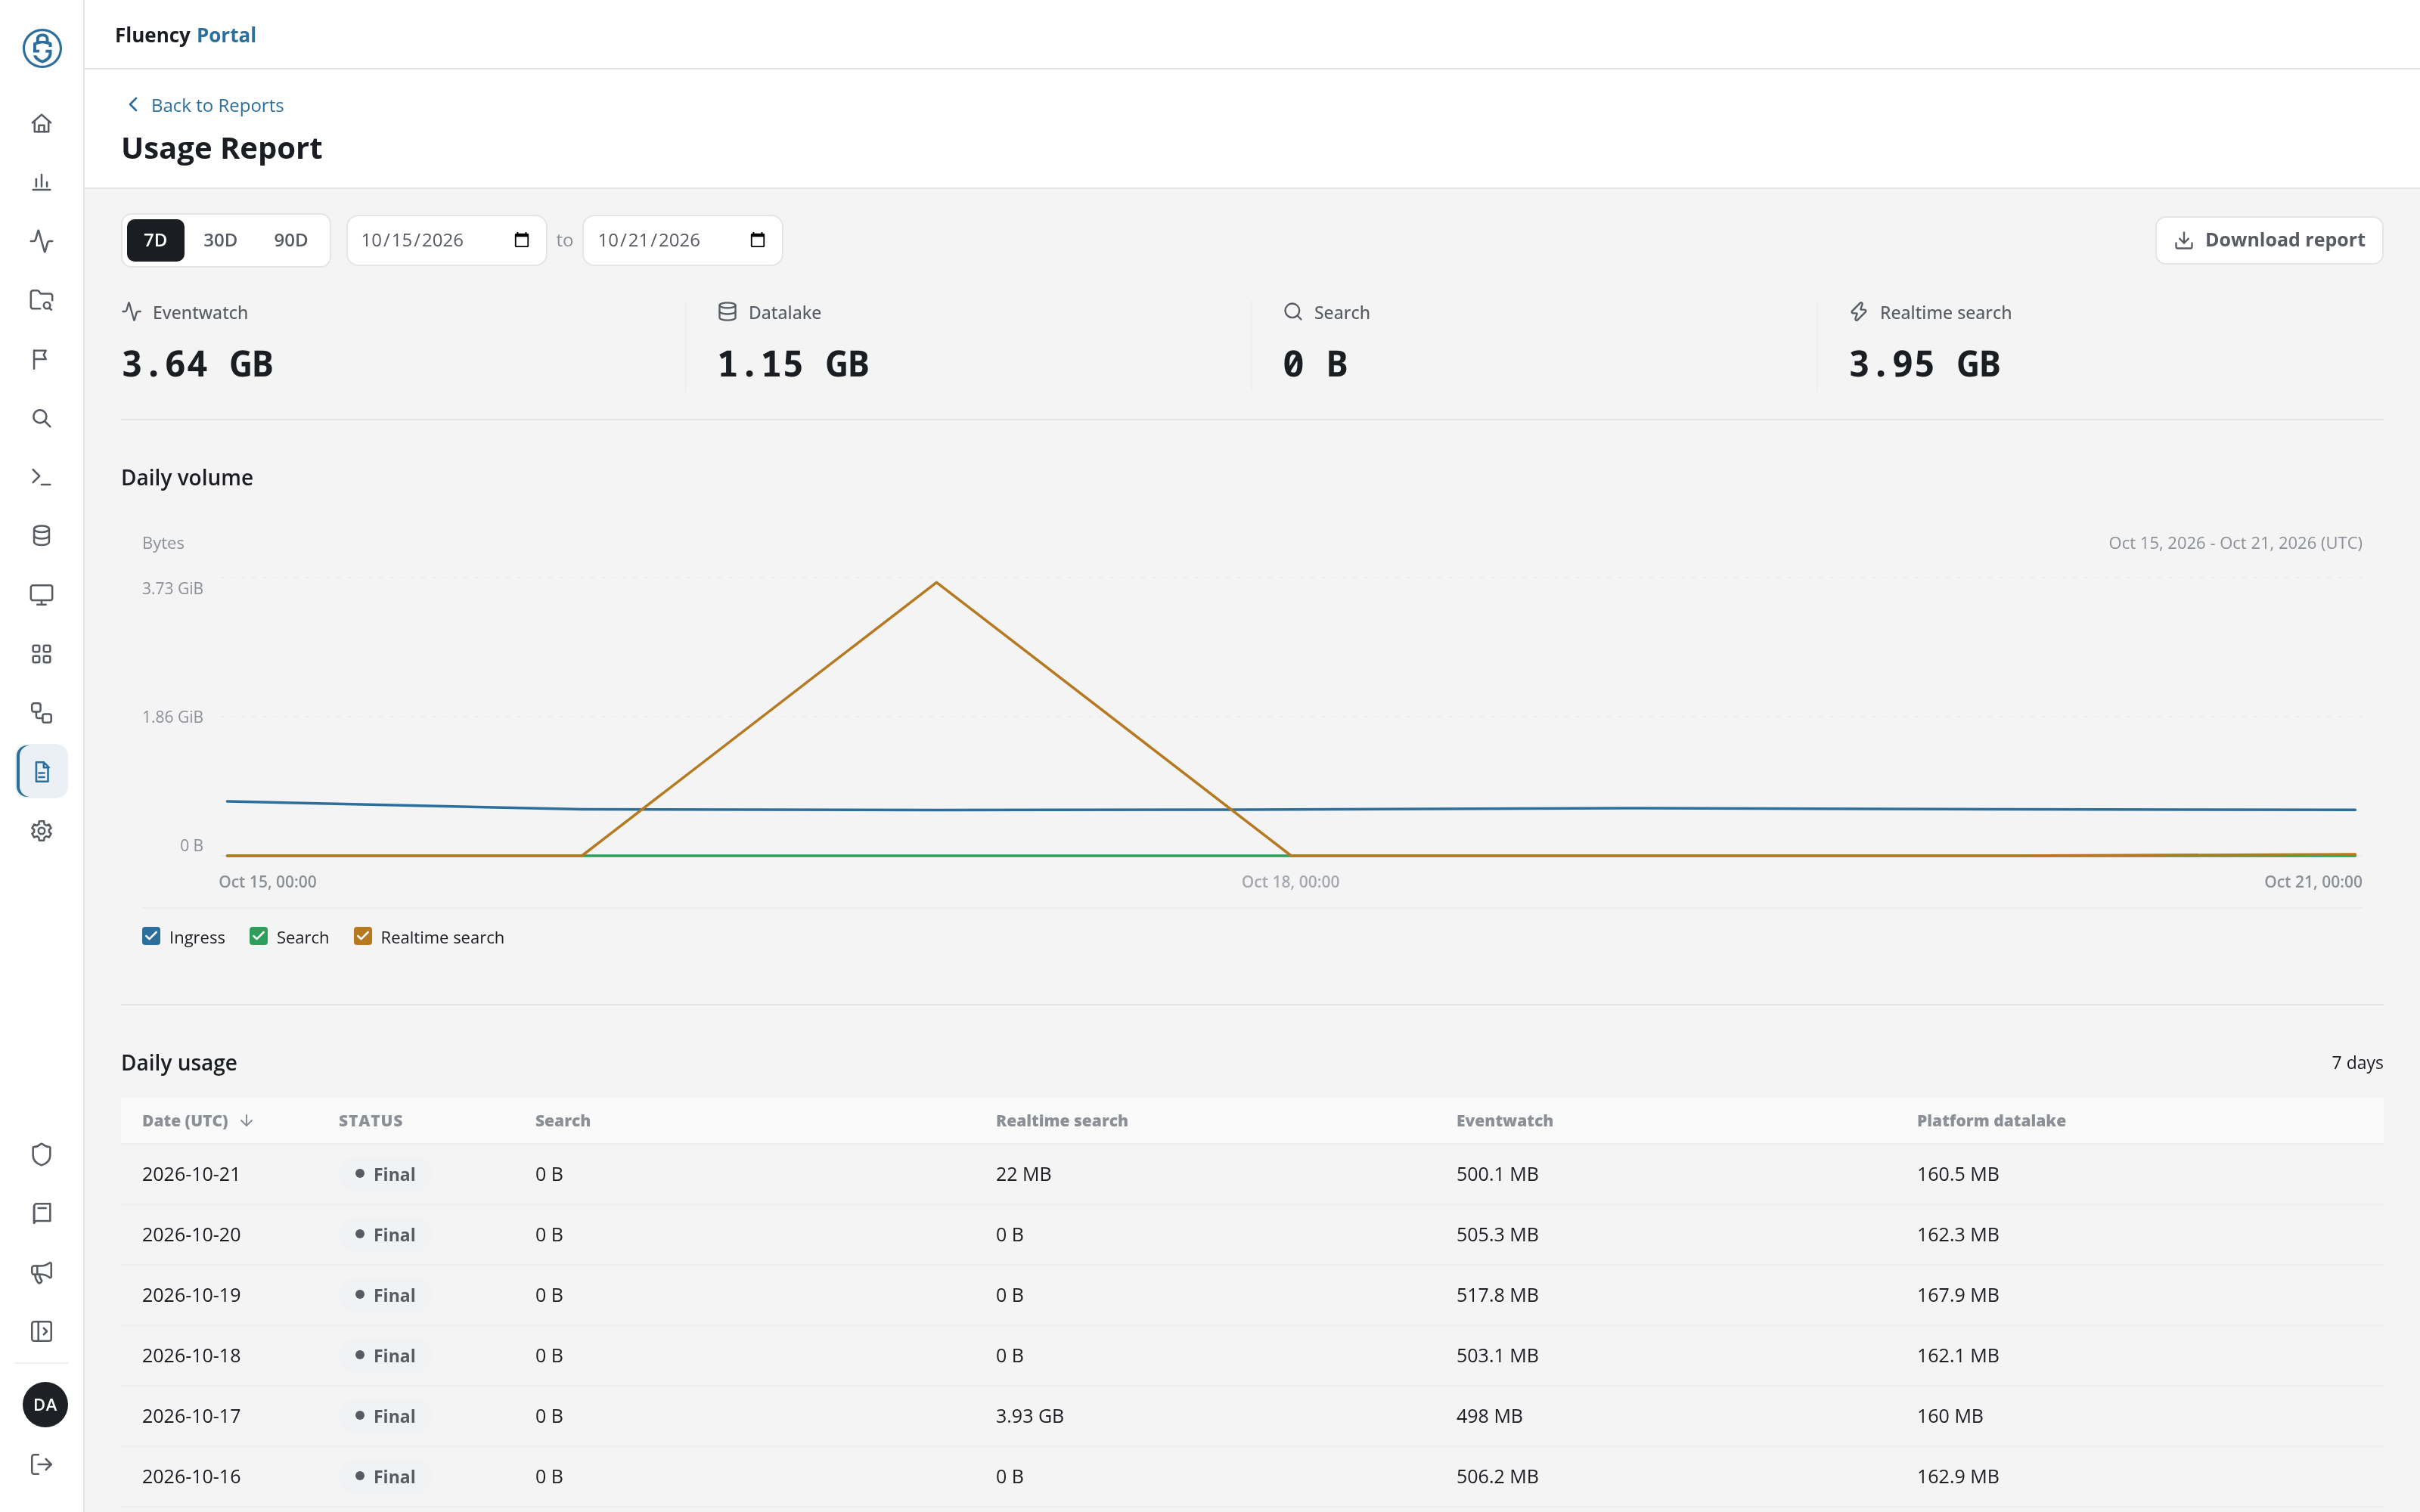
- Time range: 7D (the default), 30D, and 90D, followed by two date fields, Start date (UTC) and End date (UTC), showing the range's first and last day. The URL carries the two dates (
from=2026-10-23&to=2026-10-29); the range buttons rewrite them. - Headline figures: the range's total for Eventwatch, Datalake, Search, and Realtime search. Beneath each, Missing data: counts the days in the range without figures (for example 1 of 7 days).
- Daily volume: a line chart of each day's volume, in UTC. The checkboxes beneath it (Ingress, Search, and Realtime search) show or hide each line.
- Daily usage: one row per day, newest first, with the columns Date (UTC), Status, Search, Realtime search, Eventwatch, and Platform datalake. Status is Final for a day whose figures are complete, Open for the current day, and Missing for a day without figures, whose values read Unavailable.
FPL Reports
The FPL reports tab (FPL report processors for this site.) lists the account's report processors and adds an + Add Report button to the header.
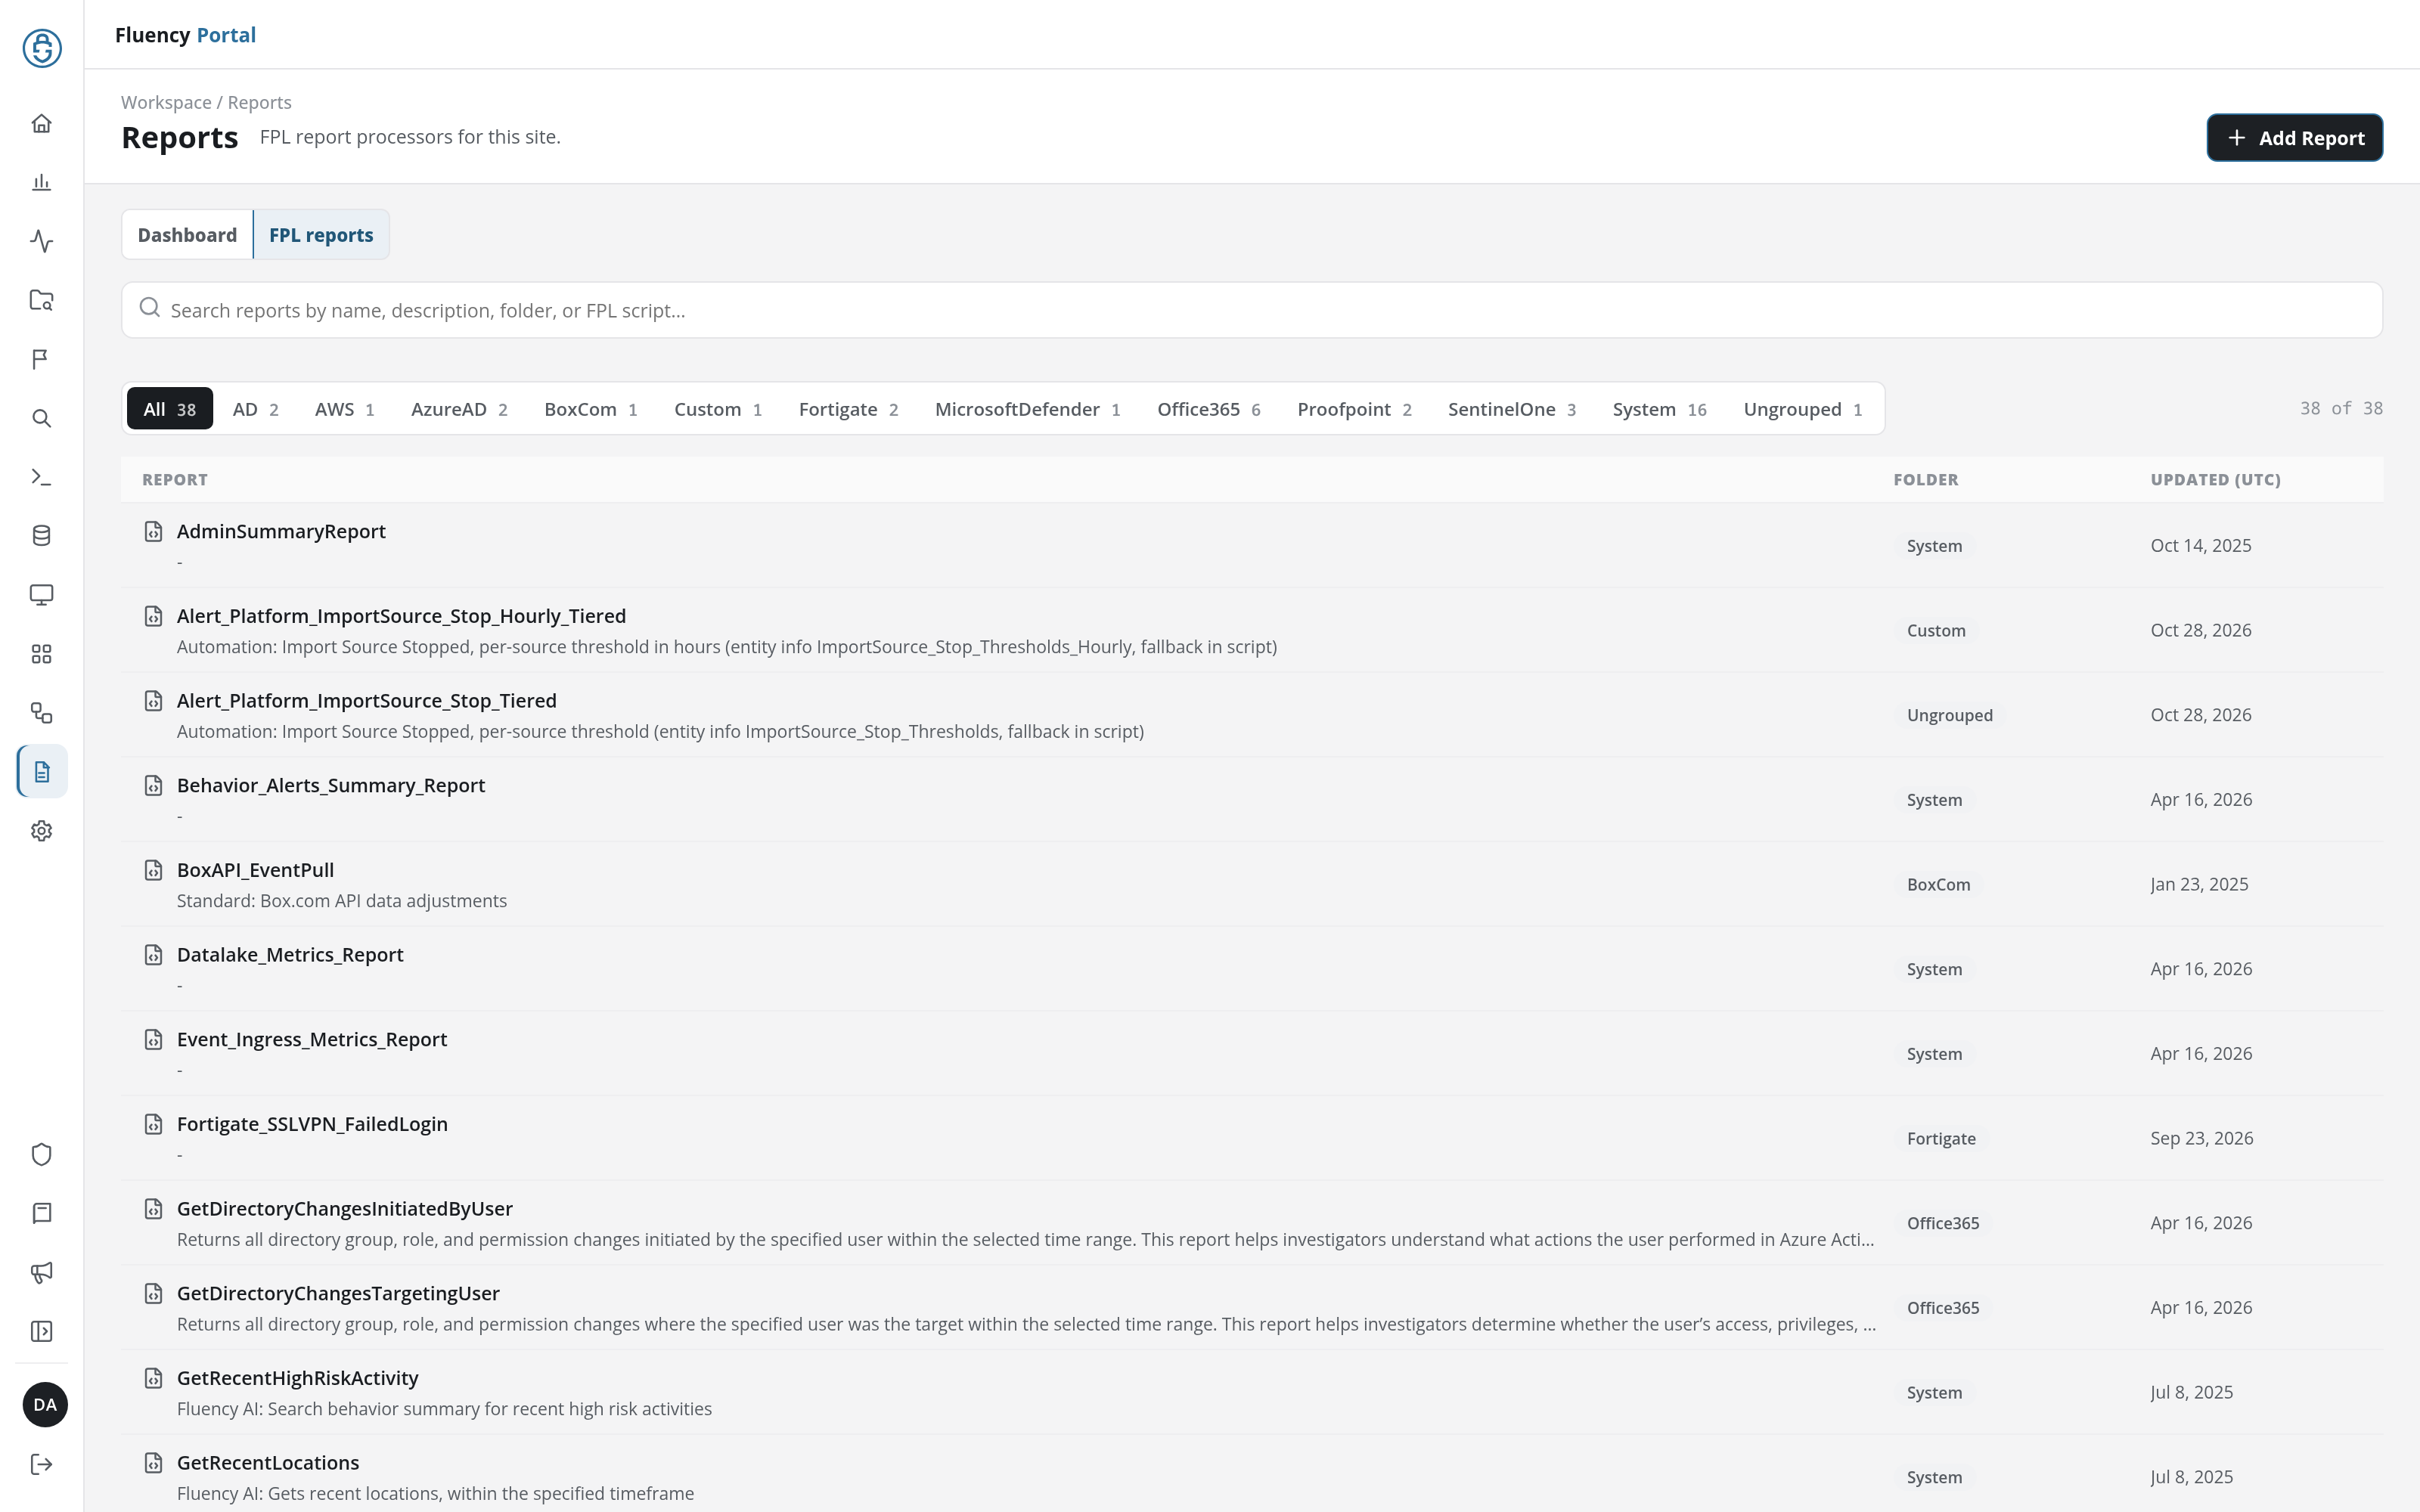
- Folder filters: All and one button per folder, each with its report count (for example AD, BoxCom, Office365, SentinelOne, and System).
- Search field: narrows the table by name, description, folder, or the text of the report's FPL script.
- Report table: Report (the processor's name, with its description beneath it, or - when it has none), Folder (Ungrouped for a report in no folder), and Updated (UTC). Click a row to open the report in the editor. When nothing matches the search or folder, the table reads No reports match this filter.
Report Editor
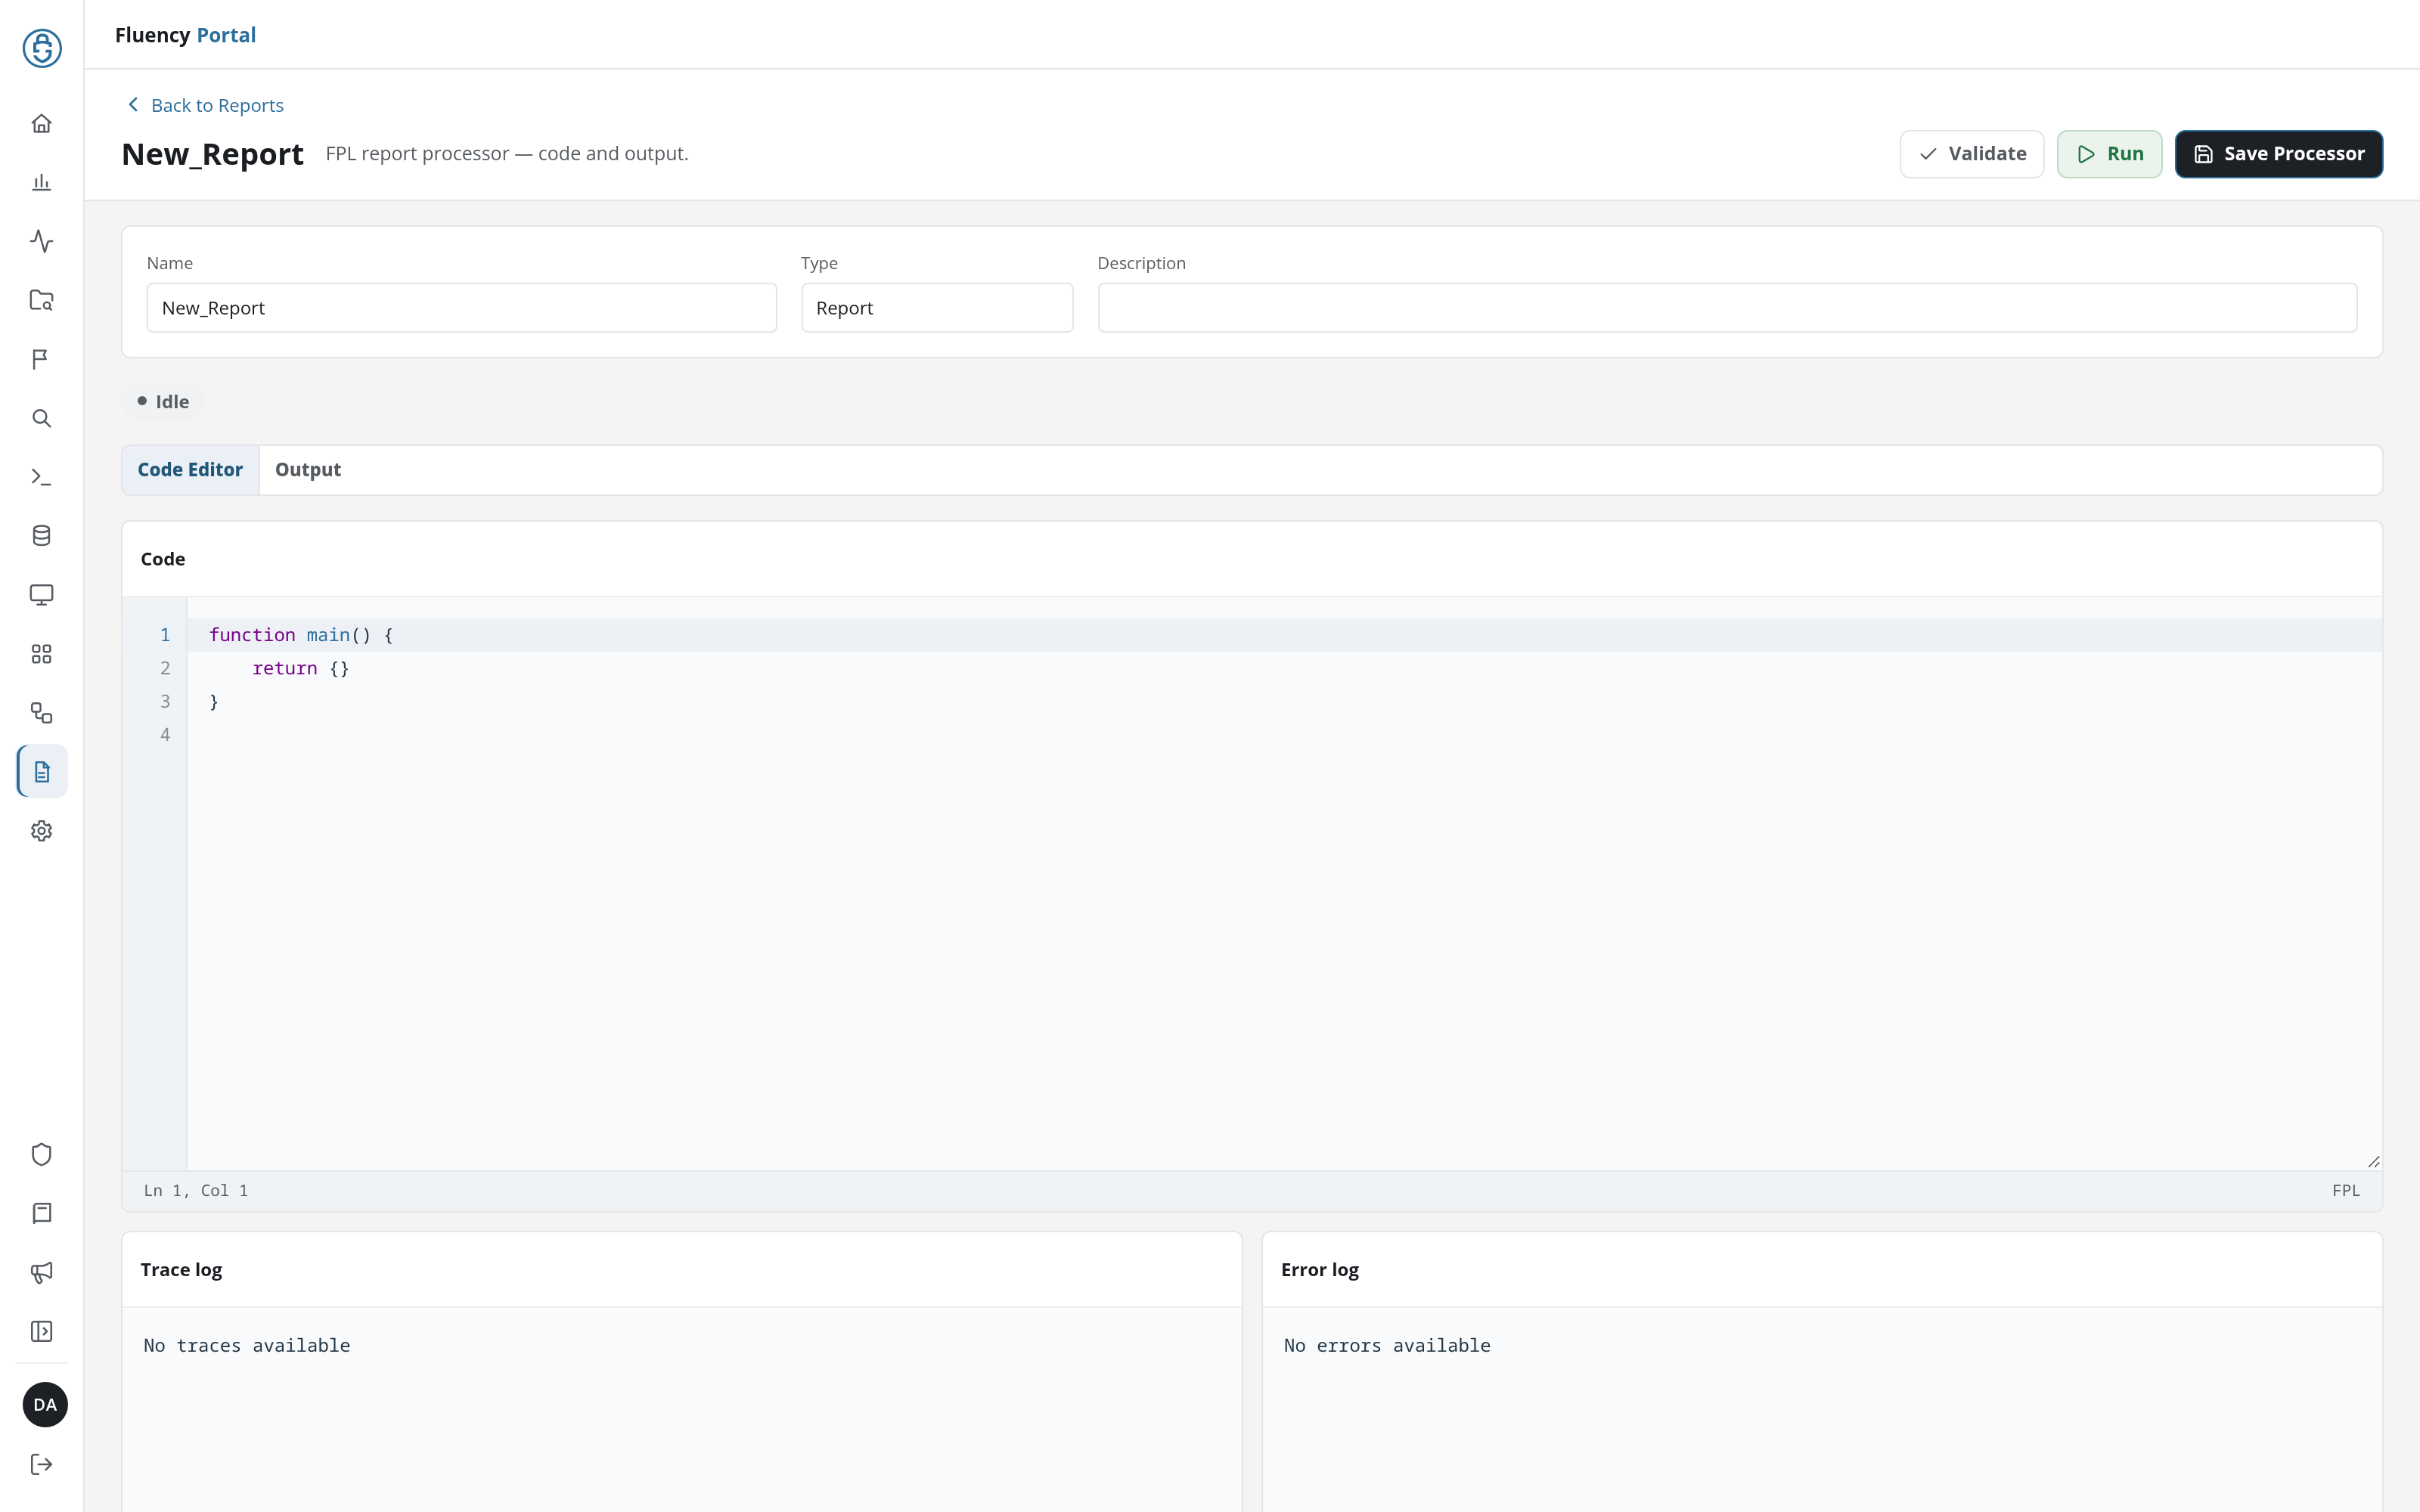
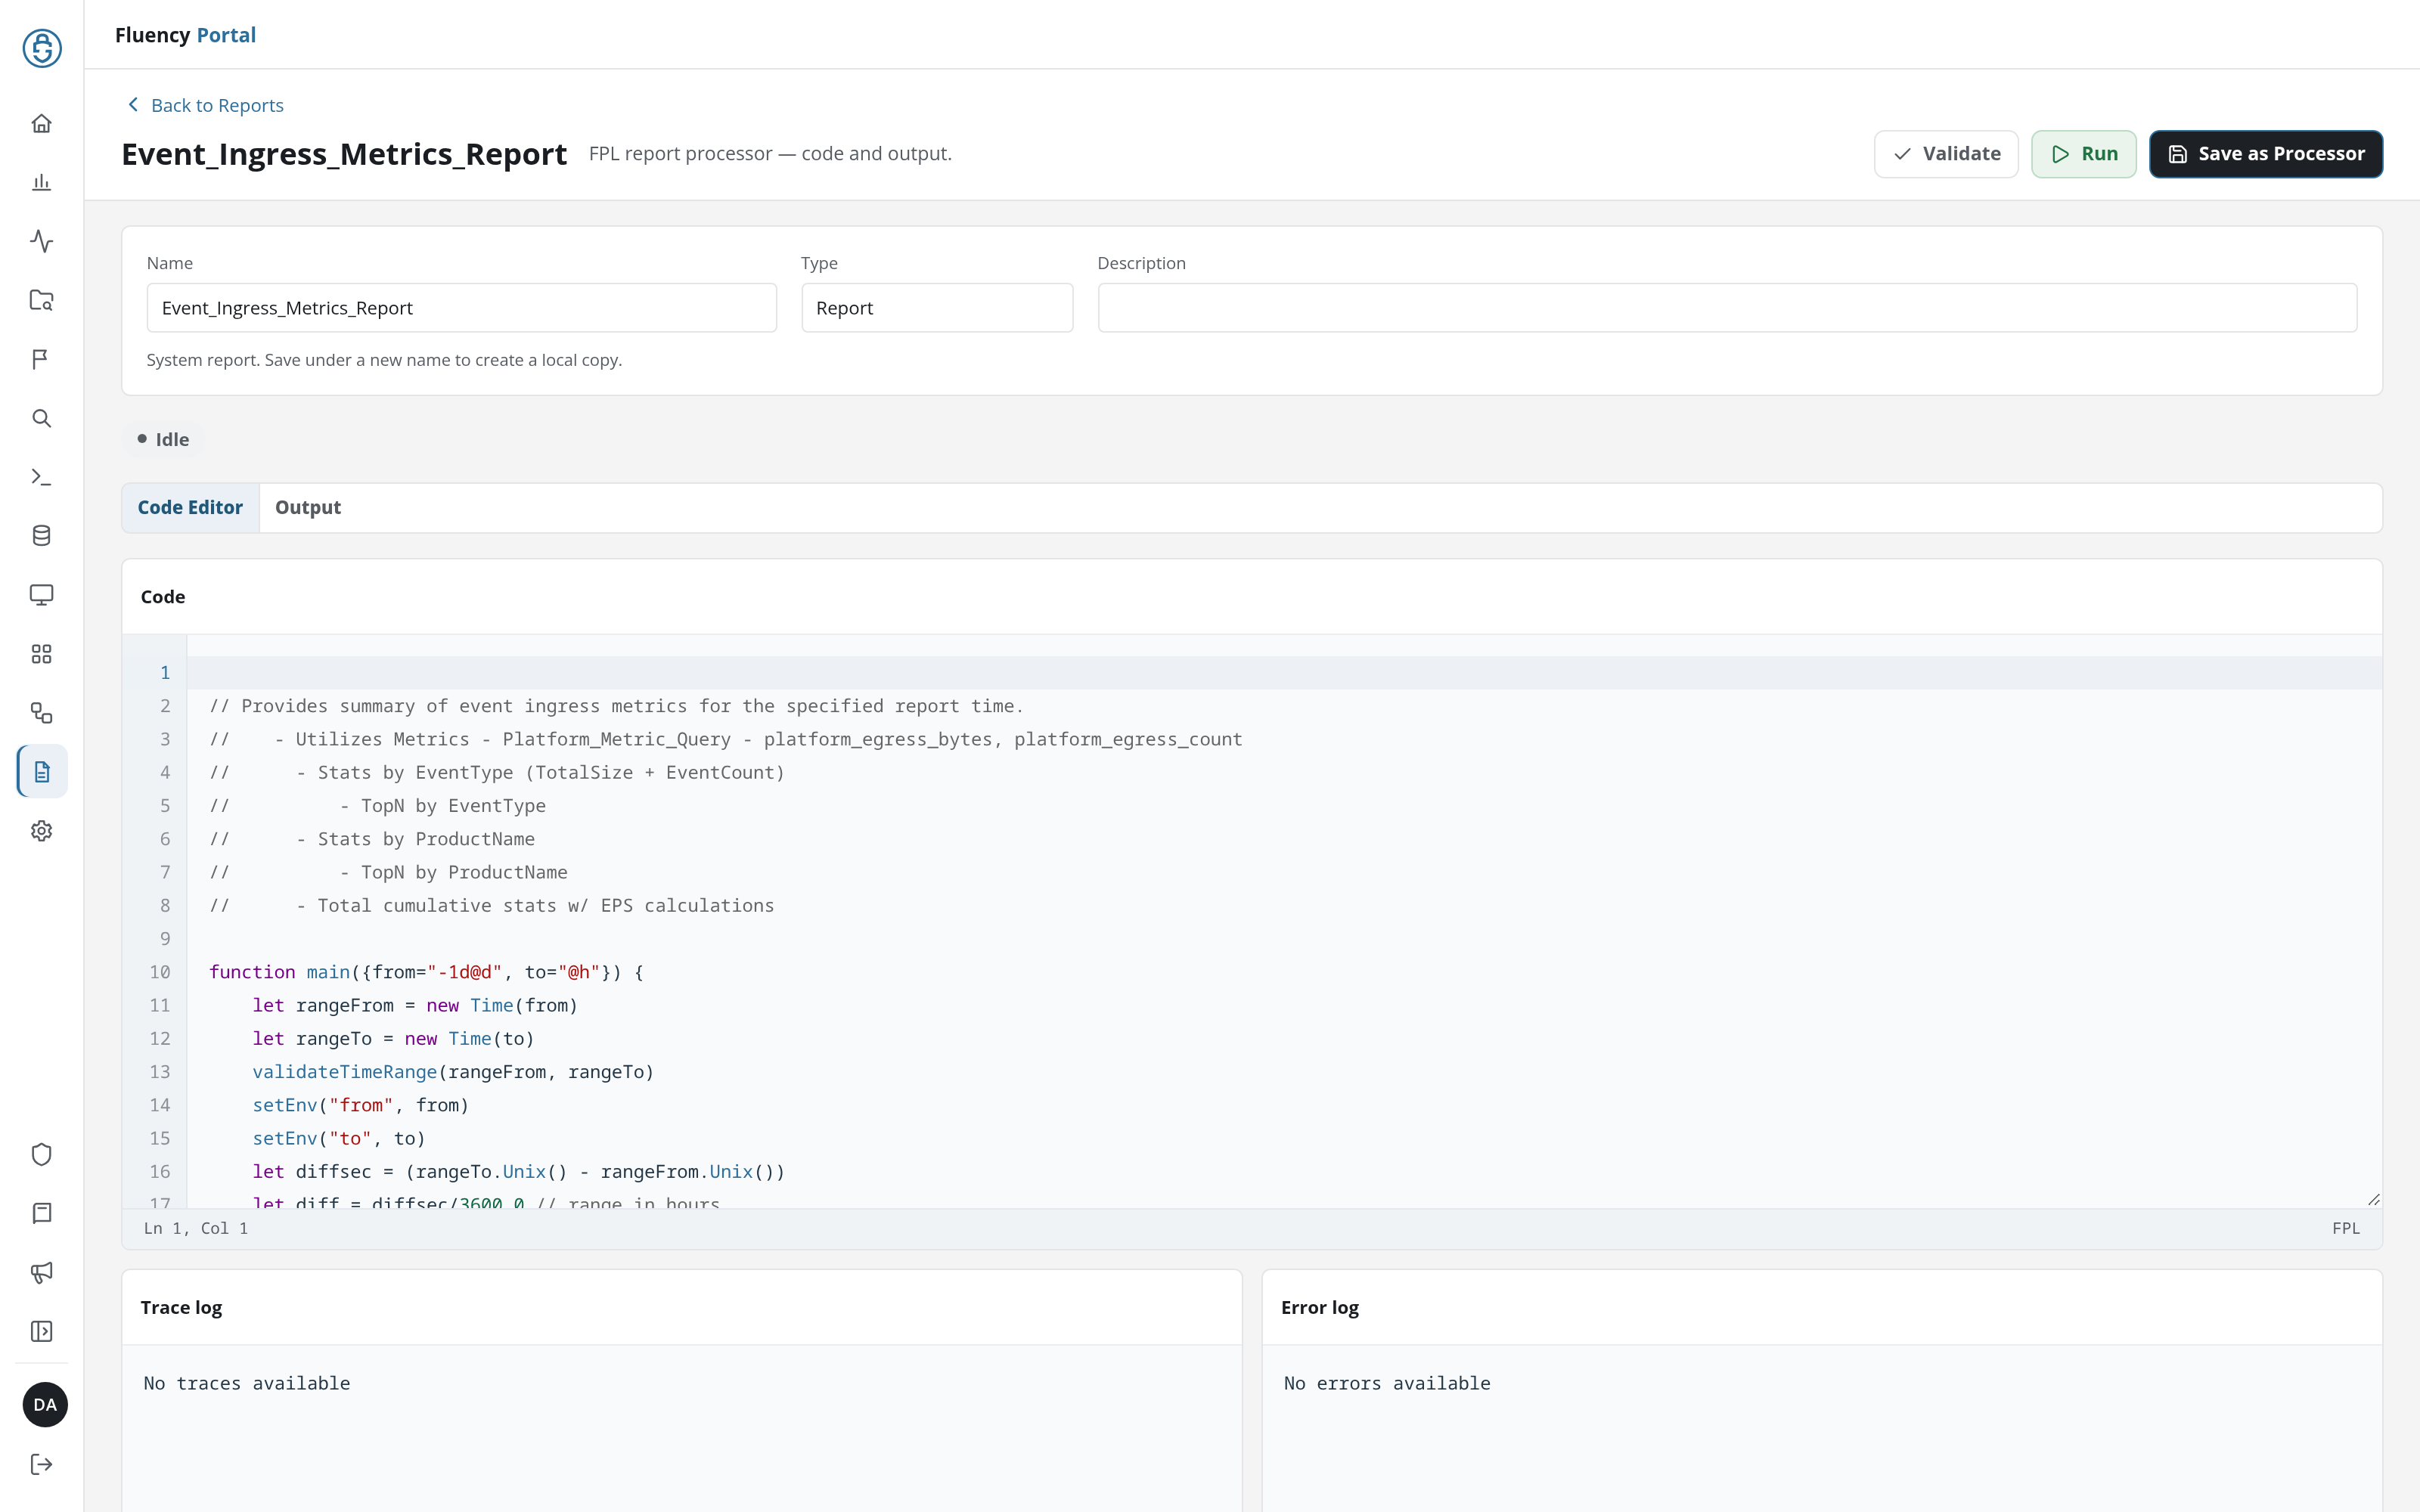
+ Add Report opens the editor on a new report (/v2/reports?kind=fpl&action=add) titled New_Report, with the subtitle FPL report processor – code and output. Opening a report from the table shows the same editor with that report's code.
-
Back to Reports: returns to the FPL reports list.
-
Name: the report's name, prefilled with
New_Reportfor a new report. -
Type: Report, read-only.
-
Description: free text.
-
Status: the run state beneath the fields, Idle while the report is not running.
-
Code Editor / Output: tabs for the code and for the report's output. The Output tab reads No output available until there is output to show.
-
Code: the FPL source, with line numbers, and the cursor position (Ln 1, Col 1) and the language (FPL) in its footer. A new report starts with an empty
mainfunction:function main() {return {}} -
Trace log and Error log: the trace and error output of a run; No traces available and No errors available until there is some.
Three buttons sit in the header's upper-right corner:
- Validate: checks the report's code without running it. A green notice reads Validation successful., or a red one gives the parser's error, which also fills Error log (for example
line 2:2 mismatched input 'return' expecting …). - Run: runs the report's code; see Running a Report.
- Save Processor: saves the report under its Name, and is greyed out while Name is empty. Once the report is saved, a green notice reads <name> has been saved., the URL becomes
/v2/reports?kind=fpl&name=<name>, Name turns read-only, and the button reads Update Processor. Update Processor saves later changes, with the notice <name> has been updated.
A system report (one supplied with the platform) opens with the note System report. Save under a new name to create a local copy. beneath its fields, and its save button reads Save as Processor.
A report saved on the site opens with its Name read-only and its save button reading Update Processor. A Prior runs drop-down at the right of the status reads No selected run ▾; it lists the report's earlier runs (<date and time> by <user> (ID:<run ID>)), and choosing one loads it as described under Report Runs.
Running a Report
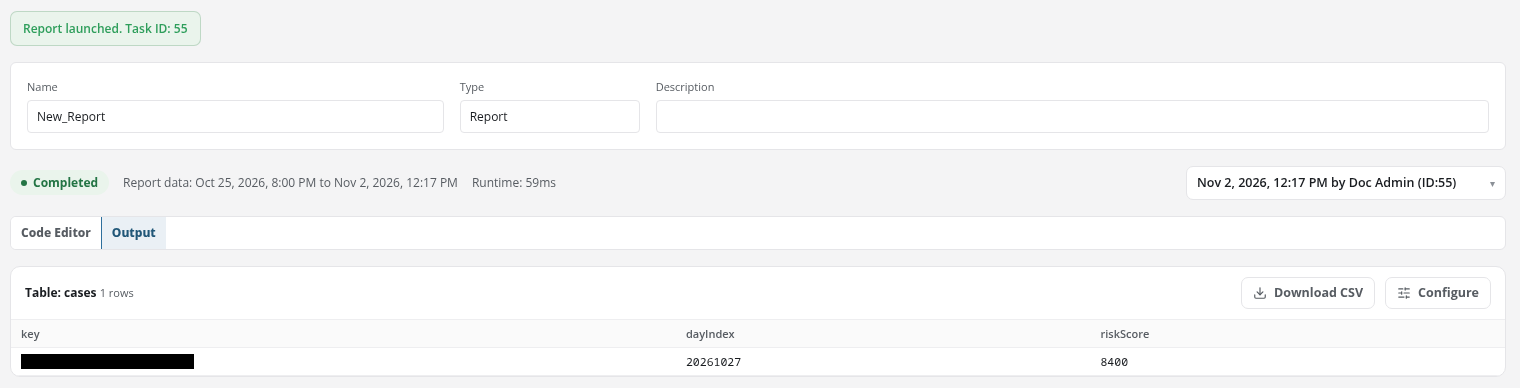
Run starts the report with the code in the editor, whether or not it has been saved; an unsaved report runs under the name in Name. A green notice reads Report launched. Task ID: <run ID>, and the URL gains the run (/v2/reports?kind=fpl&name=<name>&id=<run ID>). The editor then shows the run as described under Report Runs: its status badge (such as Completed), Report data: <start> to <end> (the time range the run read, in local time), its Runtime, and the run selected in the Prior runs drop-down, with the page switched to the Output tab. Lines the code writes with printf appear in Trace log, on the Code Editor tab. Every run is also listed on Report Tasks.
Report Runs
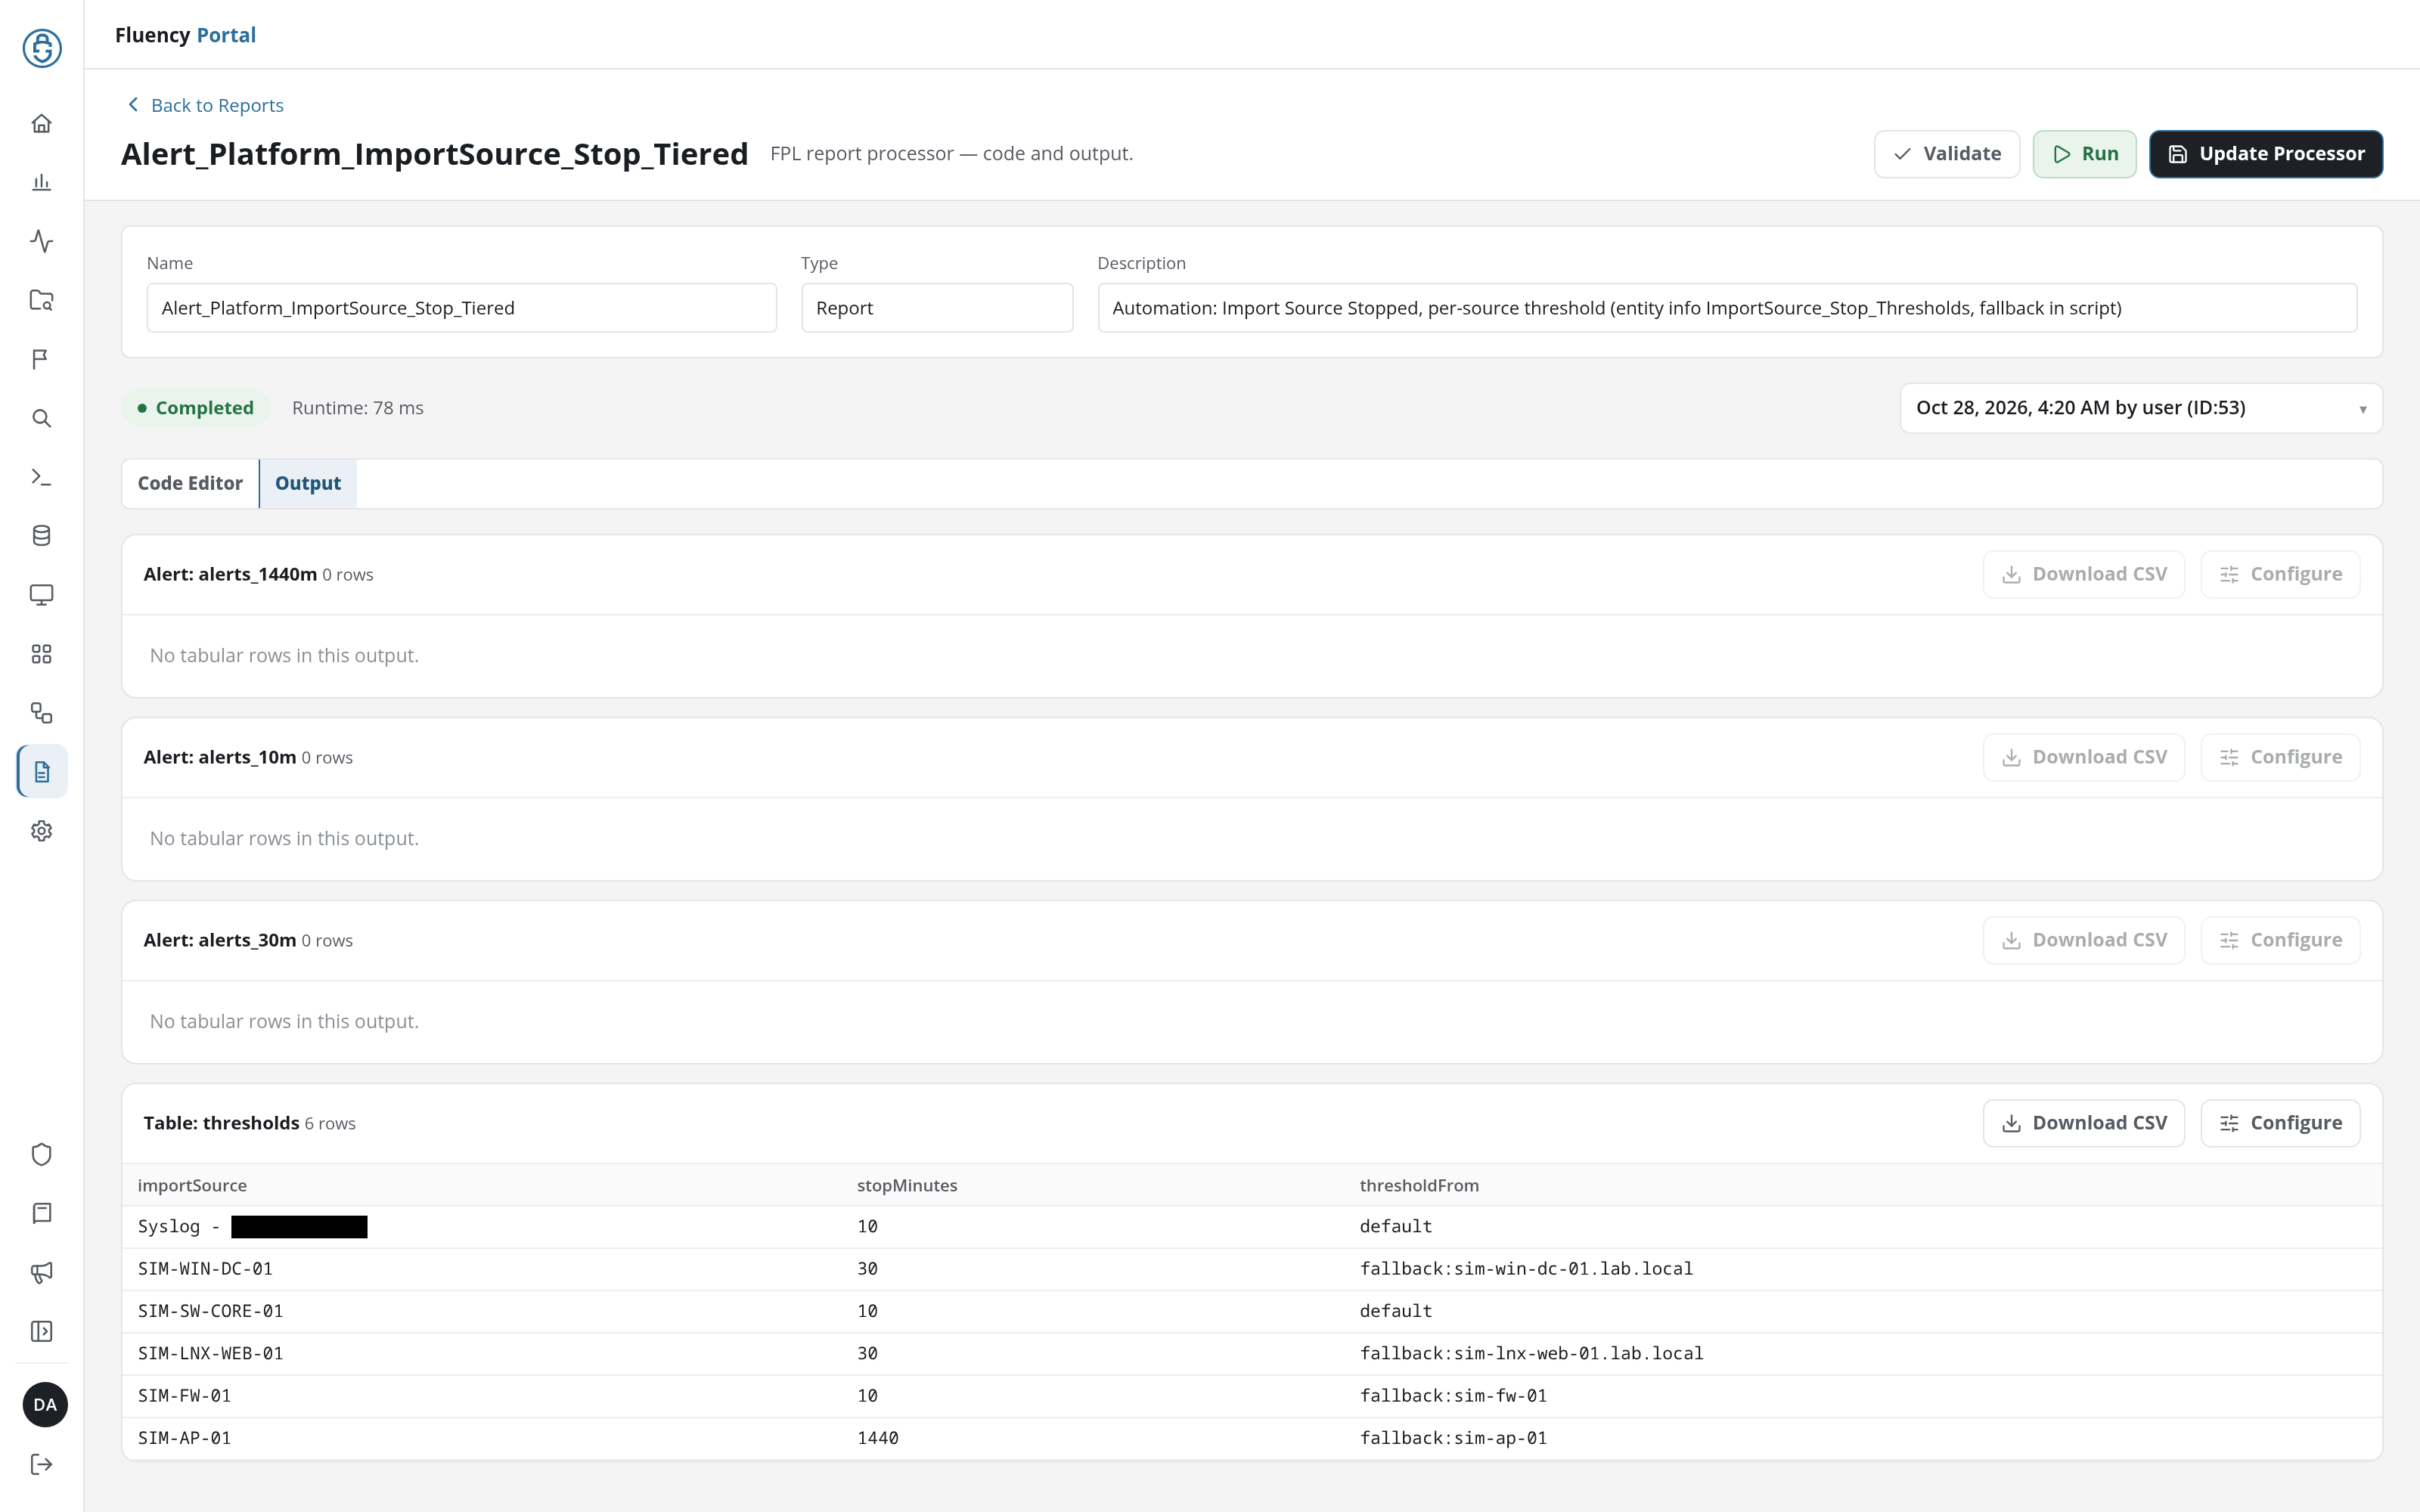
A row on Report Tasks opens the report with one of its runs loaded, at /v2/reports?kind=fpl&name=<report name>&id=<run ID>. The editor then shows that run's results:
- Update Processor: the save button, beside Validate and Run in the header.
- Run status: beneath the fields, in place of Idle: the run's status as a badge, such as Completed, and its Runtime (for example Runtime: 89 ms).
- Prior runs drop-down: at the right of the status, the run loaded: when it ran, who ran it, and its ID (
<date and time> by <user> (ID:<run ID>)). - Output: the tab the page opens on, with one section per output of the run. Each section is headed by the output's kind and name (Alert: or Table:) and its row count, and has a Download CSV button and a Configure button, both greyed out when the output has no rows. Beneath the heading, the output's rows fill a table with one column per field (click a column header to re-sort it), or the section reads No tabular rows in this output.
Download CSV and Configure
An output section's Download CSV saves its rows as <output name>.csv, a comma-separated file with a header row and quoted values.
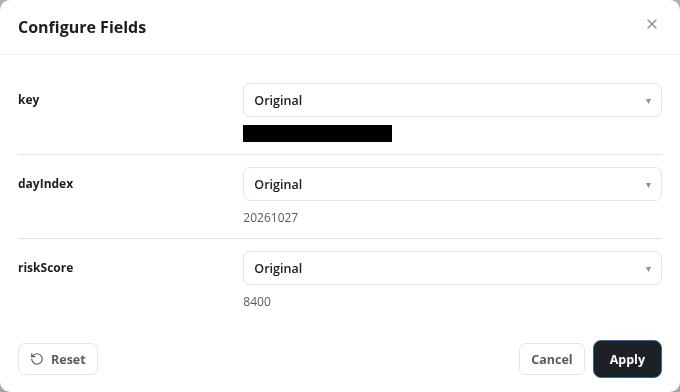
Configure opens the Configure Fields dialog, with one row per column of the output: the column's name, a Format for <column> drop-down, and a sample value beneath it. The formats are Original (the default), Bytes (KiB, MiB), Comma-separated number, Timestamp (UTC), Duration (milliseconds), and Floating point. Apply reformats the table on the page (for example 8400 as 8,400); the formats are not saved with the report. Reset and Cancel sit beside Apply at the foot of the dialog.