Metric Alerts
The Metric Alerts page lists the alerts raised from the platform's metrics, for example an FPL_Import_Source_Stop alert on a syslog source. Counters across the top total the alerts in the selected window, and a filter bar narrows the list by time, status and text.
Menu path: Metric Alerts · URL path: /v2/metric-alerts
Page Layout
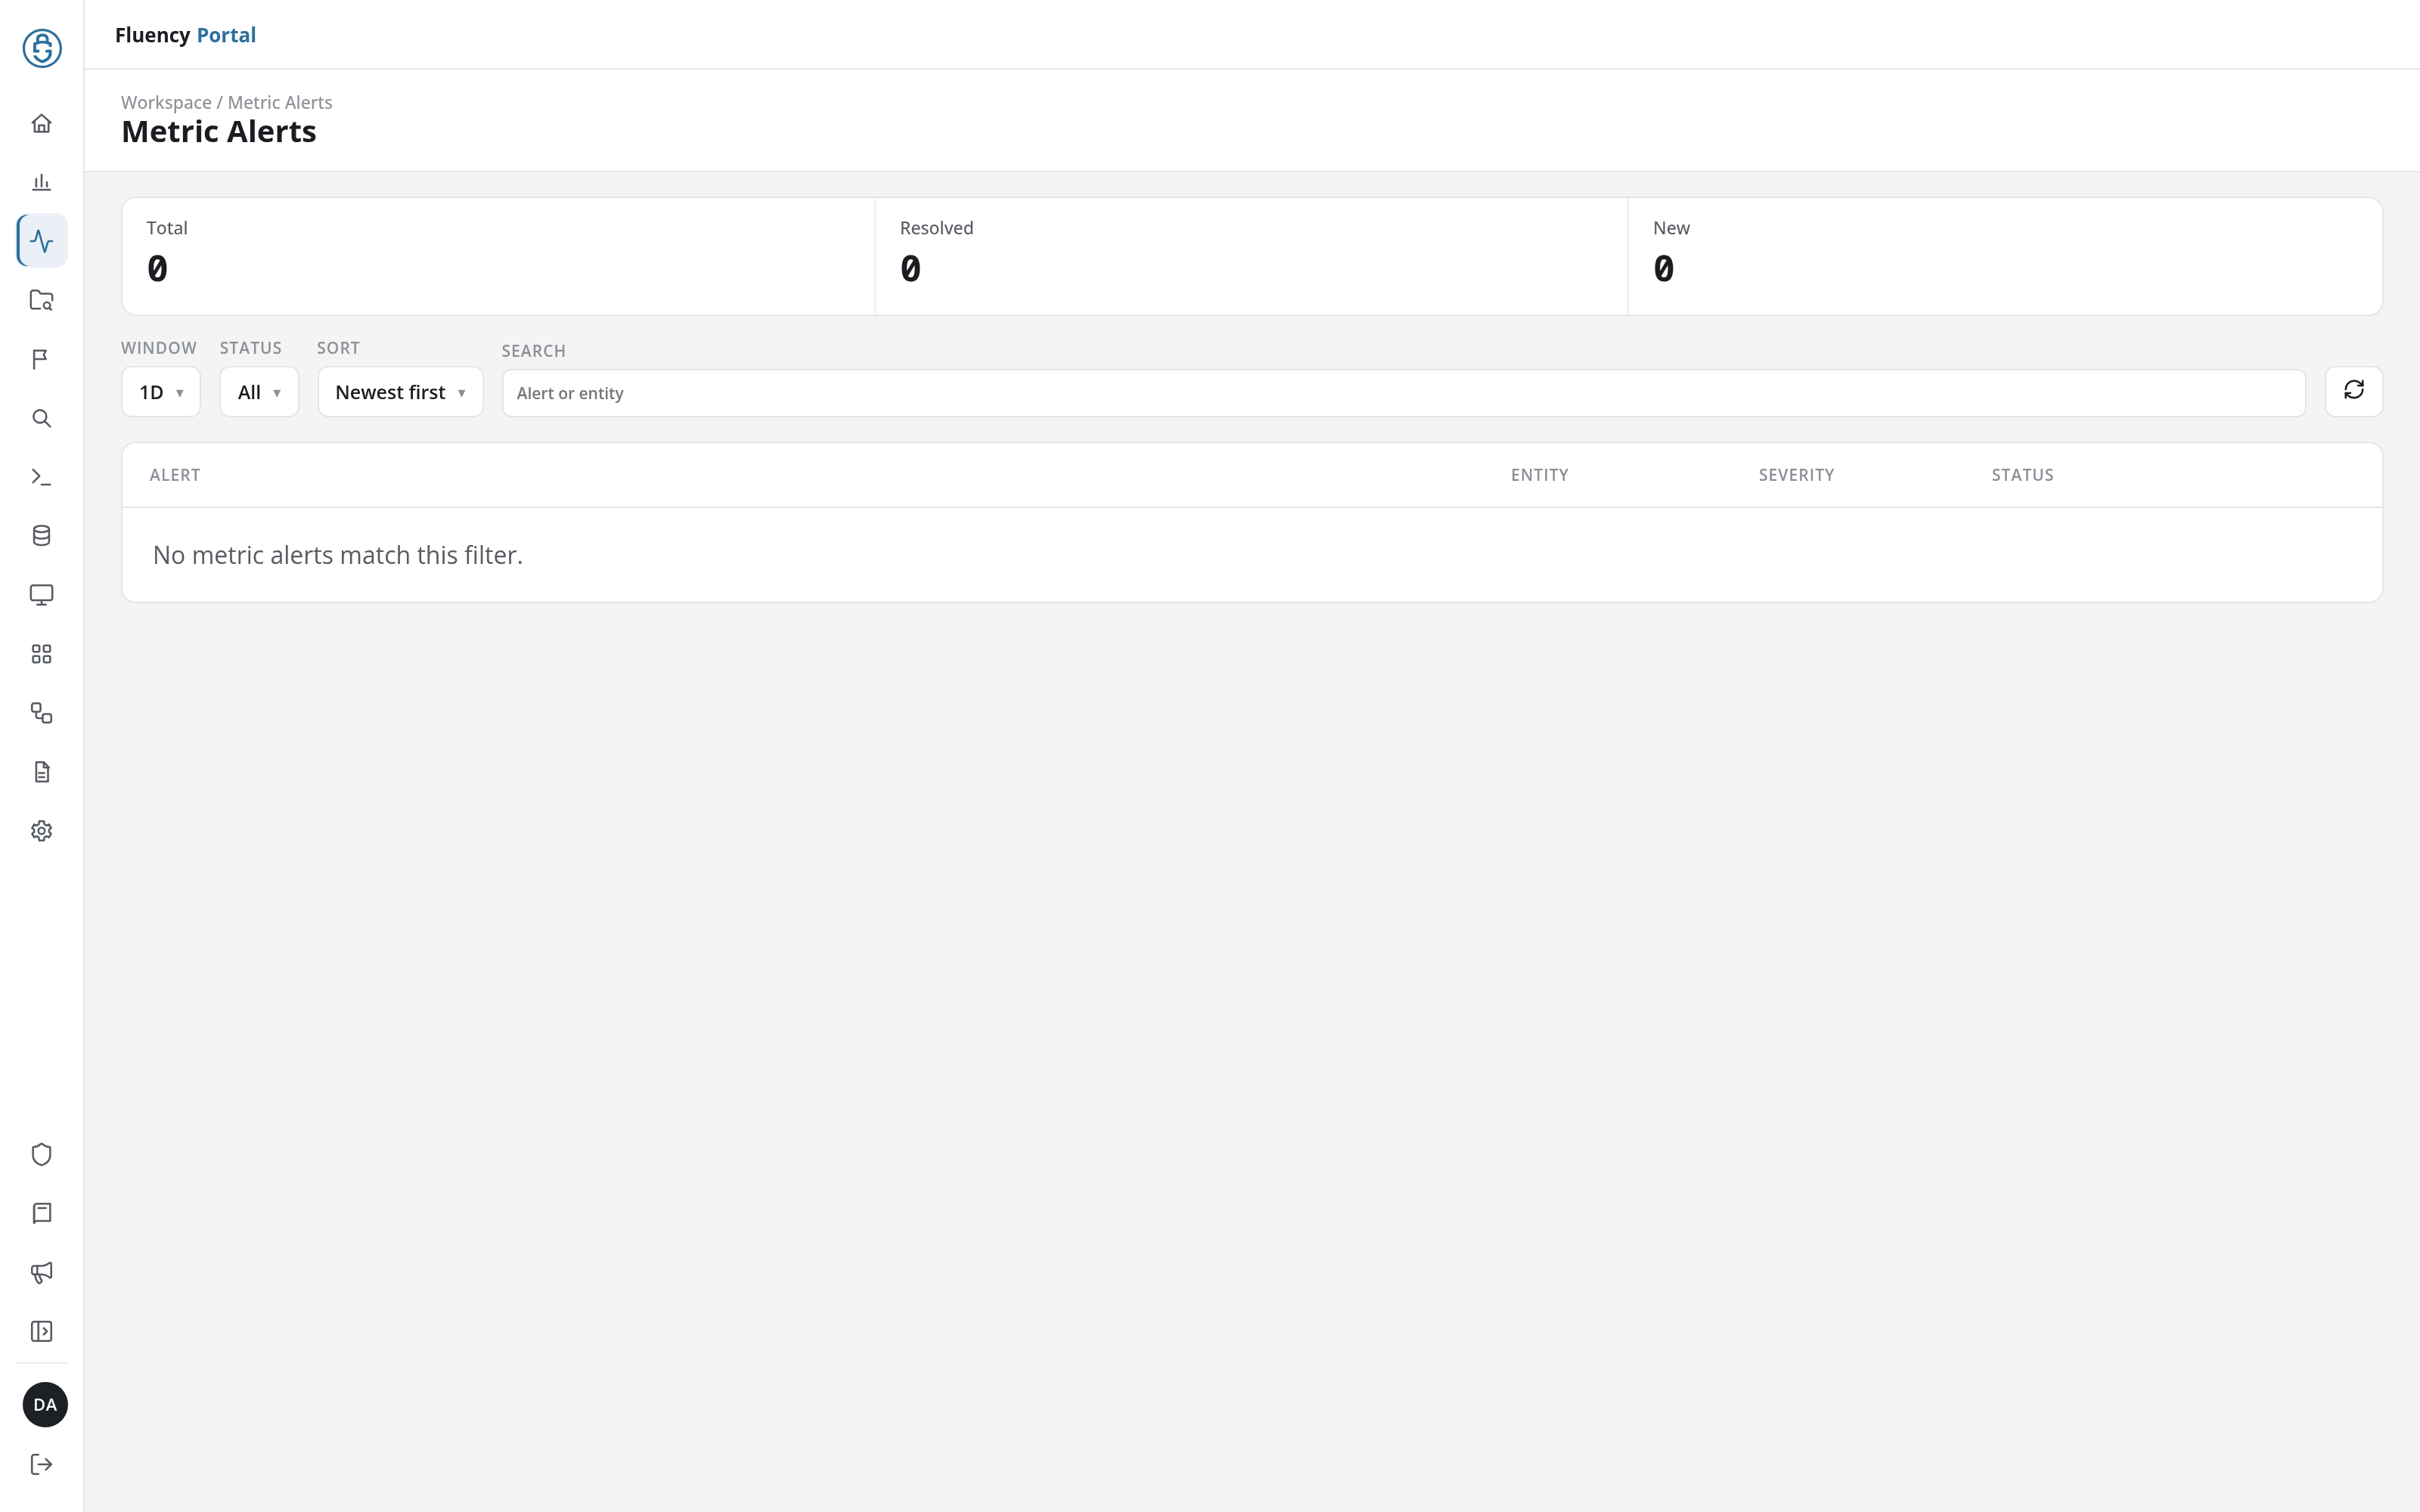
The header shows the breadcrumb Workspace / Metric Alerts and the title Metric Alerts. Below it, from top to bottom:
- Counters: Total, Resolved and New.
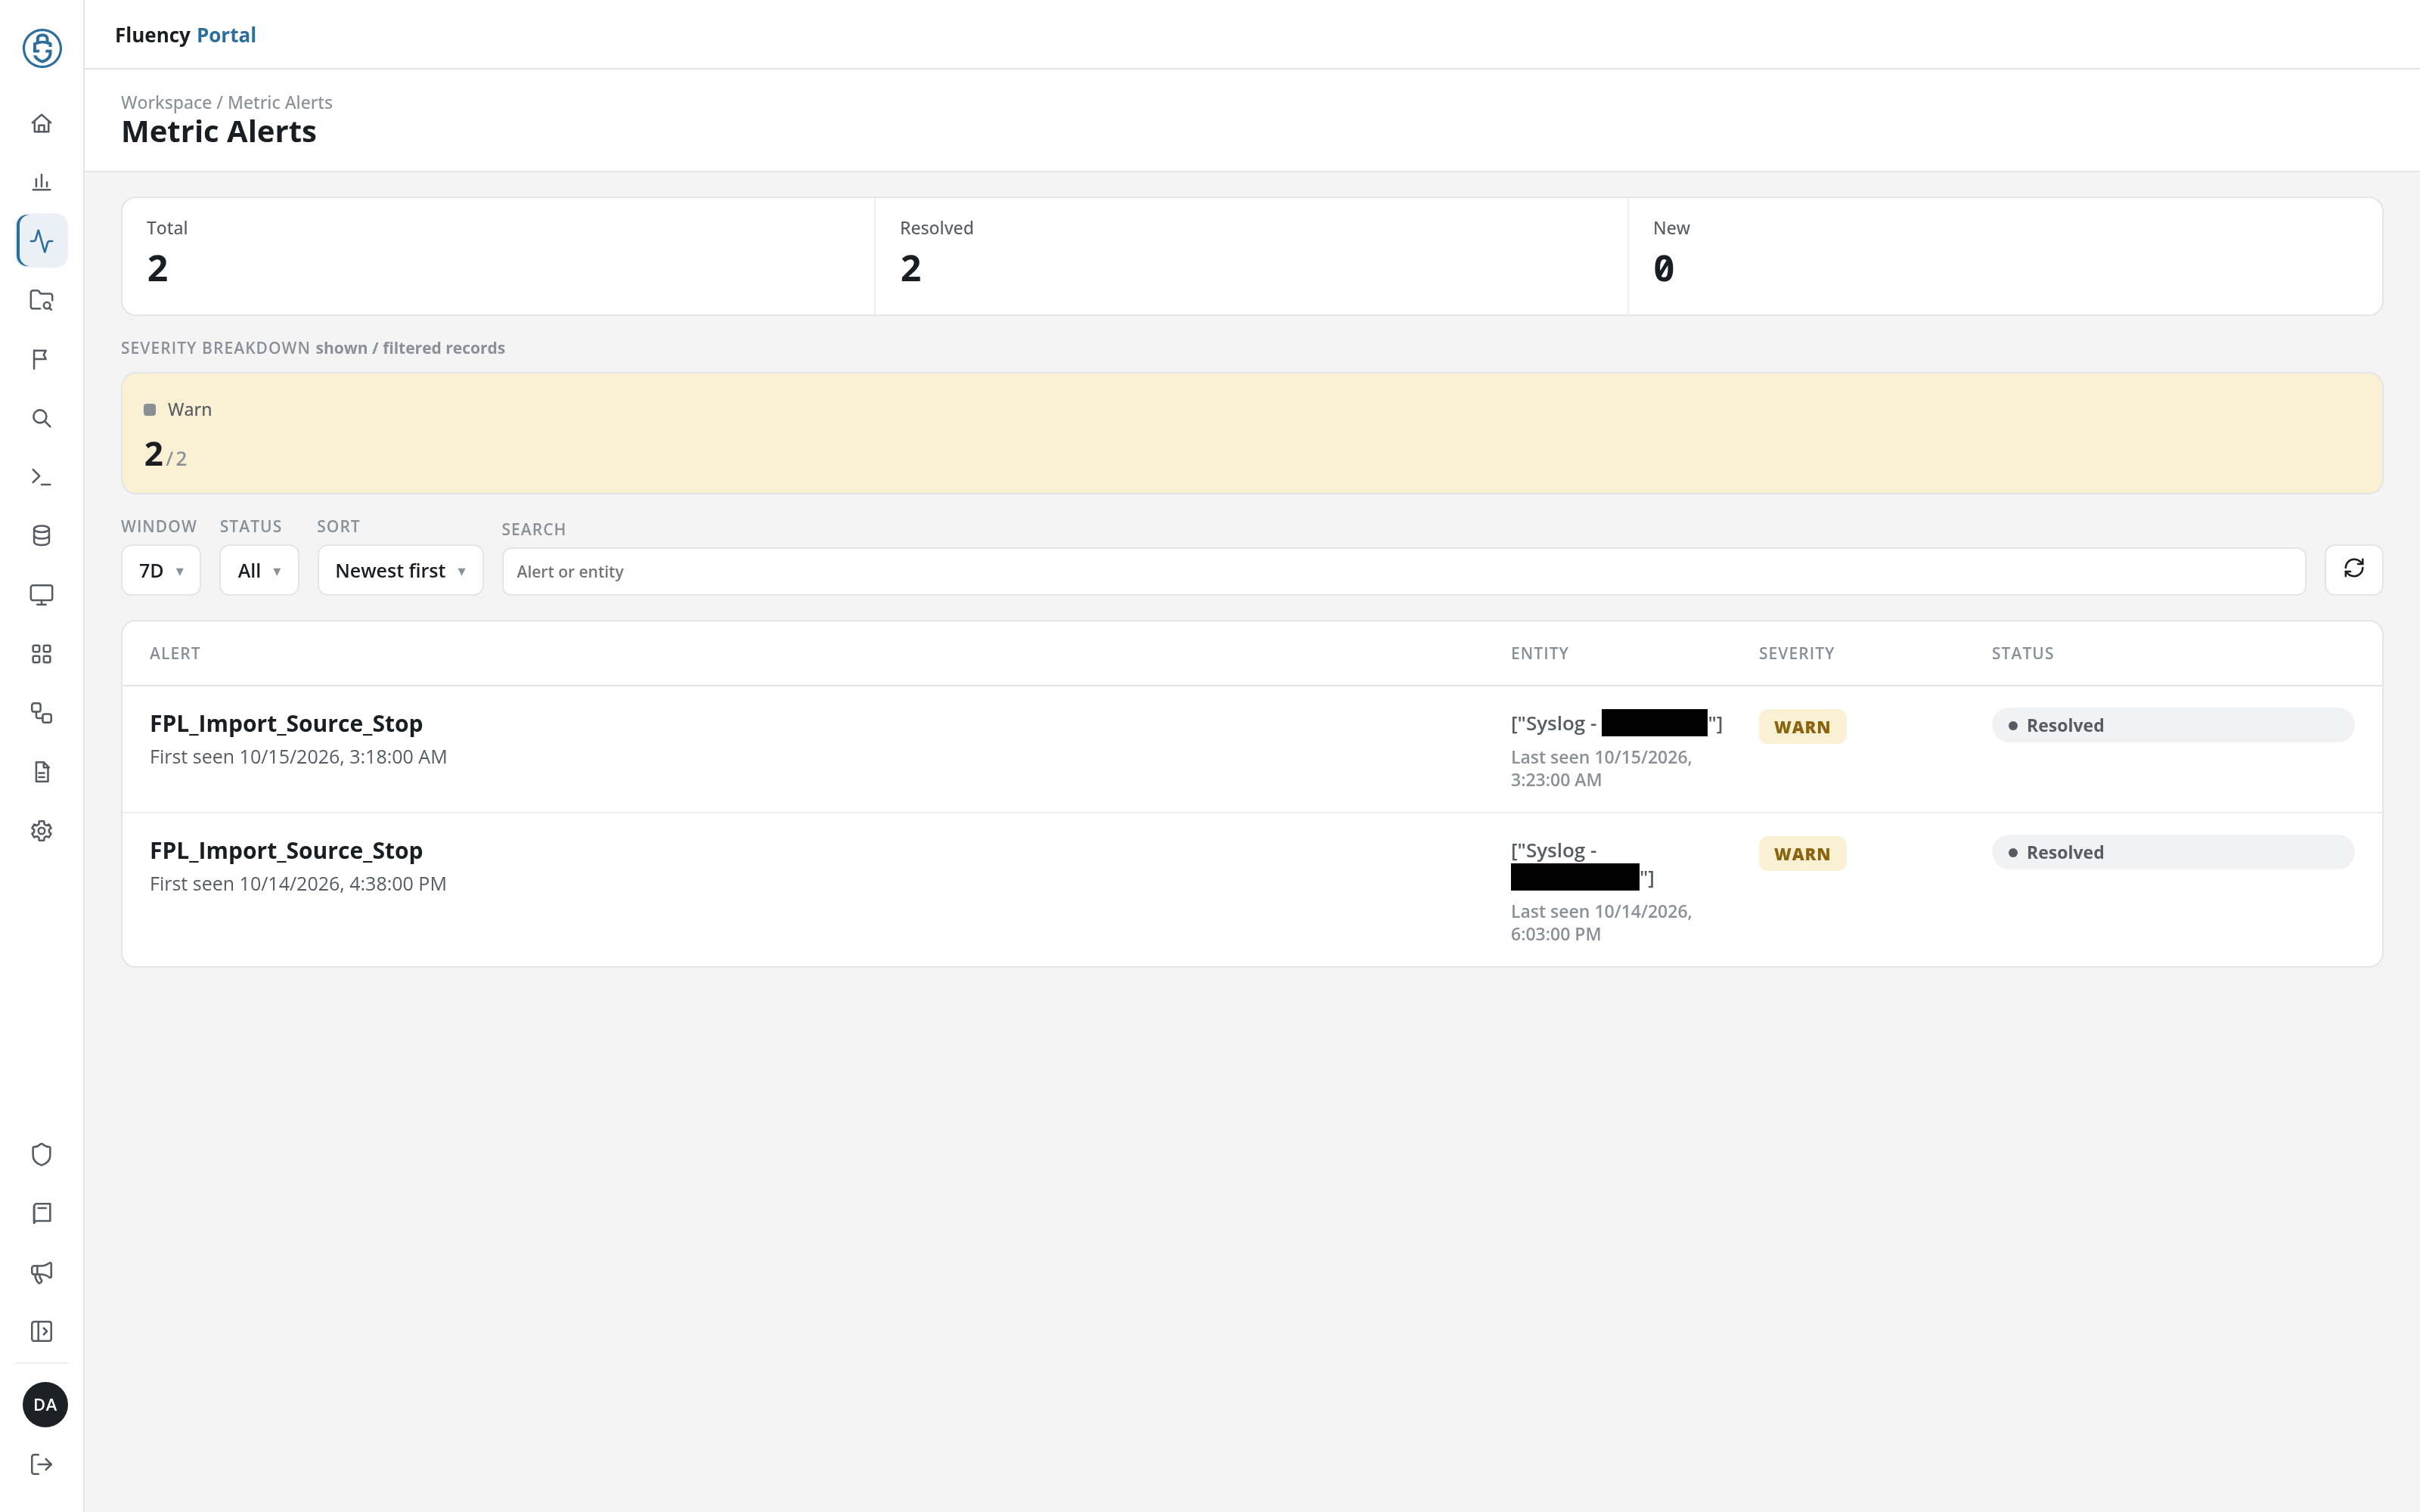
- Severity breakdown: one tile per severity found, shown only when the window holds alerts.
- Filter bar: Window, Status, Sort, Search, and a refresh button.
- Alert list: a table of the alerts that match the filters.
Counters
- Total: the alerts in the selected window.
- Resolved: how many of them are resolved.
- New: how many are new.
Severity Breakdown
When the window holds alerts, a SEVERITY BREAKDOWN shown / filtered records row appears below the counters, with a tile for each severity present, for example Warn. Each tile gives the alerts of that severity shown in the list and, after the slash, those that match the filters.
Filter Bar
- Window: the period to list: 1D (the default), 3D, 7D, 30D, 90D, All time, or Custom.
- Status: All (the default), New, Acknowledged or Resolved.
- Sort: Newest first (the default), Highest severity first, or Open first.
- Search: a text field (Alert or entity) that narrows the list to alerts whose name or entity matches.
Status, Sort and Search work on the alerts already loaded for the window: the list follows them at once, and the severity tiles follow Status, while Total, Resolved and New keep counting the whole window.
- Refresh: the round-arrow button at the right end of the bar reloads the list.
Custom Window
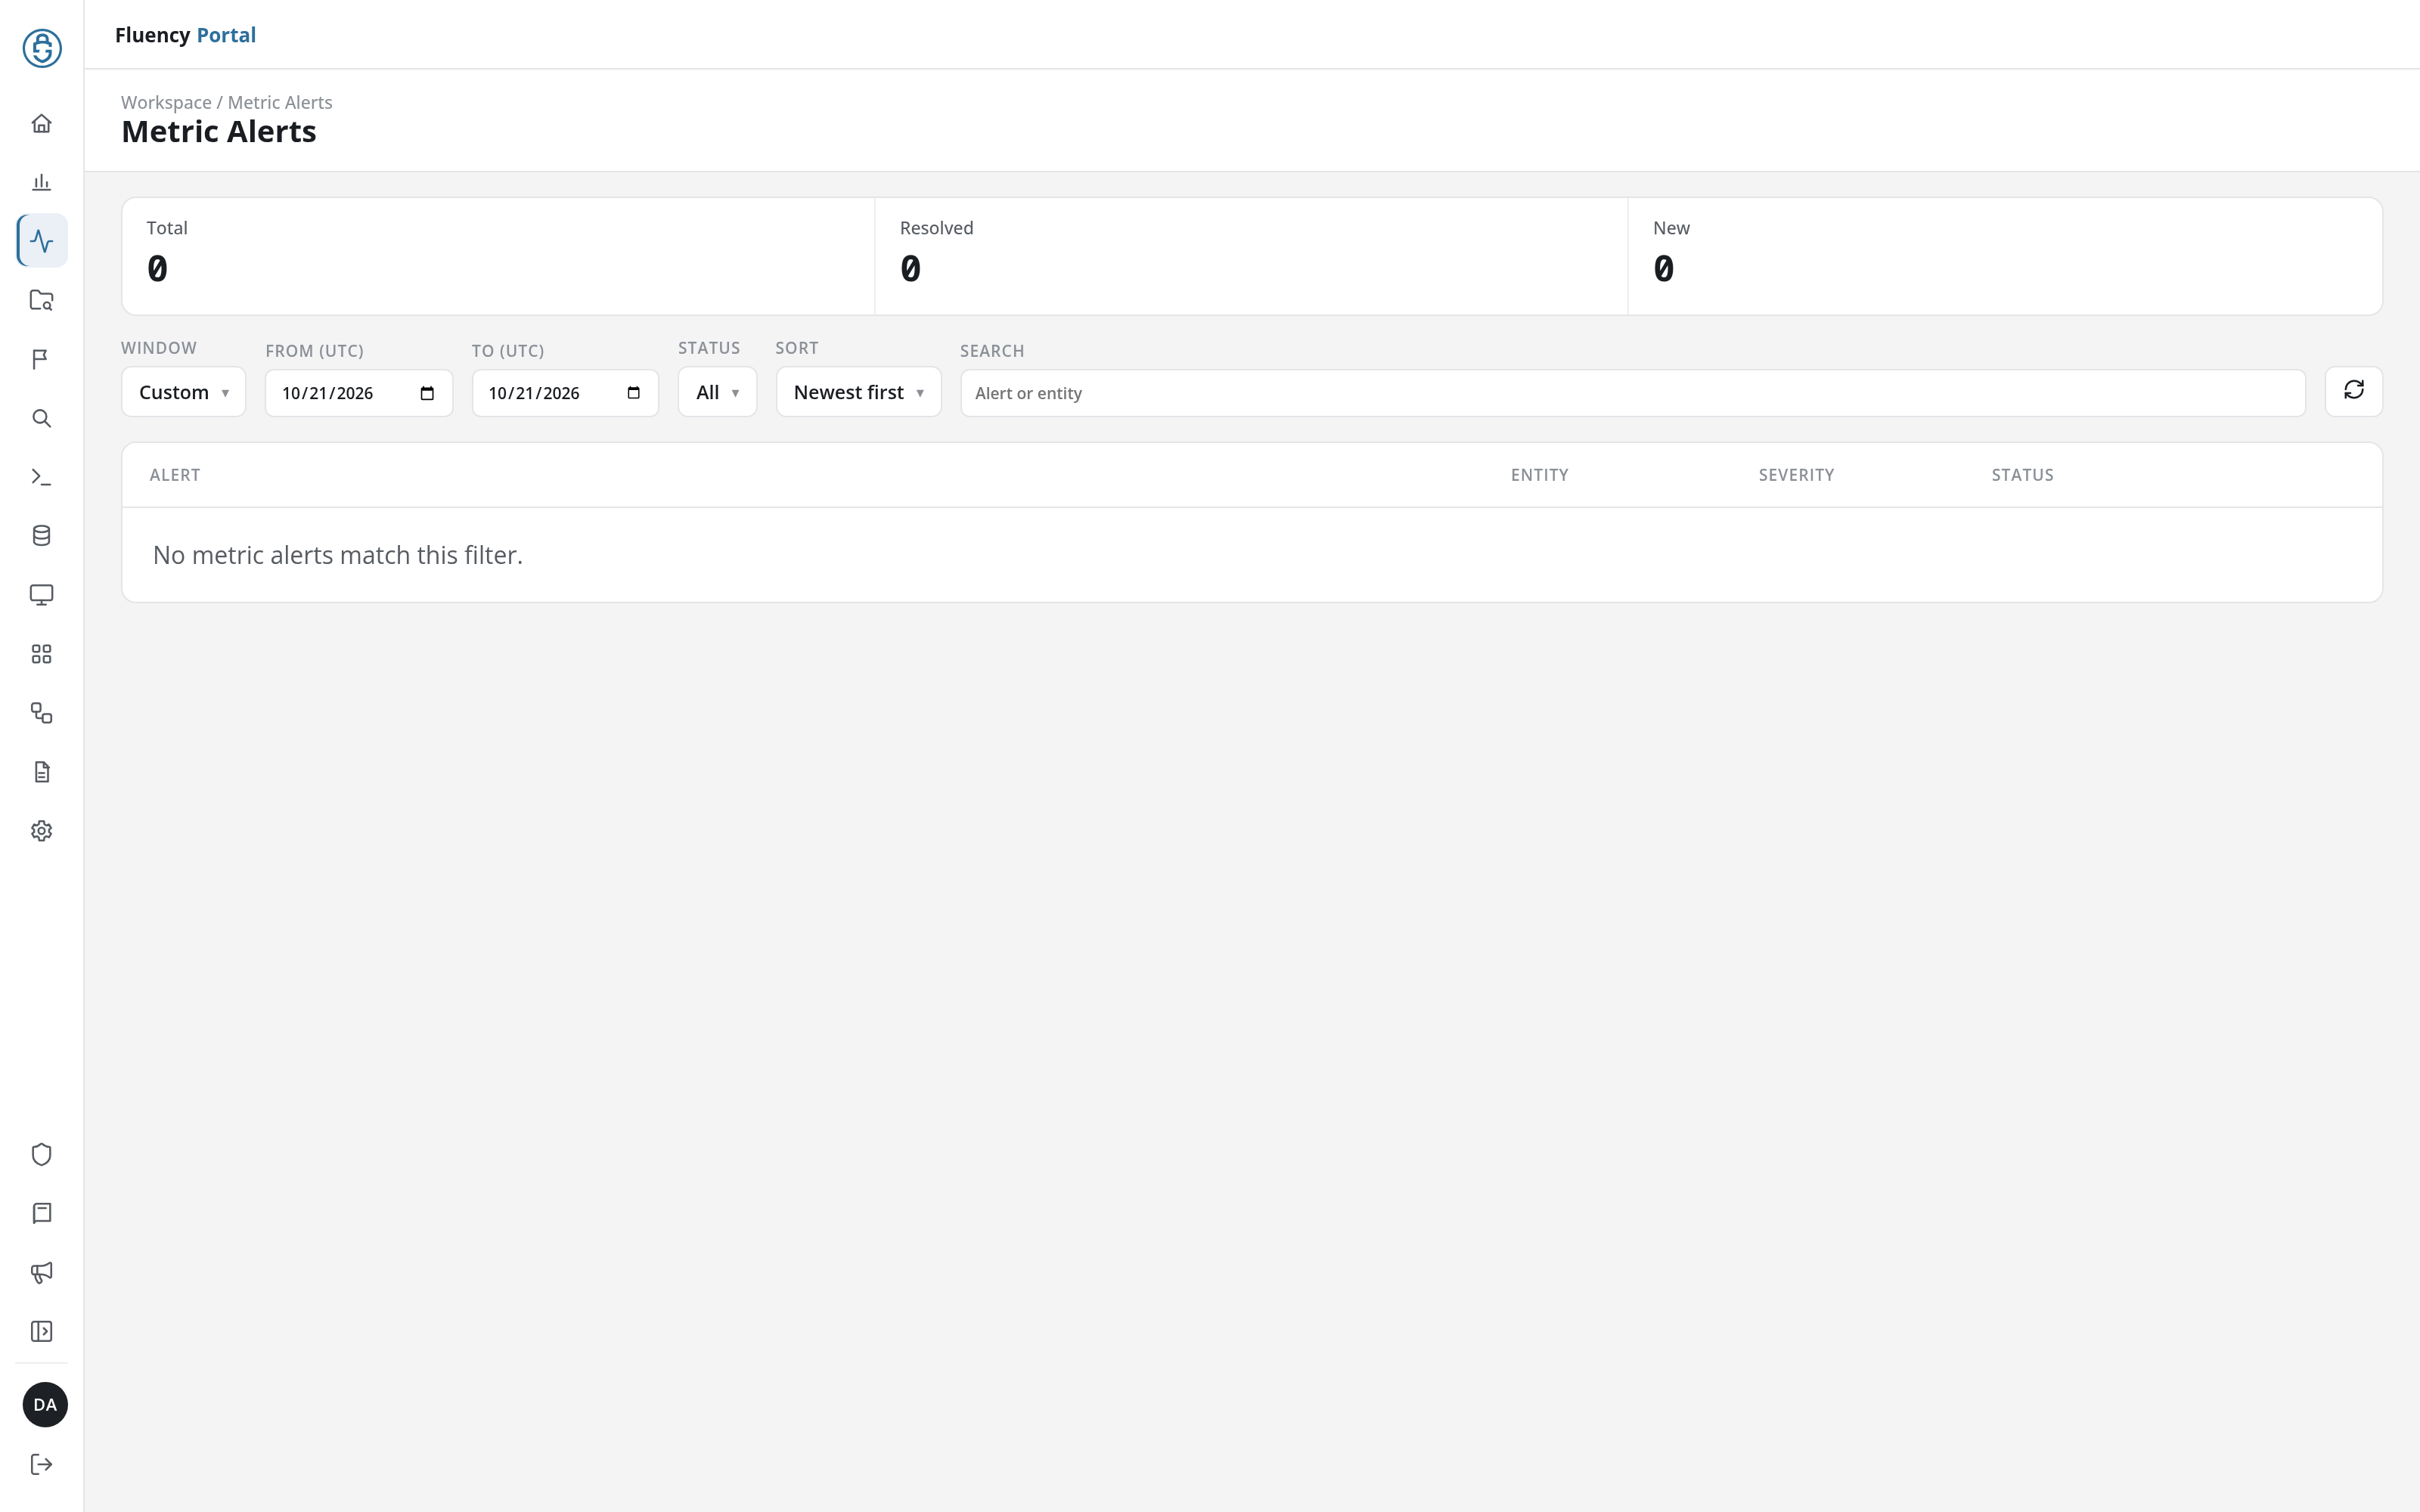
Choosing Custom adds two date fields beside the Window drop-down, FROM (UTC) and TO (UTC), both set to today when they first appear. Pick the first and last day of the range to list.
Alert List
The table has four columns:
| Column | What it shows |
|---|---|
| ALERT | The alert's name, with First seen and the time it was first raised beneath it. |
| ENTITY | What the alert is about, for an import source, the source it names (for example a syslog source), with Last seen and the time it was last raised beneath it. |
| SEVERITY | The alert's severity as a badge, such as WARN. |
| STATUS | The alert's status as a badge, such as Resolved. |
Each row is a single button: click anywhere on it to open the alert's detail dialog.
When nothing matches the filters, the table reads No metric alerts match this filter.
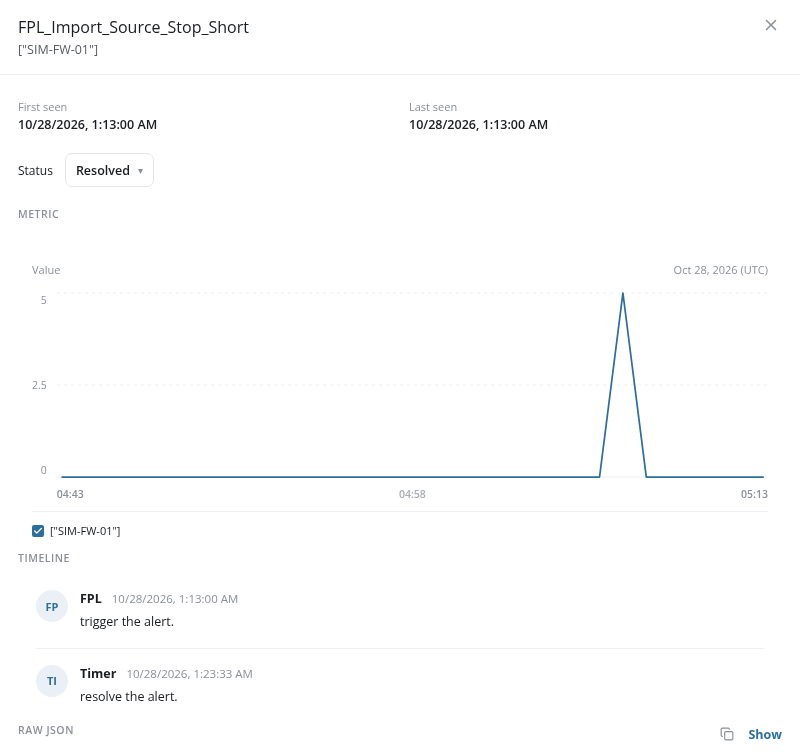
Alert Detail
Clicking an alert opens a dialog headed with the alert's name and, beneath it, its entity:
- First seen and Last seen: when the alert was first and last raised.
- Status: a drop-down showing the alert's status; its options are New, Acknowledged, Closed, and Resolved.
- METRIC: a chart of the metric behind the alert around the time it was raised, with the date in UTC above it and a checkbox per series beneath it that shows or hides that line.
- TIMELINE: each change to the alert, newest last, with its source and time, for example FPL <time> trigger the alert. followed by Timer <time> resolve the alert.
- RAW JSON: the alert's JSON record, collapsed. Show expands it (and Hide collapses it again), and the copy icon beside it (Copy JSON) copies the JSON to the clipboard.
The × in the upper-right corner (Close metric incident) closes the dialog.