Applications
The Applications page lists the applications installed on the platform and their current state. An application is a packaged pipeline (a data source, the processors that parse it, and the sinks it writes to) installed from a template by filling in a form. From this page you can see at a glance which applications are running, which need attention, and how much data each one moves; open an application's details; and install a new one.
Menu path: Applications · URL path: /v2/applications
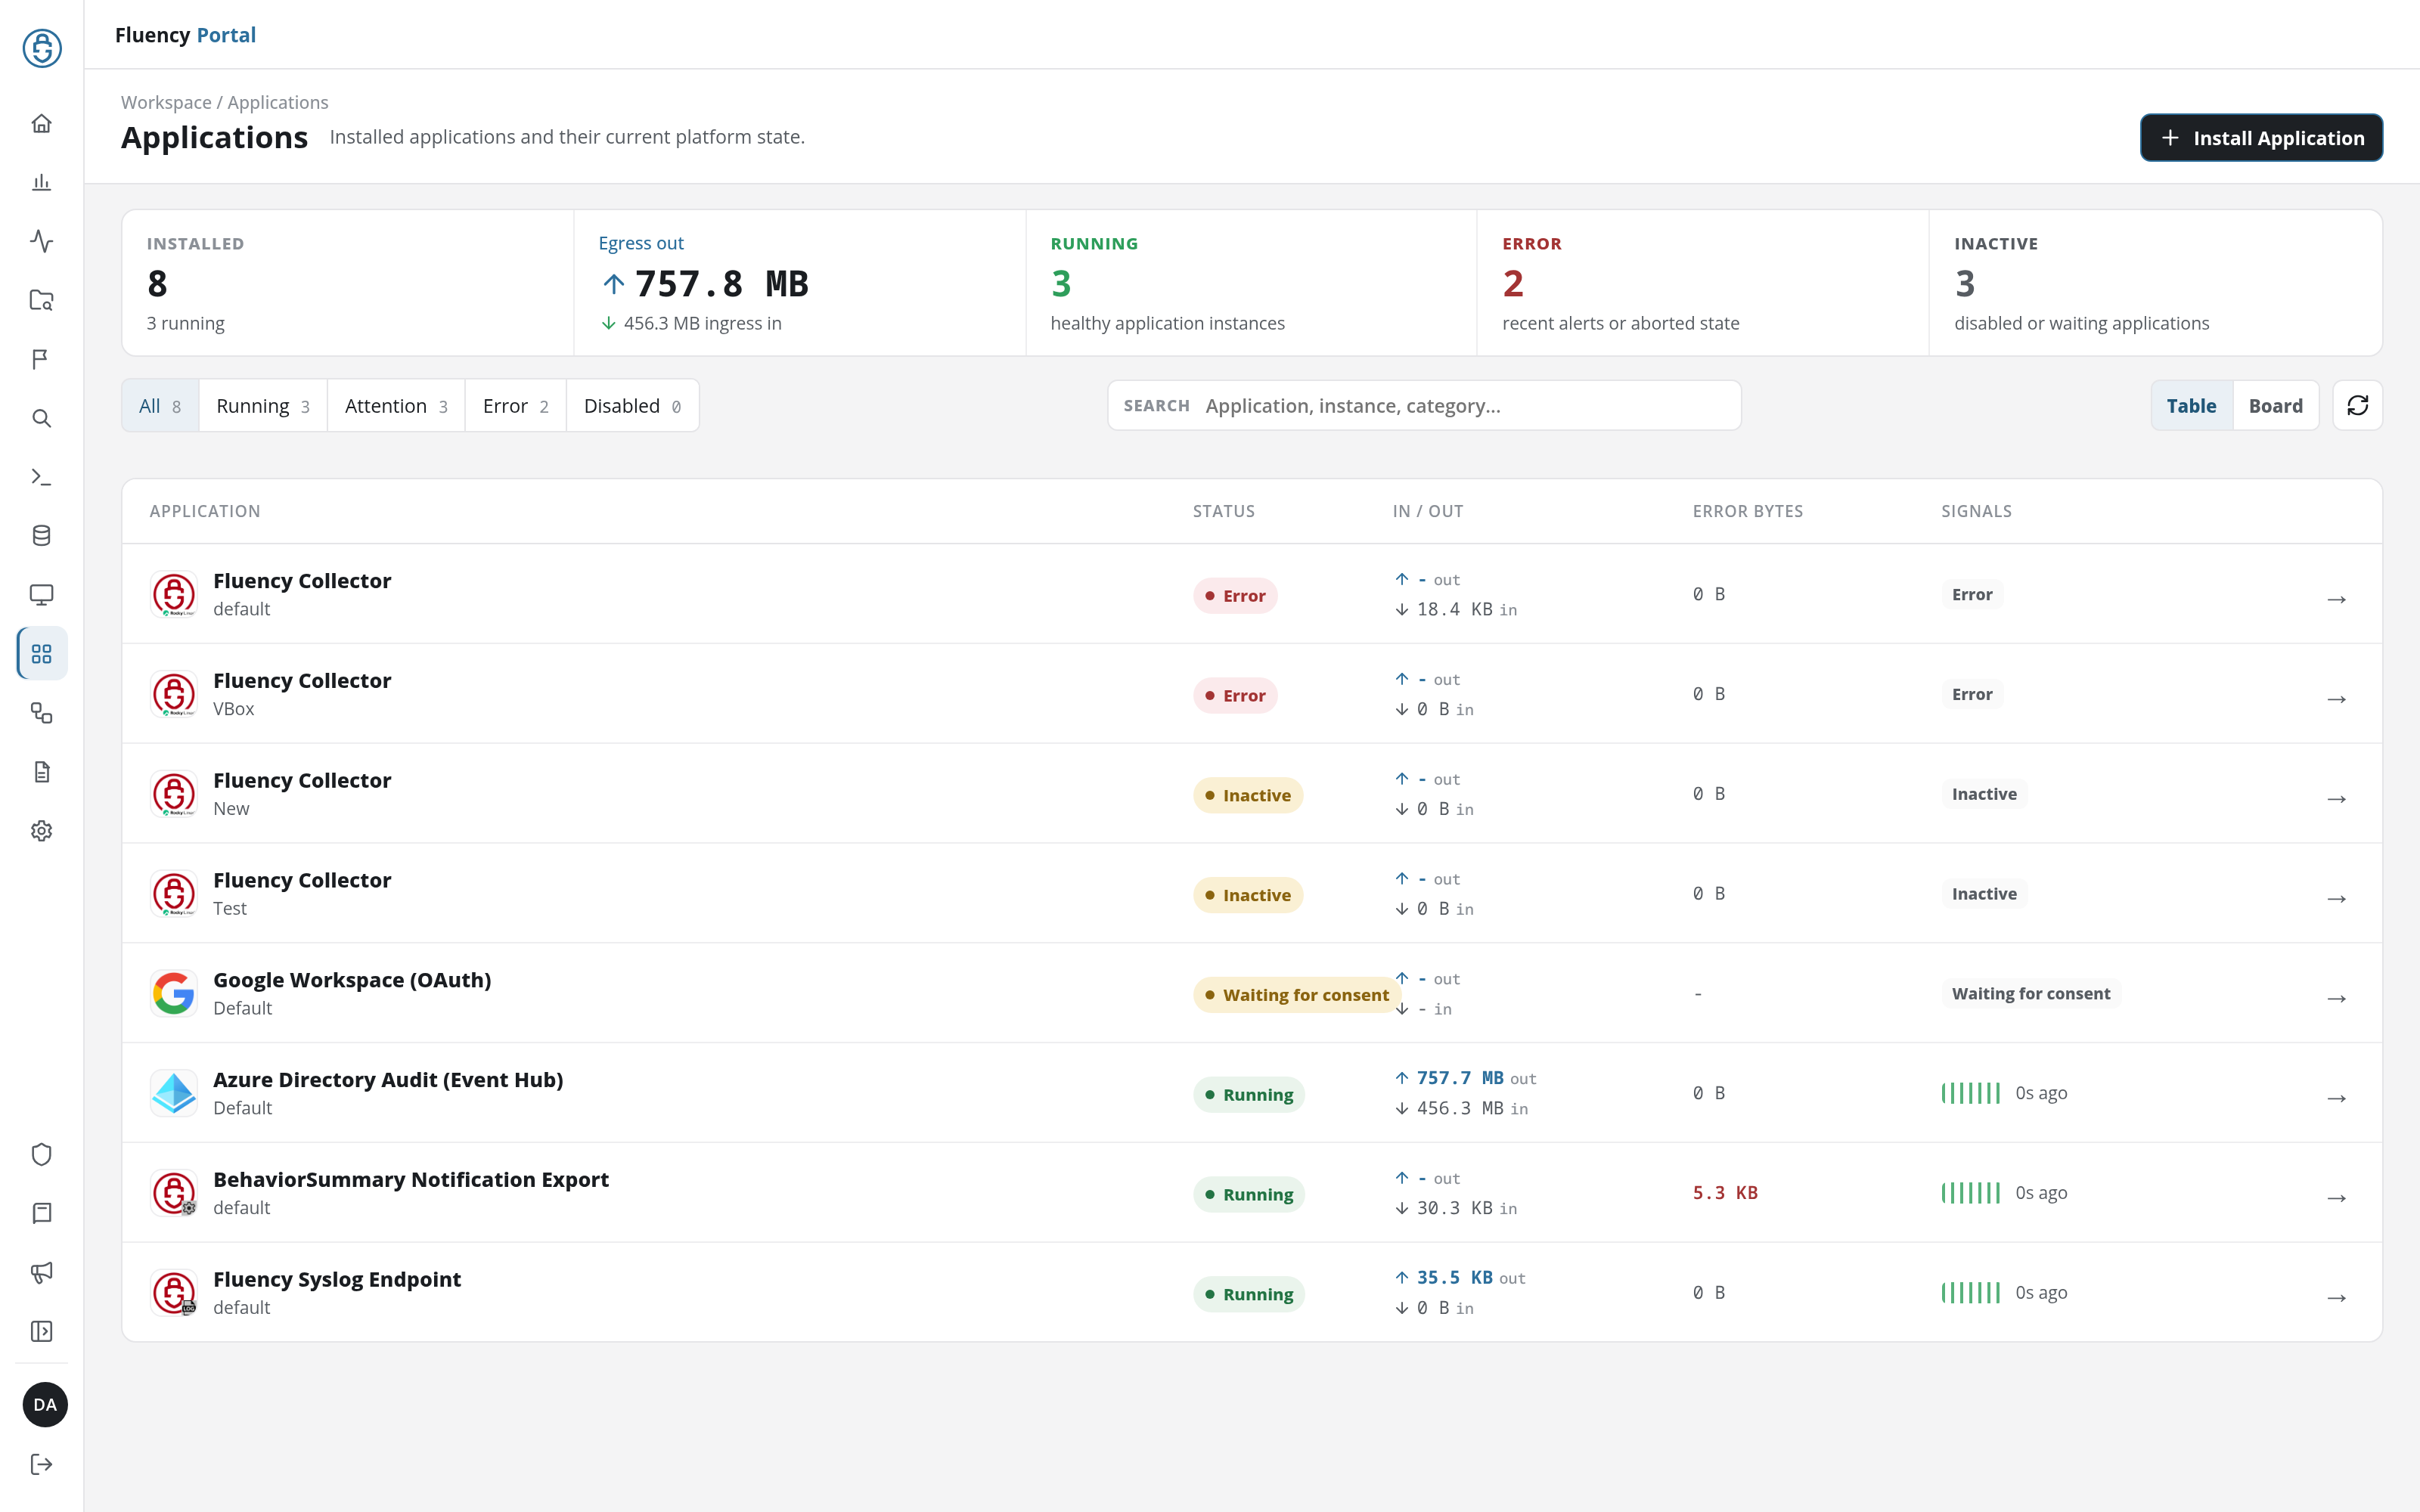
Page Layout
- Header: the breadcrumb Workspace / Applications, the title Applications with the subtitle Installed applications and their current platform state., and the Install Application button on the right.
- Status counters: five tiles summarizing every installed application.
- Toolbar: the status filters on the left, a Search field in the middle, and the view buttons and a refresh button on the right.
- Application list: the installed applications, as a table or as a board of cards.
Install Application
Click + Install Application to open the Application Catalog, the list of application templates you can install from. After an install, this page opens again with a notice naming the new application by its display name, such as Default is launching.
Status Counters
| Tile | What it shows |
|---|---|
| Installed | The number of installed applications, with how many of them are running beneath it. |
| Egress out | The total data the applications send out, with the total ingress beneath it. |
| Running | Healthy application instances. |
| Error | Applications with recent alerts or in an aborted state. |
| Inactive | Applications that are disabled or waiting: for example, waiting for an administrator's consent. |
Status Filters
The buttons on the left of the toolbar narrow the list by state, each with the number of applications in that state: All, Running, Attention, Error, and Disabled. The selected filter is highlighted; All is the default. Attention gathers the applications that need action: in the example below, the inactive collectors and an application waiting for consent. Applications in error are listed under Error.
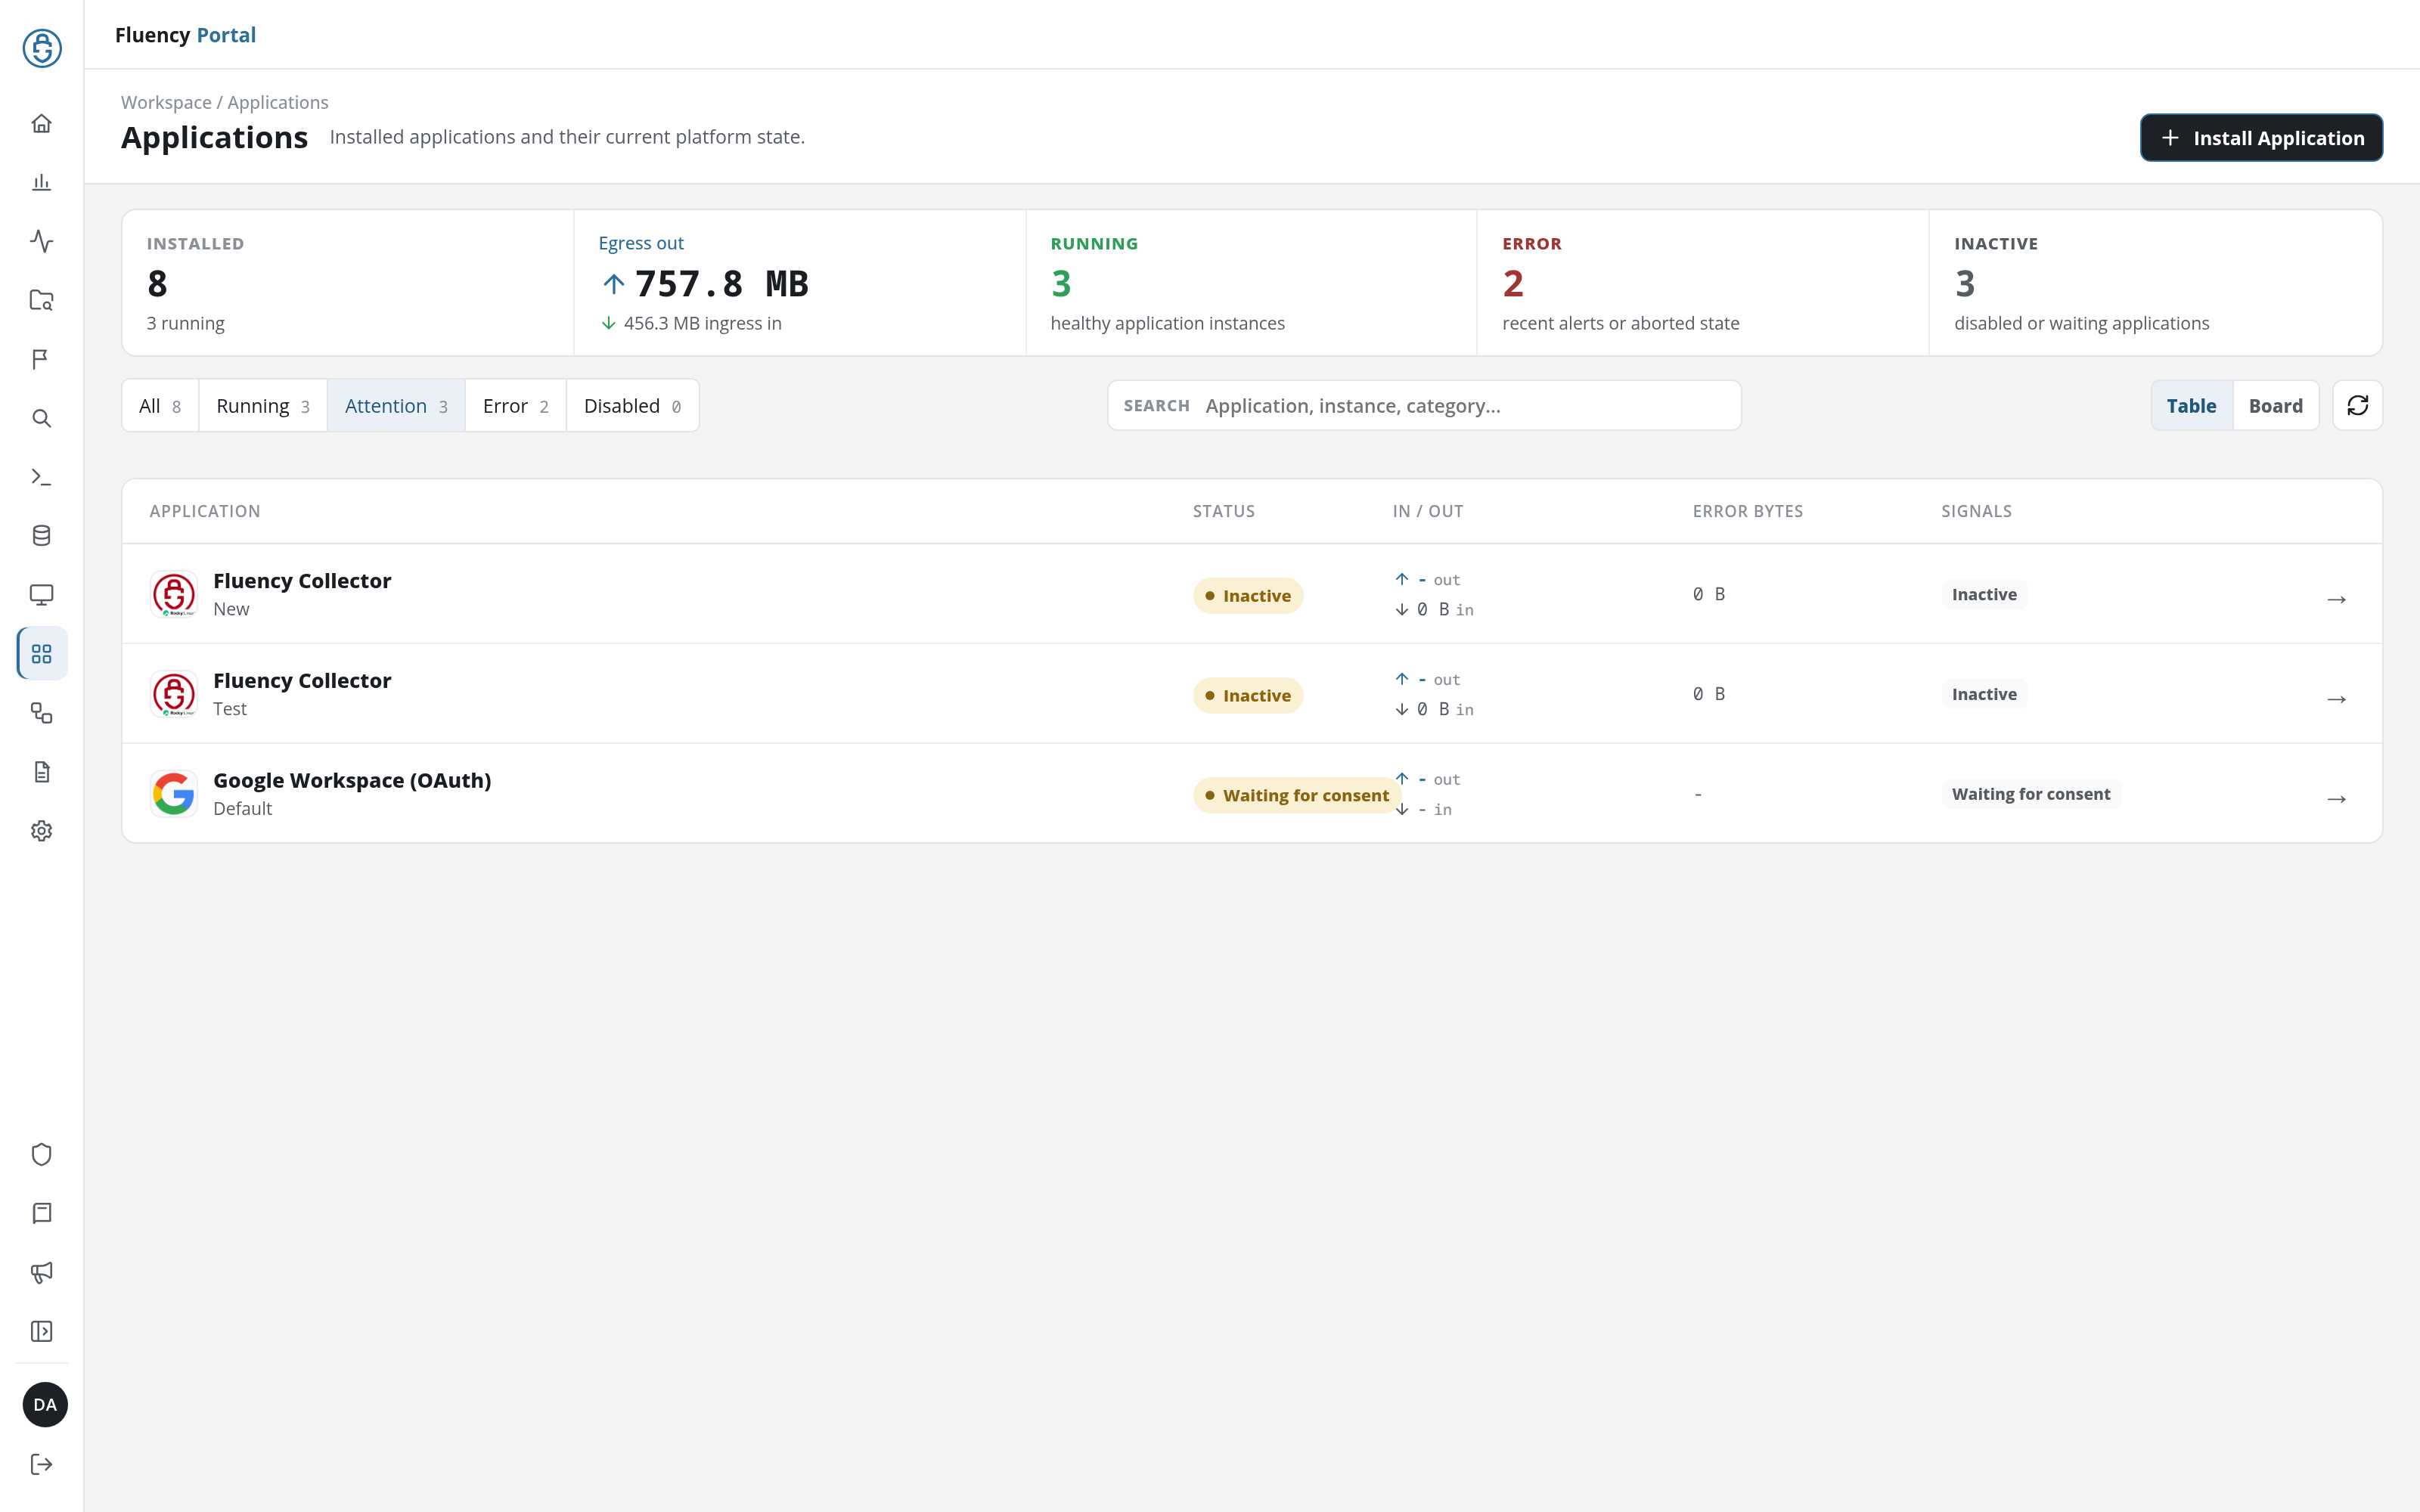
A filter that matches no application shows No applications match this filter.
Search
Type in the Search field (Application, instance, category…) to narrow the list to applications whose name, instance, or category matches.
Table View
Table is the default view. Each row is one application instance:
- Application: the application's icon and name, with the instance's display name beneath it (for example Fluency Collector / New).
- Status: a colored badge: green Running, amber Inactive or Waiting for consent, or red Error. An application installed a moment ago shows a grey Other until it reports its first state.
- In / Out: the data received (in) and sent (out), with a dash when there is none.
- Error Bytes: the bytes the application reported as errors.
- Signals: for a running application, a strip of activity bars and how long ago it last reported (for example 0s ago); otherwise its state.
- An arrow (→) at the right end of the row.
Click a row to open that application's details.
Board View
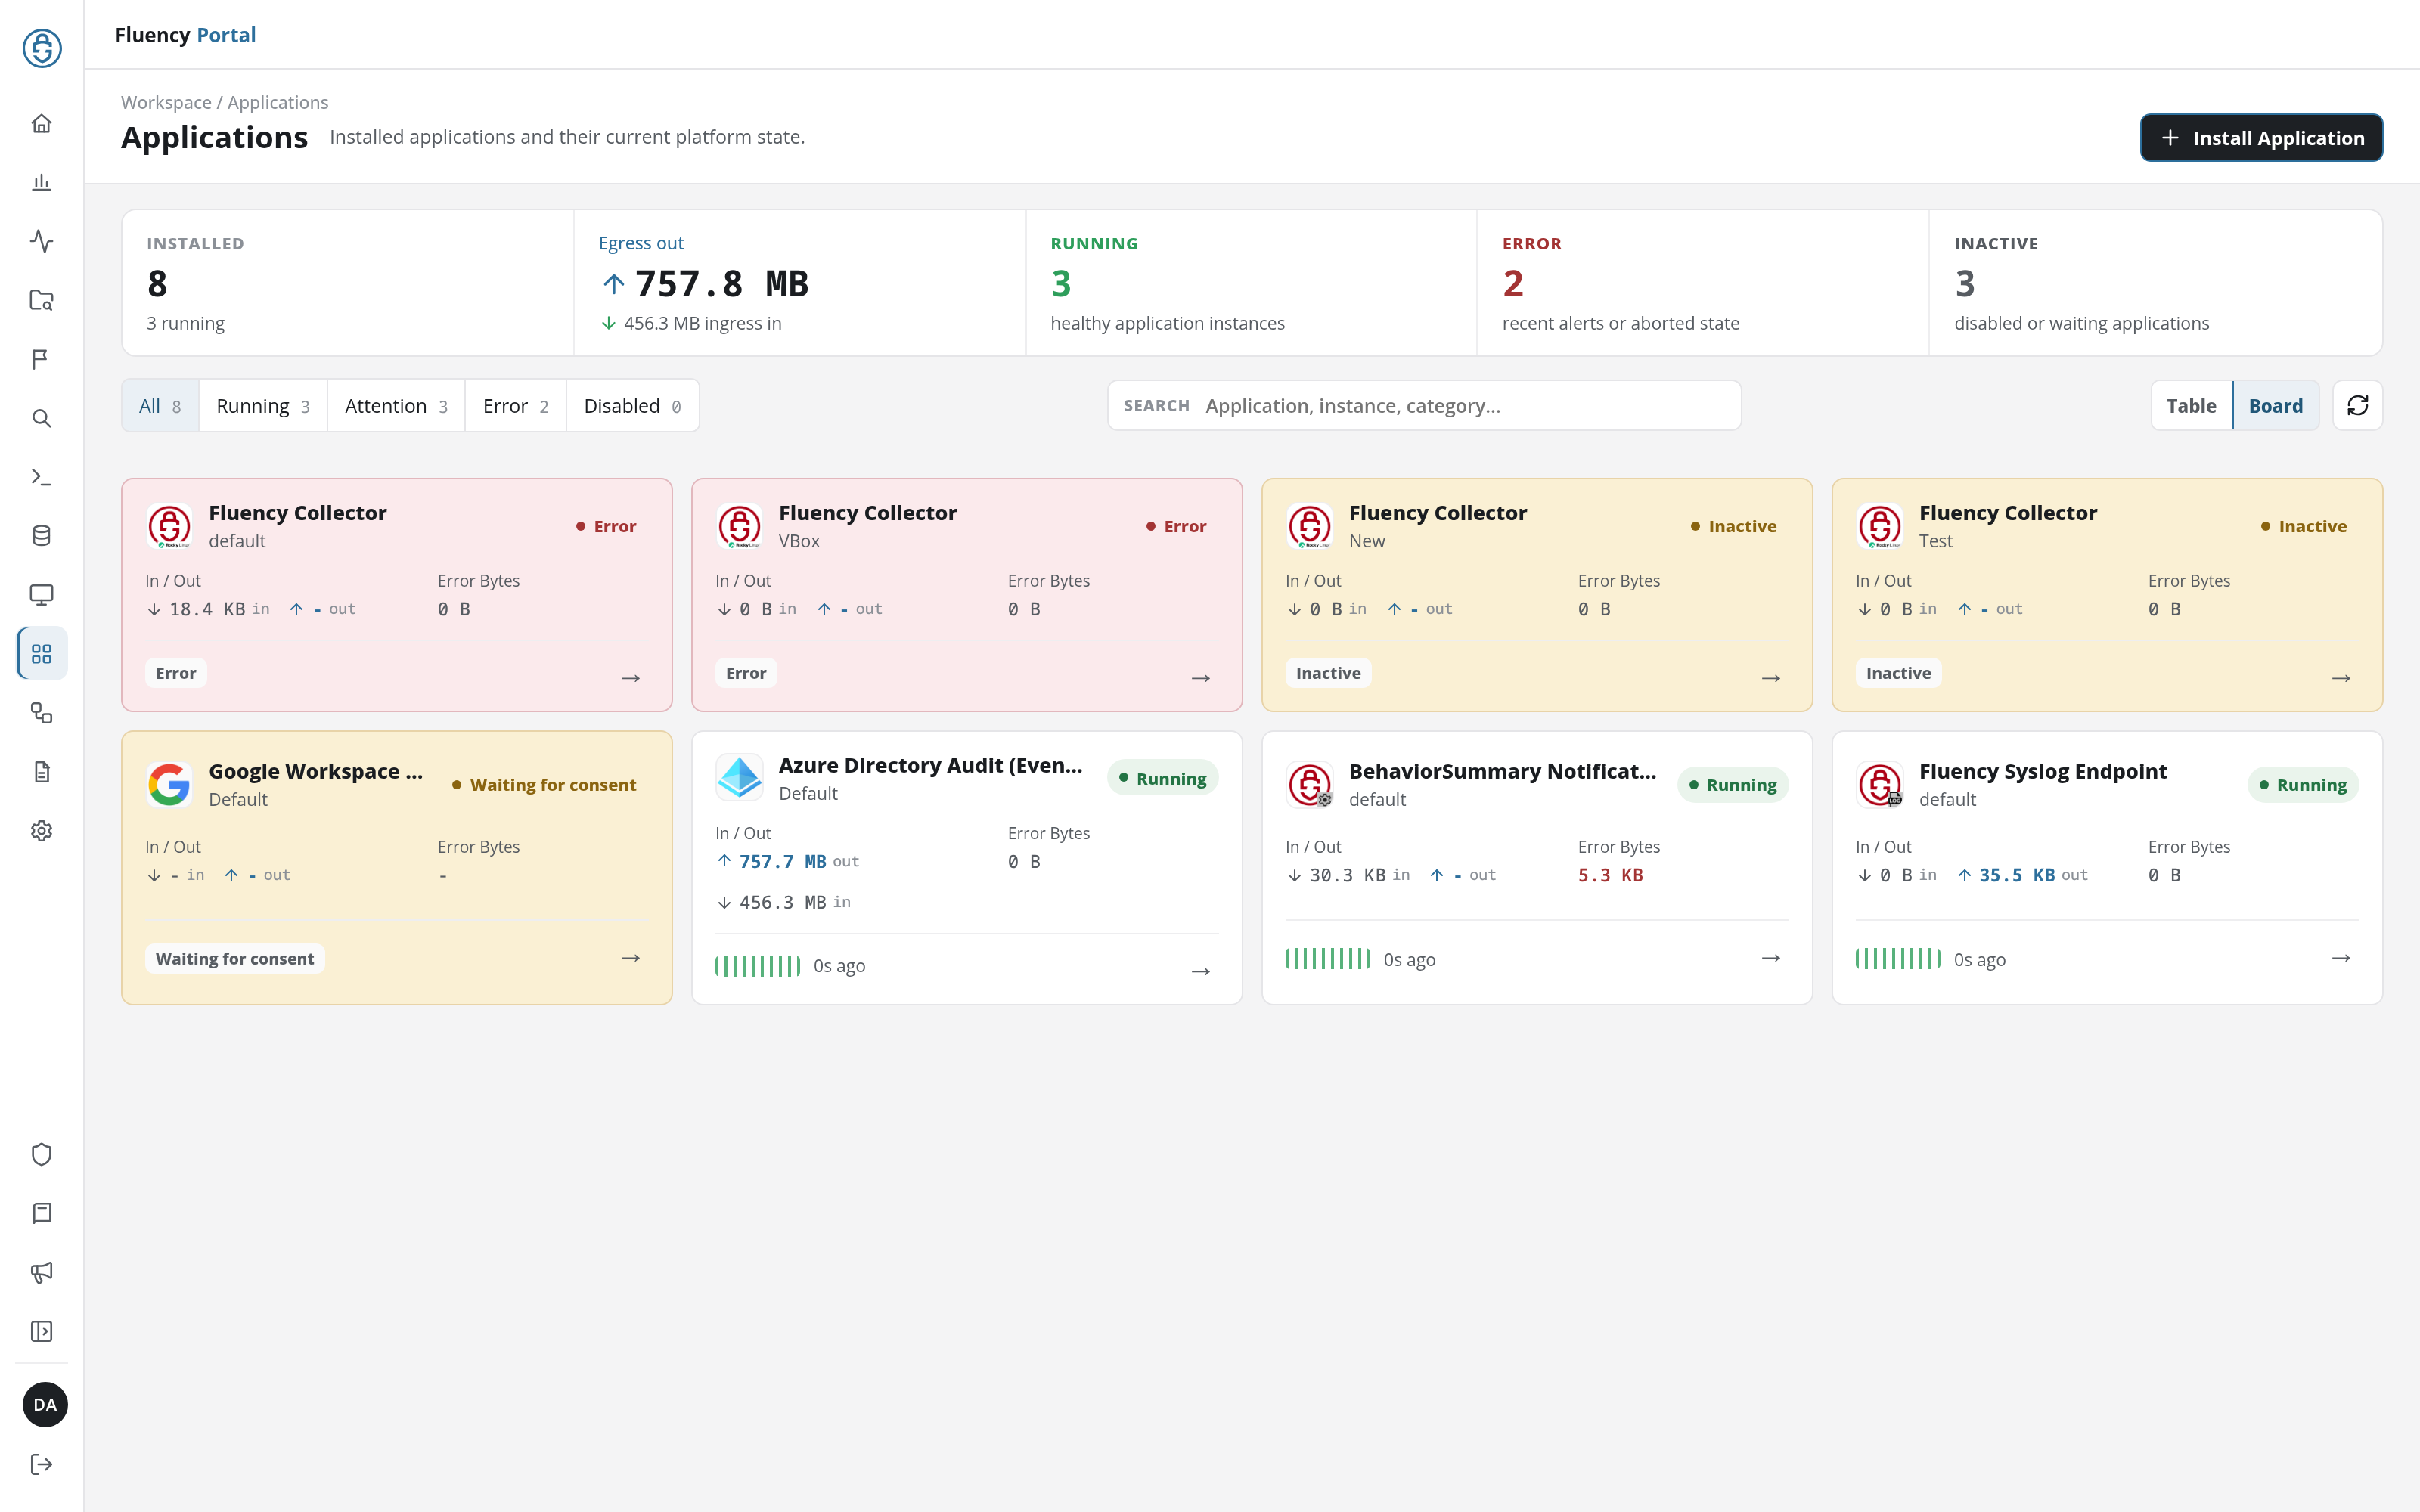
Board shows the same applications as a grid of cards. Each card carries the application's icon, name, instance, and status badge; its In / Out and Error Bytes; and, along the bottom, its signal strip or state and an arrow that opens its details. Cards of applications that need attention have an amber background, and cards of applications in error a red one.
Refresh Applications
The circular-arrow button at the right end of the toolbar (Refresh applications) reloads the list and the counters.
In this section
- Application Catalog: the templates you install applications from, and the install form behind each one.
- Application Details: one installed application's state, pipeline, parameters, and the actions its installation performed.