Cases Search
The Cases Search page is a faceted search across the account's case summaries. Type a search, pick a time range, and narrow the results with the filters on the left; the table on the right lists the matching cases.
Menu path: Cases Search · URL path: /v2/cases-search
Page Layout
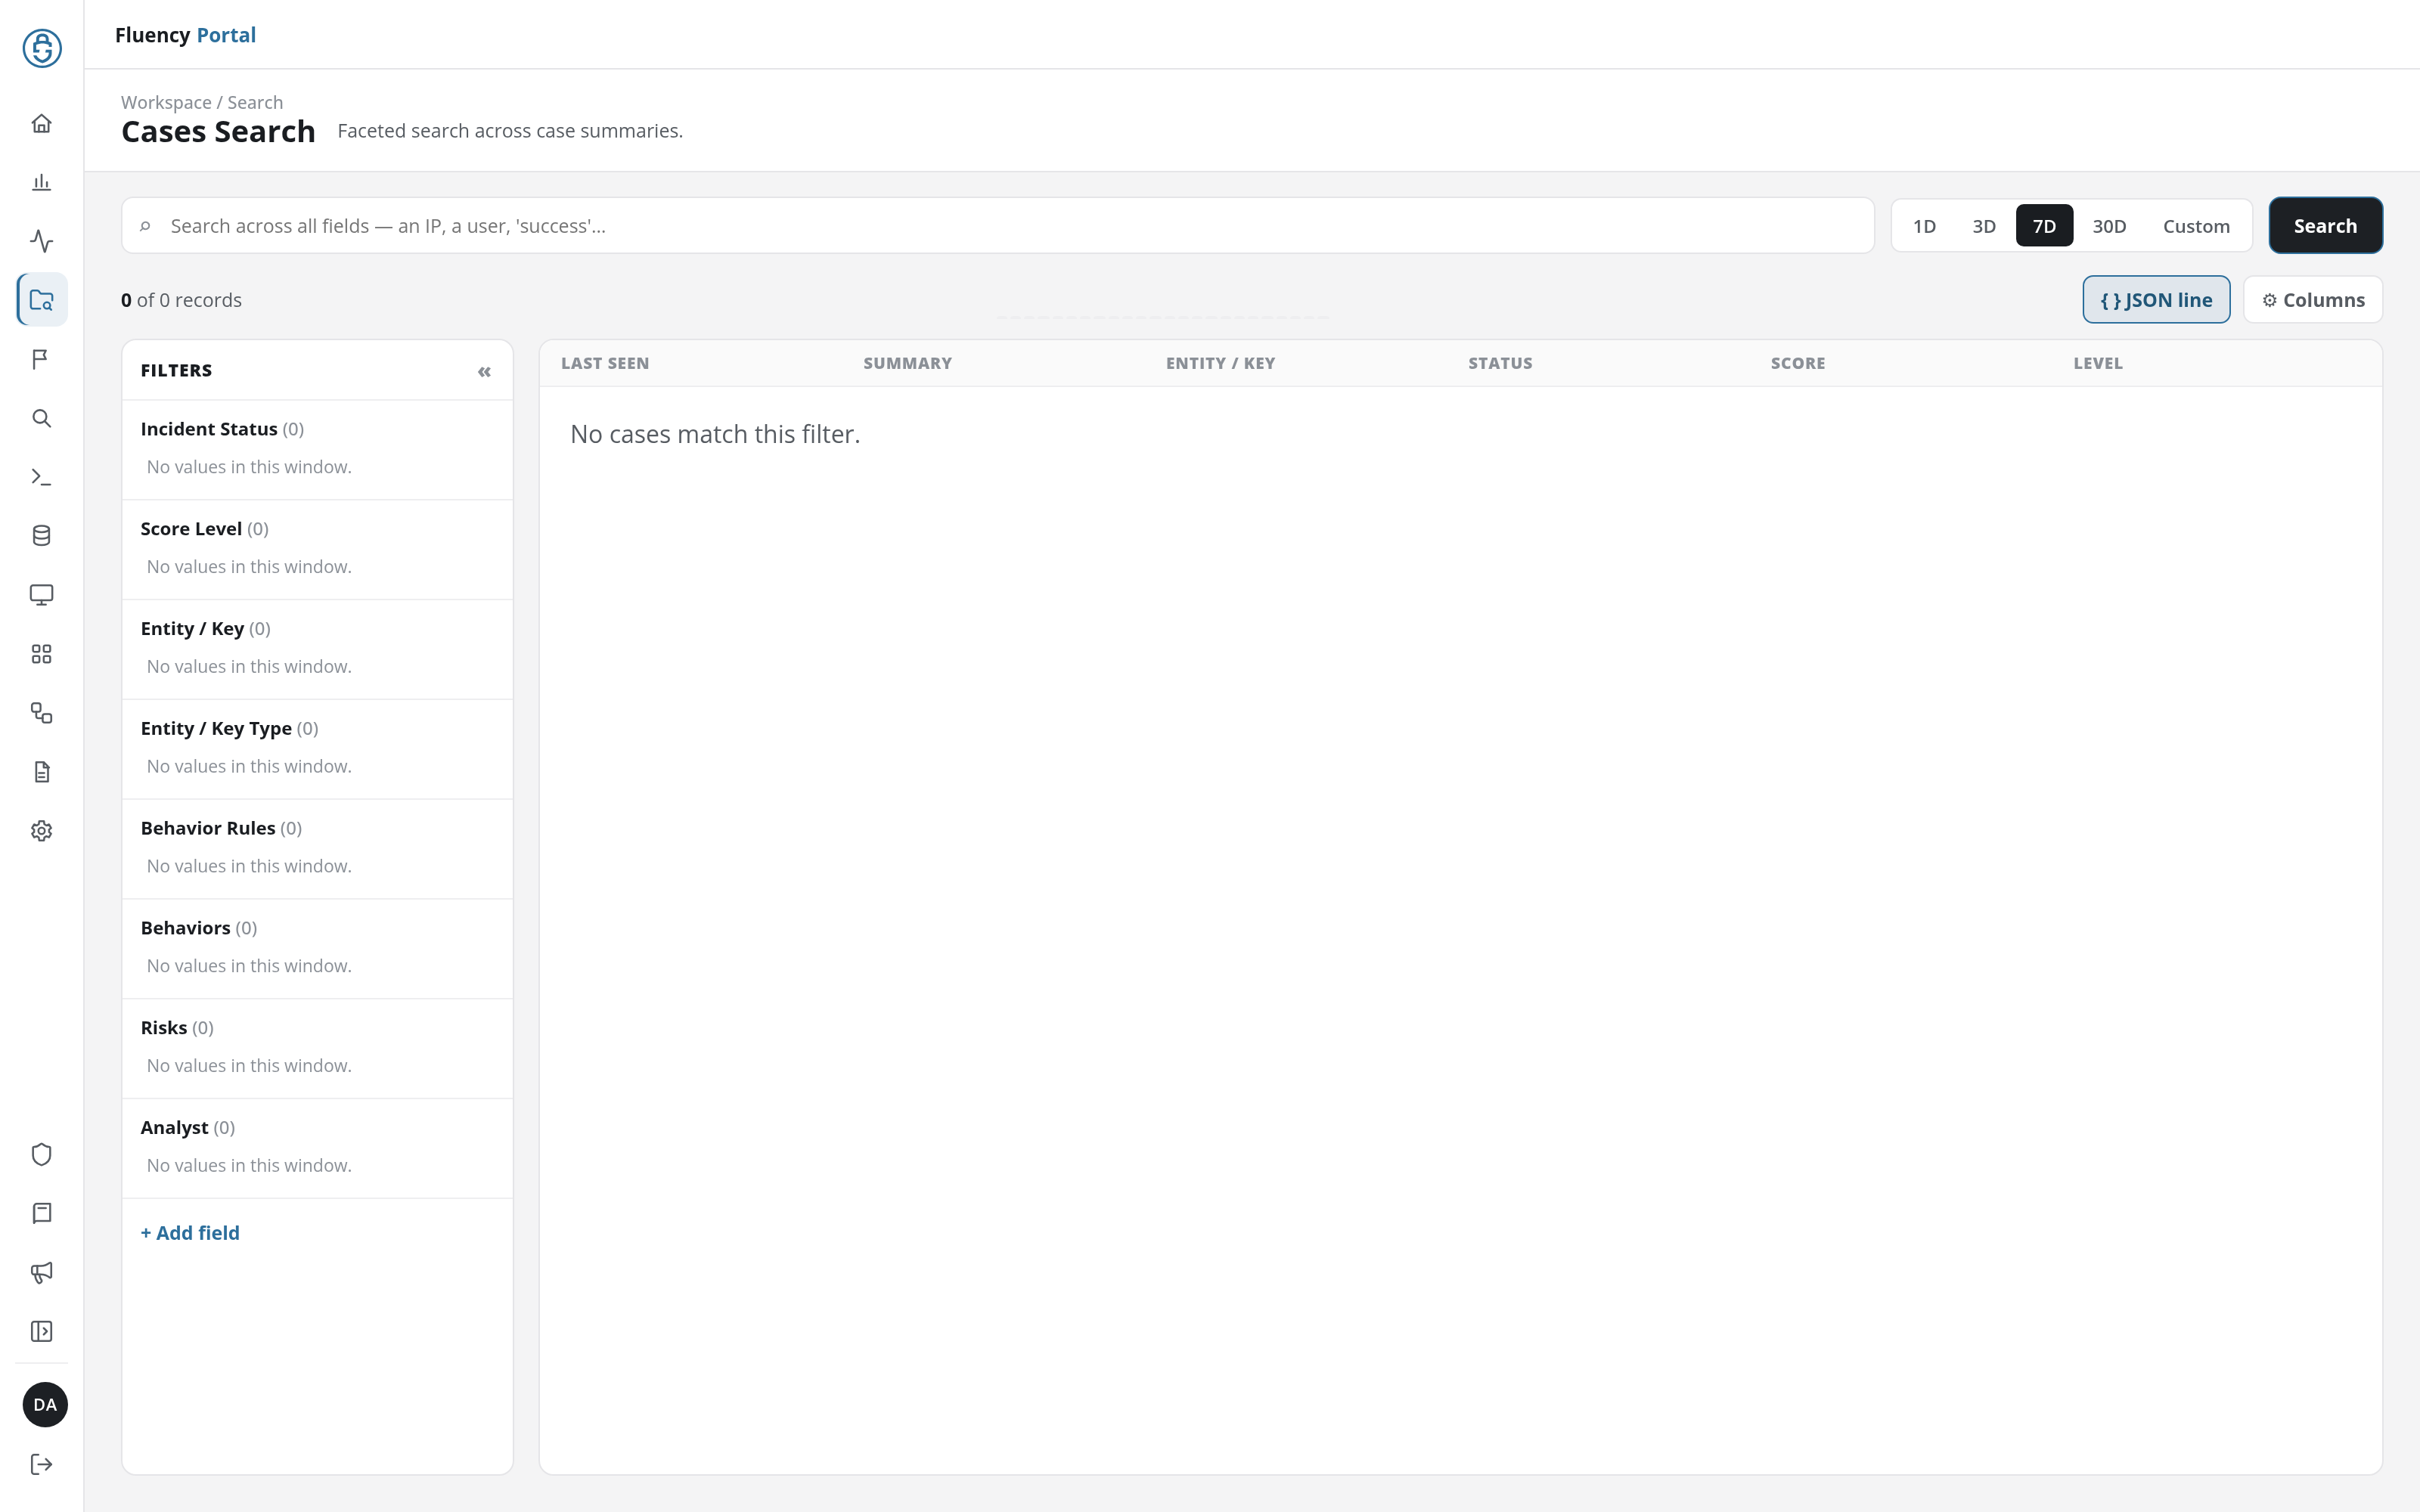
The header shows the breadcrumb Workspace / Search, the title Cases Search and the subtitle Faceted search across case summaries. Below it:
- Search bar: the search field, the time-range buttons, and Search.
- Result bar: the record count on the left, JSON line and ⚙ Columns on the right. Once a filter value is chosen, a row of filter chips follows it.
- Risk score chart: when the search has results, a Risk Score Over Time chart across the full width.
- Filters panel (left): facet groups for narrowing the results.
- Results table (right): the matching cases.
Notable Events has the same layout, for notable behavior events instead of cases.
Search Bar
- Search field: free text matched across all fields (Search across all fields – an IP, a user, 'success'…).
- Time range: 1D, 3D, 7D, 30D and Custom. The selected range is filled in black; the page opens on 7D.
- Search: runs the search with the current text, range and filters.
Custom Range
Click Custom to pick the dates yourself. Two date fields appear between the range buttons and Search: Start date (UTC), and, after the arrow, End date (UTC).
Result Bar
- Record count: N of M records: the cases shown out of those that match.
- JSON line: a toggle that adds each case's JSON, on one line, below its row in the table, highlighted while on. It is on when the page is first opened in a browser; the browser remembers the choice, which applies to Notable Events and Behavior Rules as well.
- ⚙ Columns: opens the column chooser.
When the search has results, a small histogram also appears in the middle of the bar.
Risk Score Over Time
When the search has results, a RISK SCORE OVER TIME chart sits between the result bar and the filters and table. Its heading gives the number of cases drawn (n events plotted). Each case is a dot, placed by its time along the horizontal axis, which spans the selected range, and by its risk score on the vertical axis.
Filters
The FILTERS panel holds one group per facet, each with the number of values found in the selected range after its name:
- Incident Status
- Score Level
- Entity / Key
- Entity / Key Type
- Behavior Rules
- Behaviors
- Risks
- Analyst
A group with nothing to offer in the range reads No values in this window.
The « button in the panel's upper-right corner collapses the panel to a narrow strip labelled FILTERS, giving the table the full width; the strip's » button opens the panel again. While filters are in force, the strip counts them (» FILTERS 1).
Selecting Values
Each group lists the values found in the range, each with its number of cases. A value cycles through three states as you click it:
- Included: the first click keeps only the cases that have the value. The value is ticked (✓), and a chip such as Incident Status: new × appears below the result bar, followed by Clear all.
- Excluded: a second click keeps only the cases that do not have it. The value is marked −, and its chip reads NOT Incident Status: new.
- Not used: a third click drops the value from the filter.
A chip's × removes that one filter, and Clear all removes them all. The search runs again after every change.
Linking to a Search
The search, the time range and the filters are kept in the URL, so a filtered search can be bookmarked or shared:
q=for the search text.range=1D,range=3Dorrange=30Dfor a preset range; the default 7D adds nothing.from=<ms>&to=<ms>for a Custom range, in epoch milliseconds.must=andnot=for the included and excluded values, each a URL-encoded JSON object of field names and values: for example/v2/cases-search?range=30D&must={"status":["new"]}.
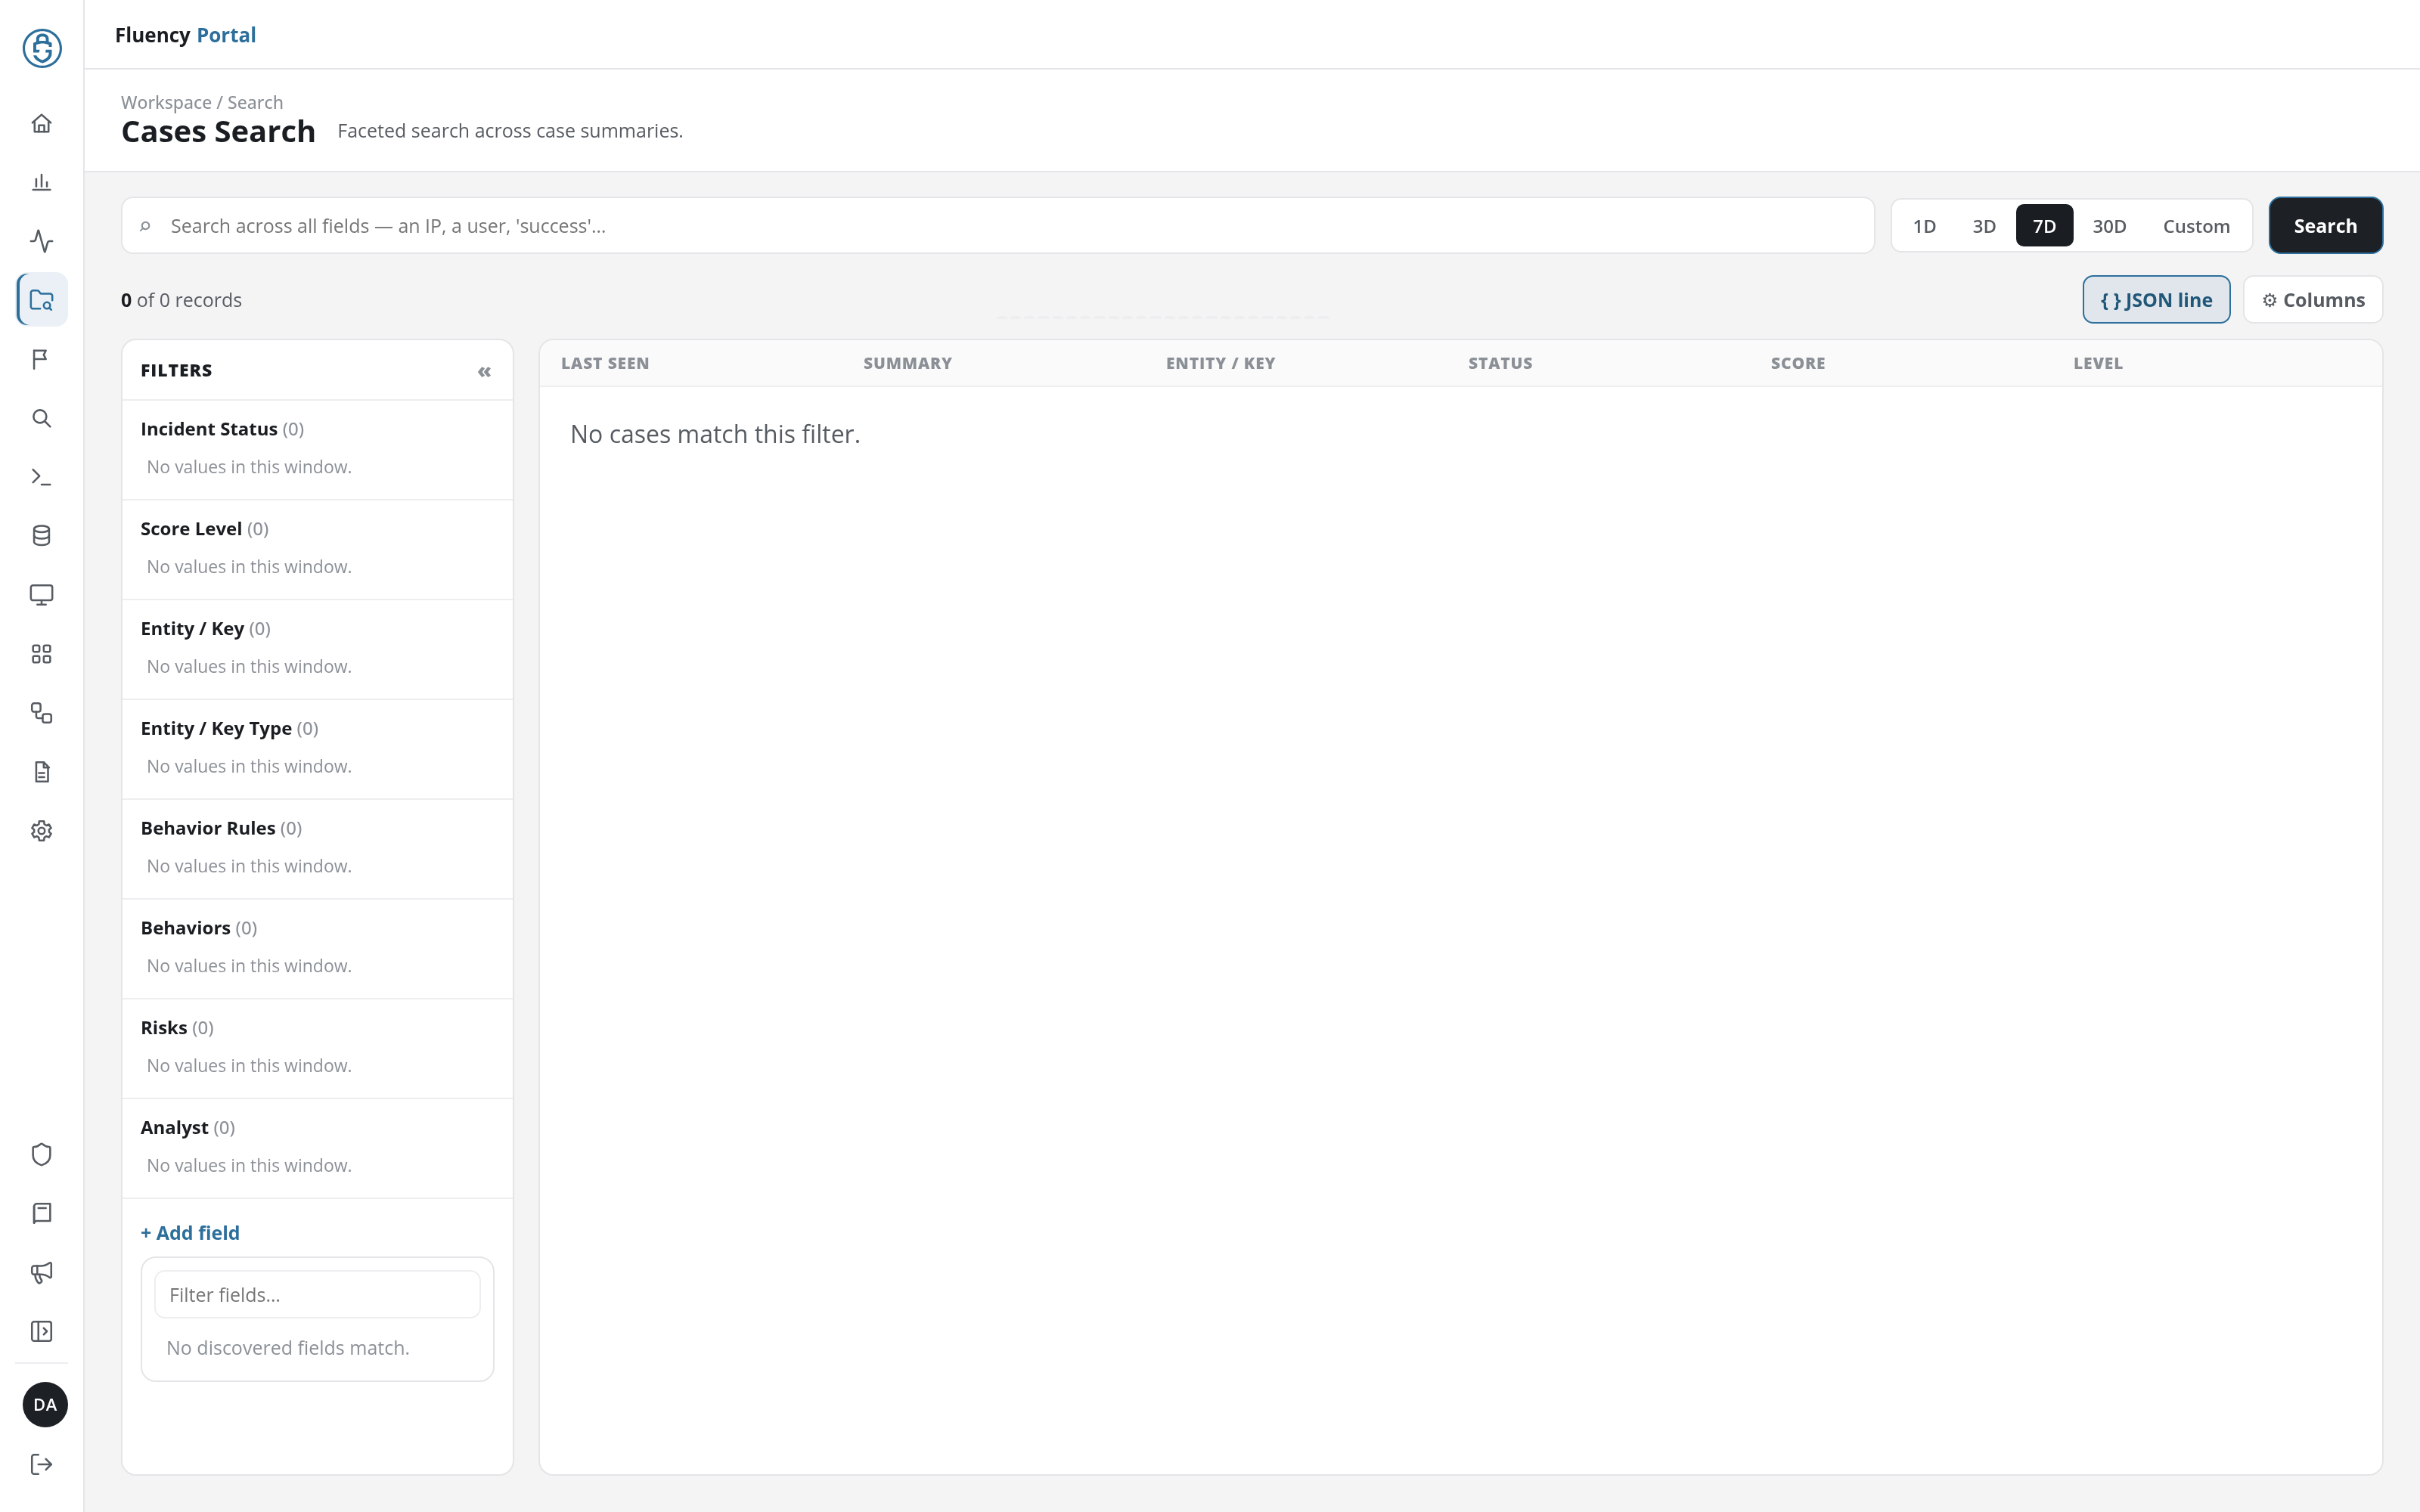
Add Field
+ Add field at the bottom of the panel adds a facet group for another field. It opens a Filter fields… box above a list of the fields found in the results; type to narrow the list. When the results hold no fields to offer, the list reads No discovered fields match.
Columns
⚙ Columns opens a checklist of the columns the results table can show. Tick or untick an entry to add or remove that column; the table changes as you click.
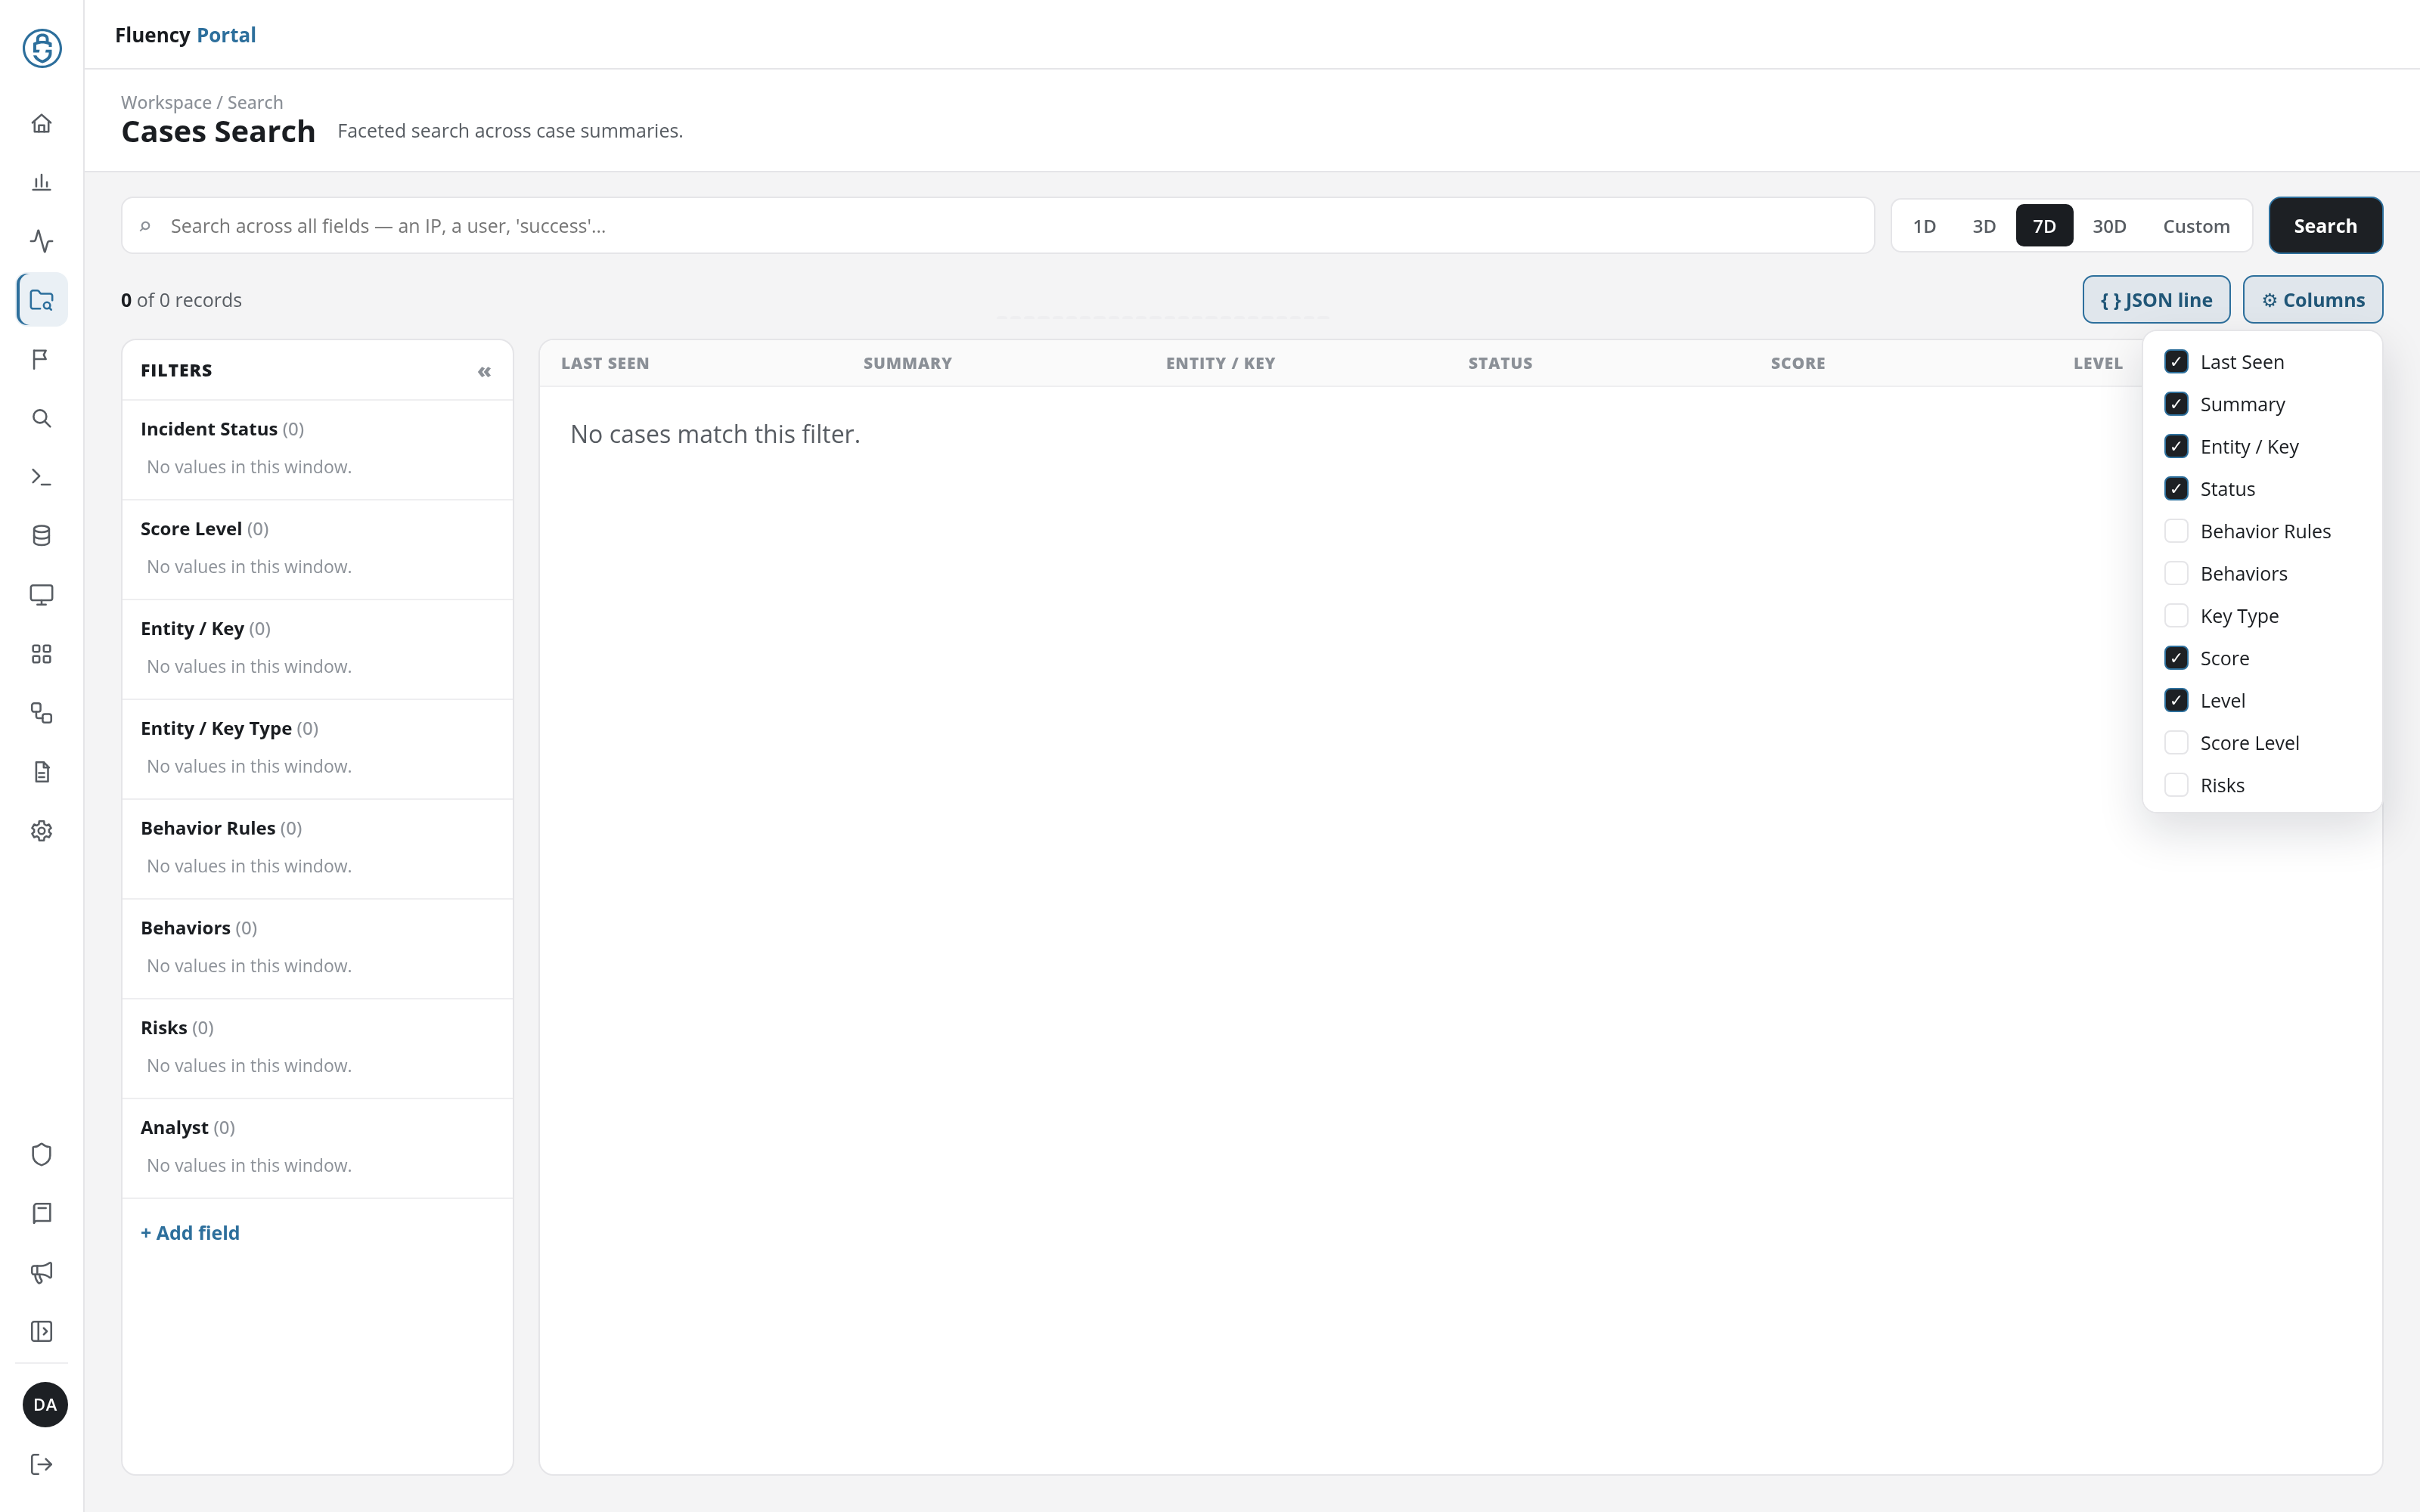
| Column | Shown by default |
|---|---|
| Last Seen | Yes |
| Summary | Yes |
| Entity / Key | Yes |
| Status | Yes |
| Behavior Rules | No |
| Behaviors | No |
| Key Type | No |
| Score | Yes |
| Level | Yes |
| Score Level | No |
| Risks | No |
| Customer | No |
Results Table
The table lists the matching cases in the chosen columns; cases with a risk score of zero are not listed. A case below the notification threshold has no status, shown as a dash. Click a case to open its detail panel. When nothing matches, the table reads No cases match this filter.
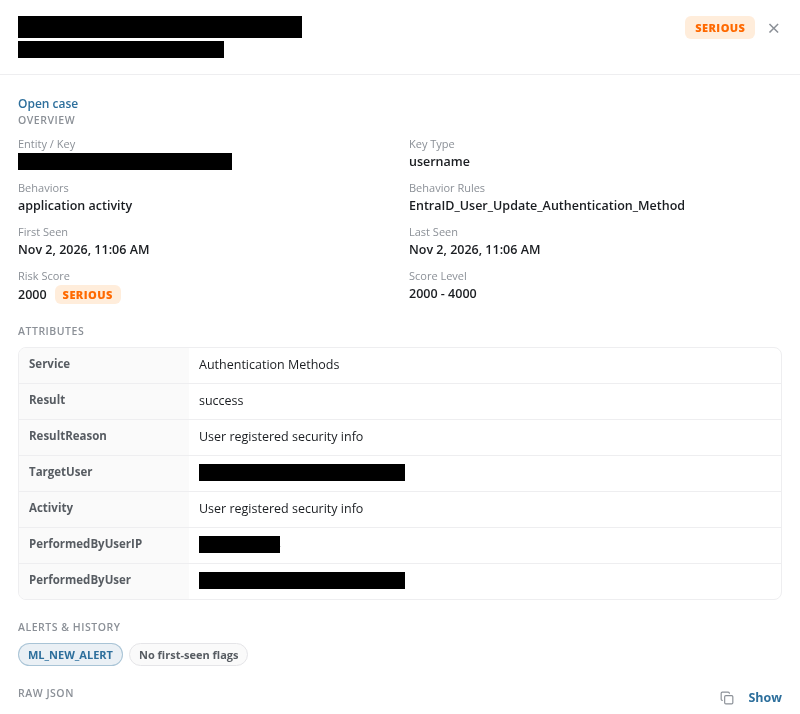
Case Detail Panel
The panel slides in over the right of the page. Its header gives the case's entity and its severity as a badge, with the × that closes the panel. Below:
- Open case: a link that opens the case on Behavior Summary, for its entity and day (
/v2/behavior-summary?dayIndex=<YYYYMMDD>&id=%22<entity>%22). - OVERVIEW: Entity / Key, Key Type, Behaviors, Behavior Rules, First Seen, Last Seen, Risk Score (with its severity badge), and Score Level.
- ATTRIBUTES: the fields recorded for the case, each with its value.
- ALERTS & HISTORY: the alerts raised, as chips (such as ML_NEW_ALERT), and the case's first-seen flags (No first-seen flags when there are none).
- RAW JSON: the case's JSON record, collapsed, with Show and a copy button (Copy JSON).