Datalake Search
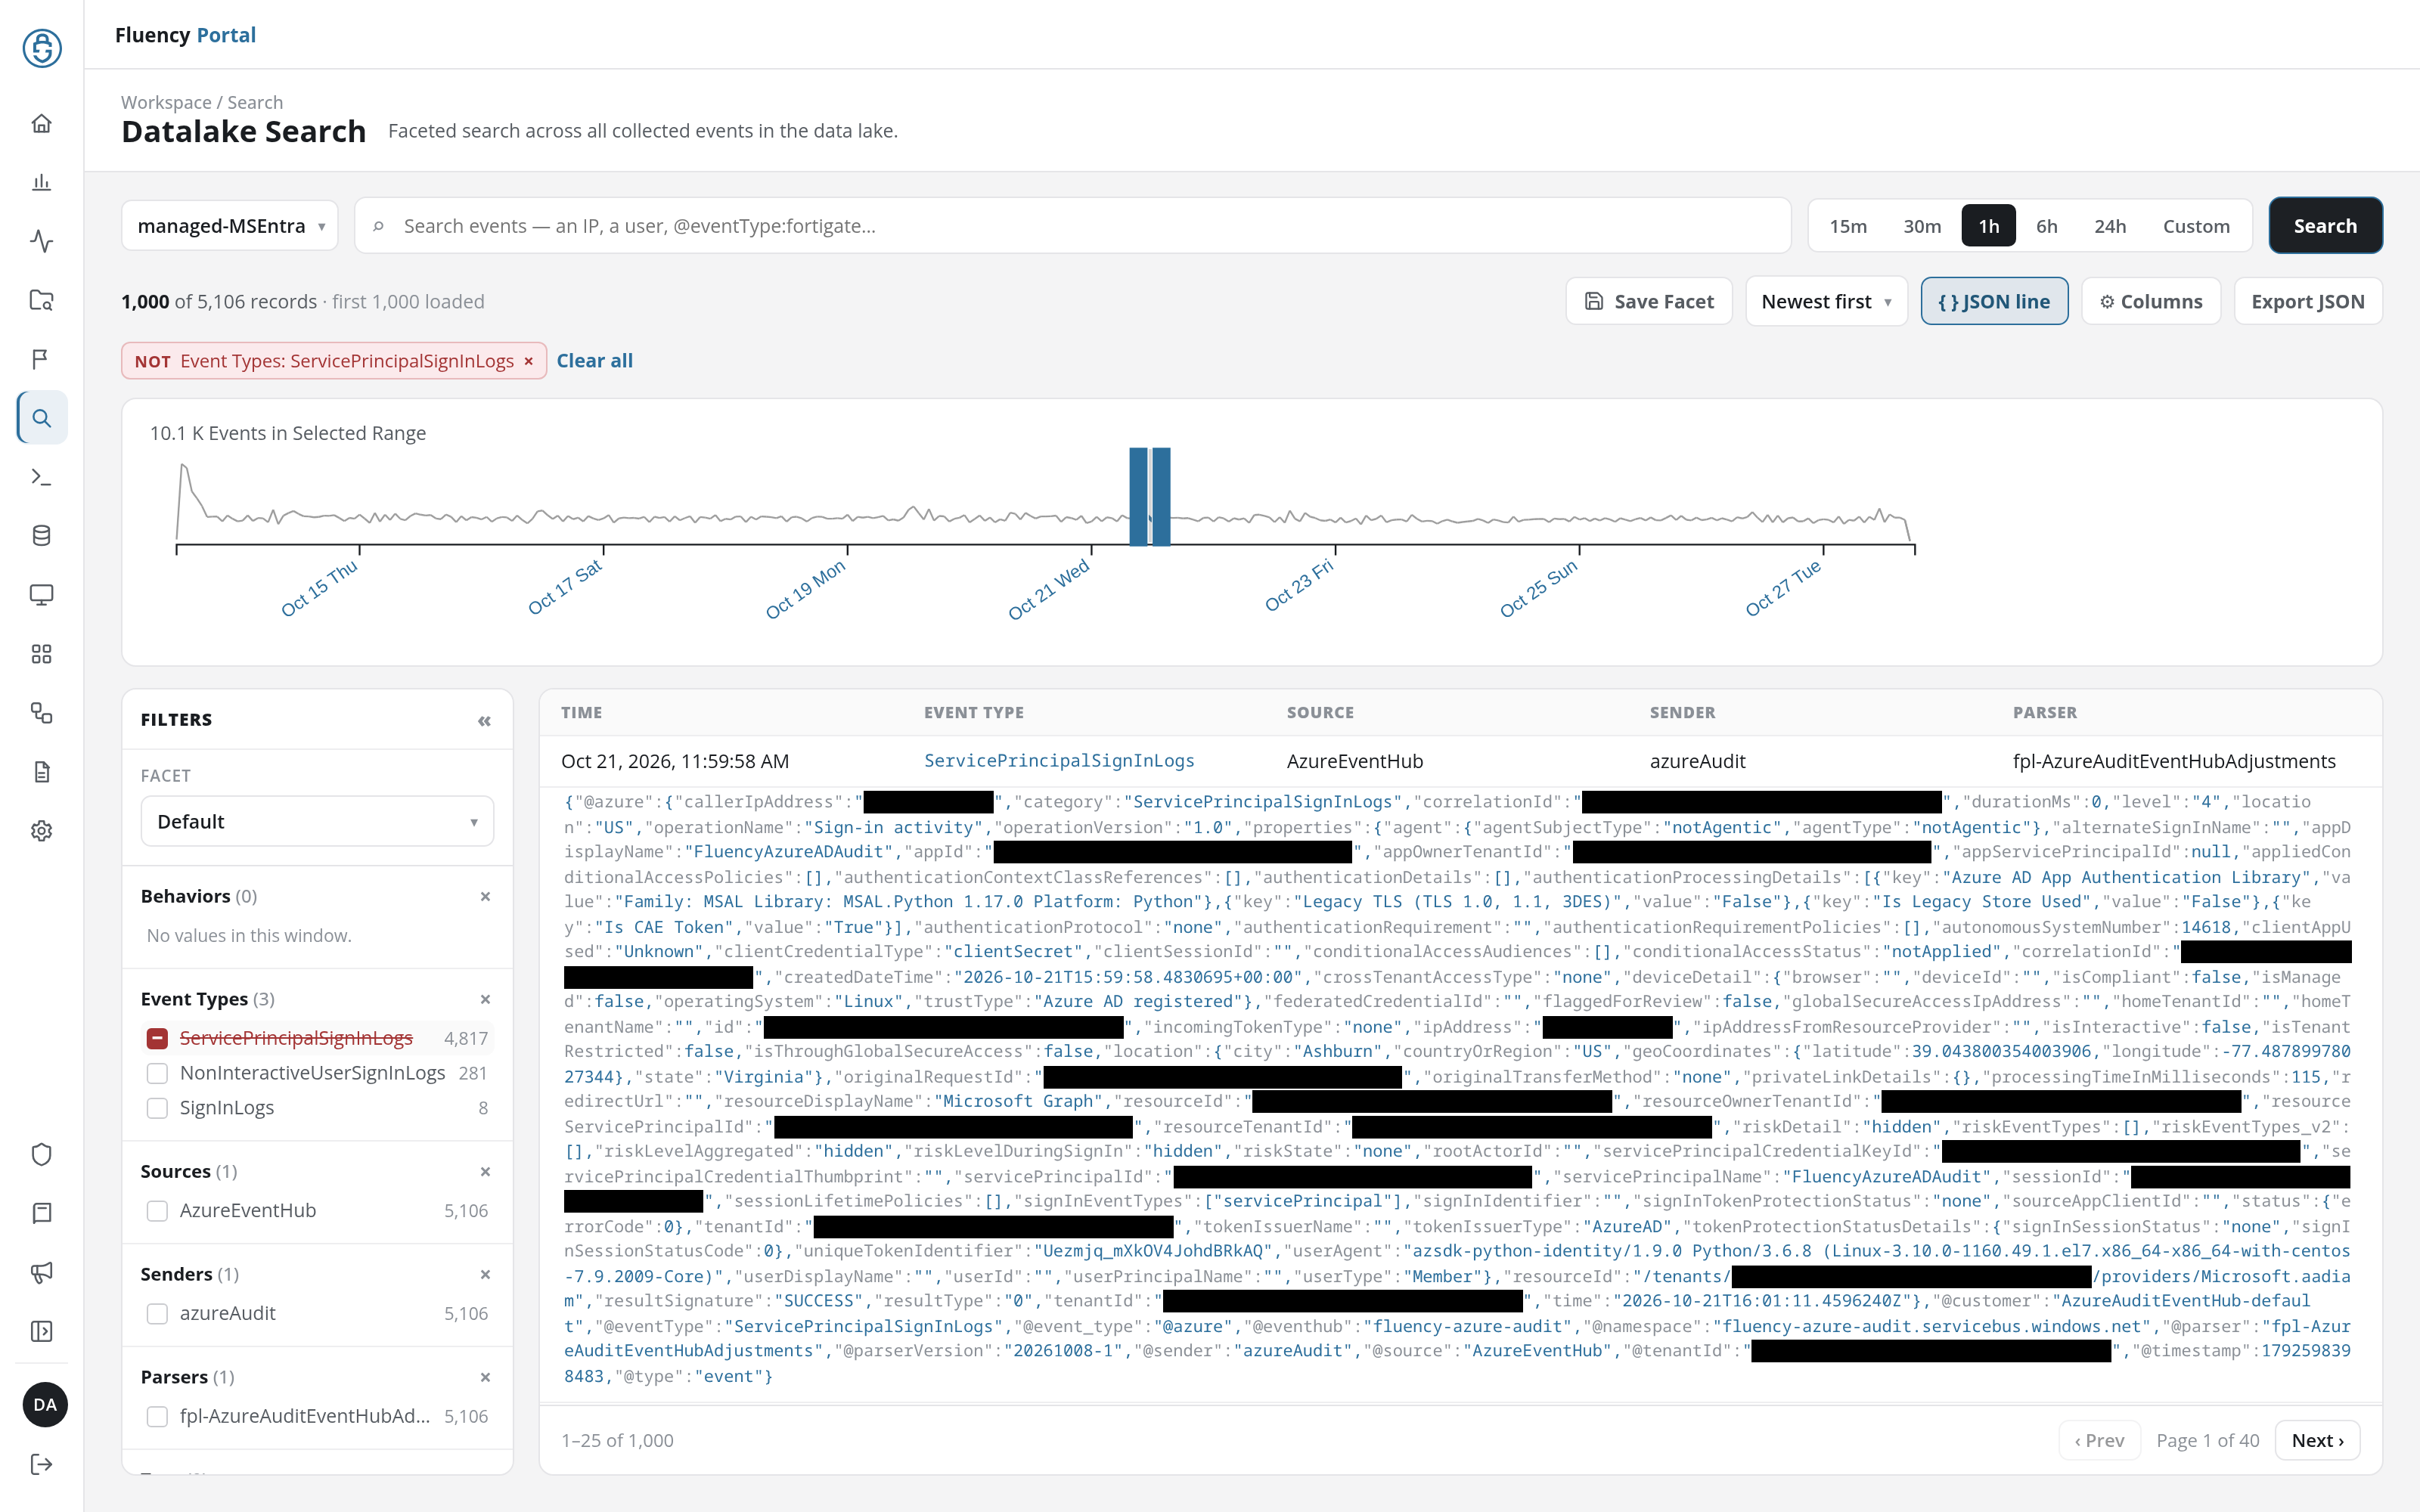
The Datalake Search page searches the events collected into the data lake. You pick an index and a time range, optionally type a search, and press Search; the page then lists the matching events, counts the values of key fields in the Filters panel, and opens any event in a detail panel. The page's subtitle reads Faceted search across all collected events in the data lake.
Menu path: Datalake Search · URL path: /v2/events
Task guide: Events Search: searching stored events as a task.
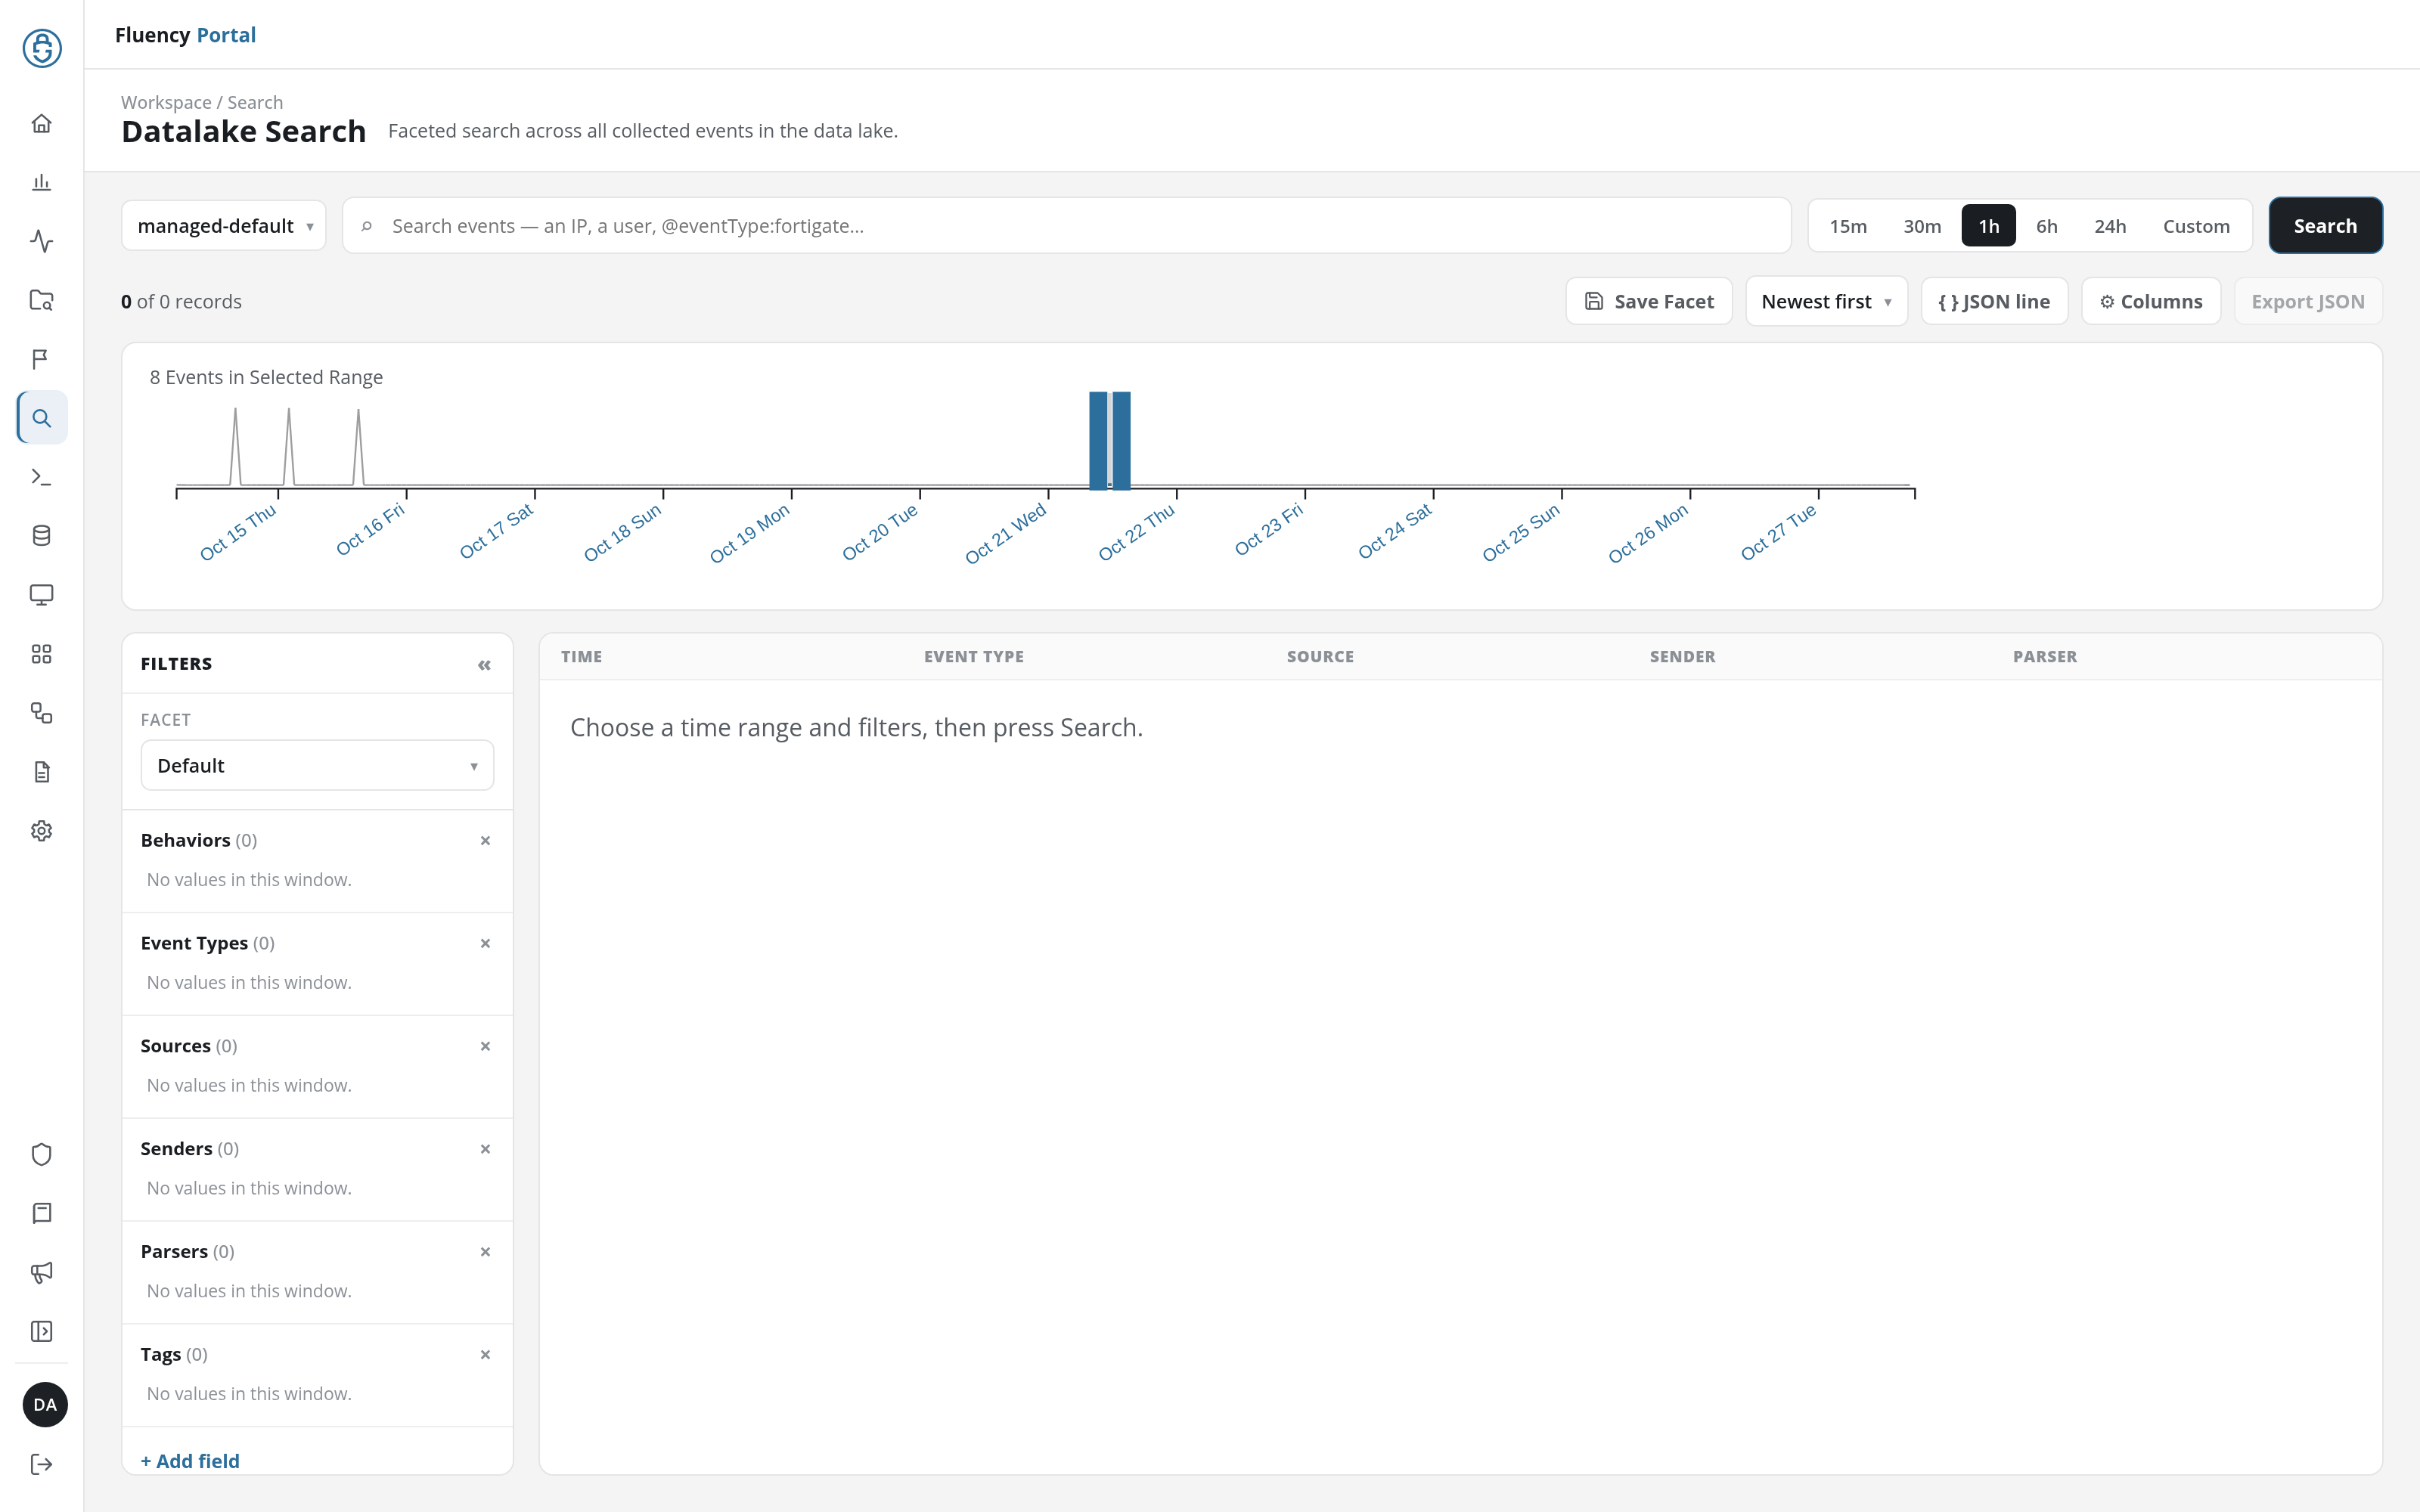
Page Layout
From top to bottom:
- Search bar: the Data lake index selector, the search box, the time-range buttons, and Search.
- Toolbar: the record count on the left; Save Facet, the sort order, JSON line, Columns, and Export JSON on the right. Active filters appear as chips below it.
- Histogram: the event count over time for the selected index.
- Filters panel (left): the saved search facet in use and its field groups, each listing the values found in the results.
- Result table (right): one row per event, paged.
Until a search runs, the result table reads Choose a time range and filters, then press Search., the record count is 0 of 0 records, and Export JSON is disabled.
Search Bar
Data Lake Index
The drop-down at the left of the search bar chooses the data lake index to search. Each index is named after its data lake and index: managed-MSEntra is the MSEntra index of the managed lake. The page opens on managed-default. Only indexes that use the standard event layout are listed; an index with typed columns of its own, such as AzureSigninLogs, is queried on KQL Search instead.
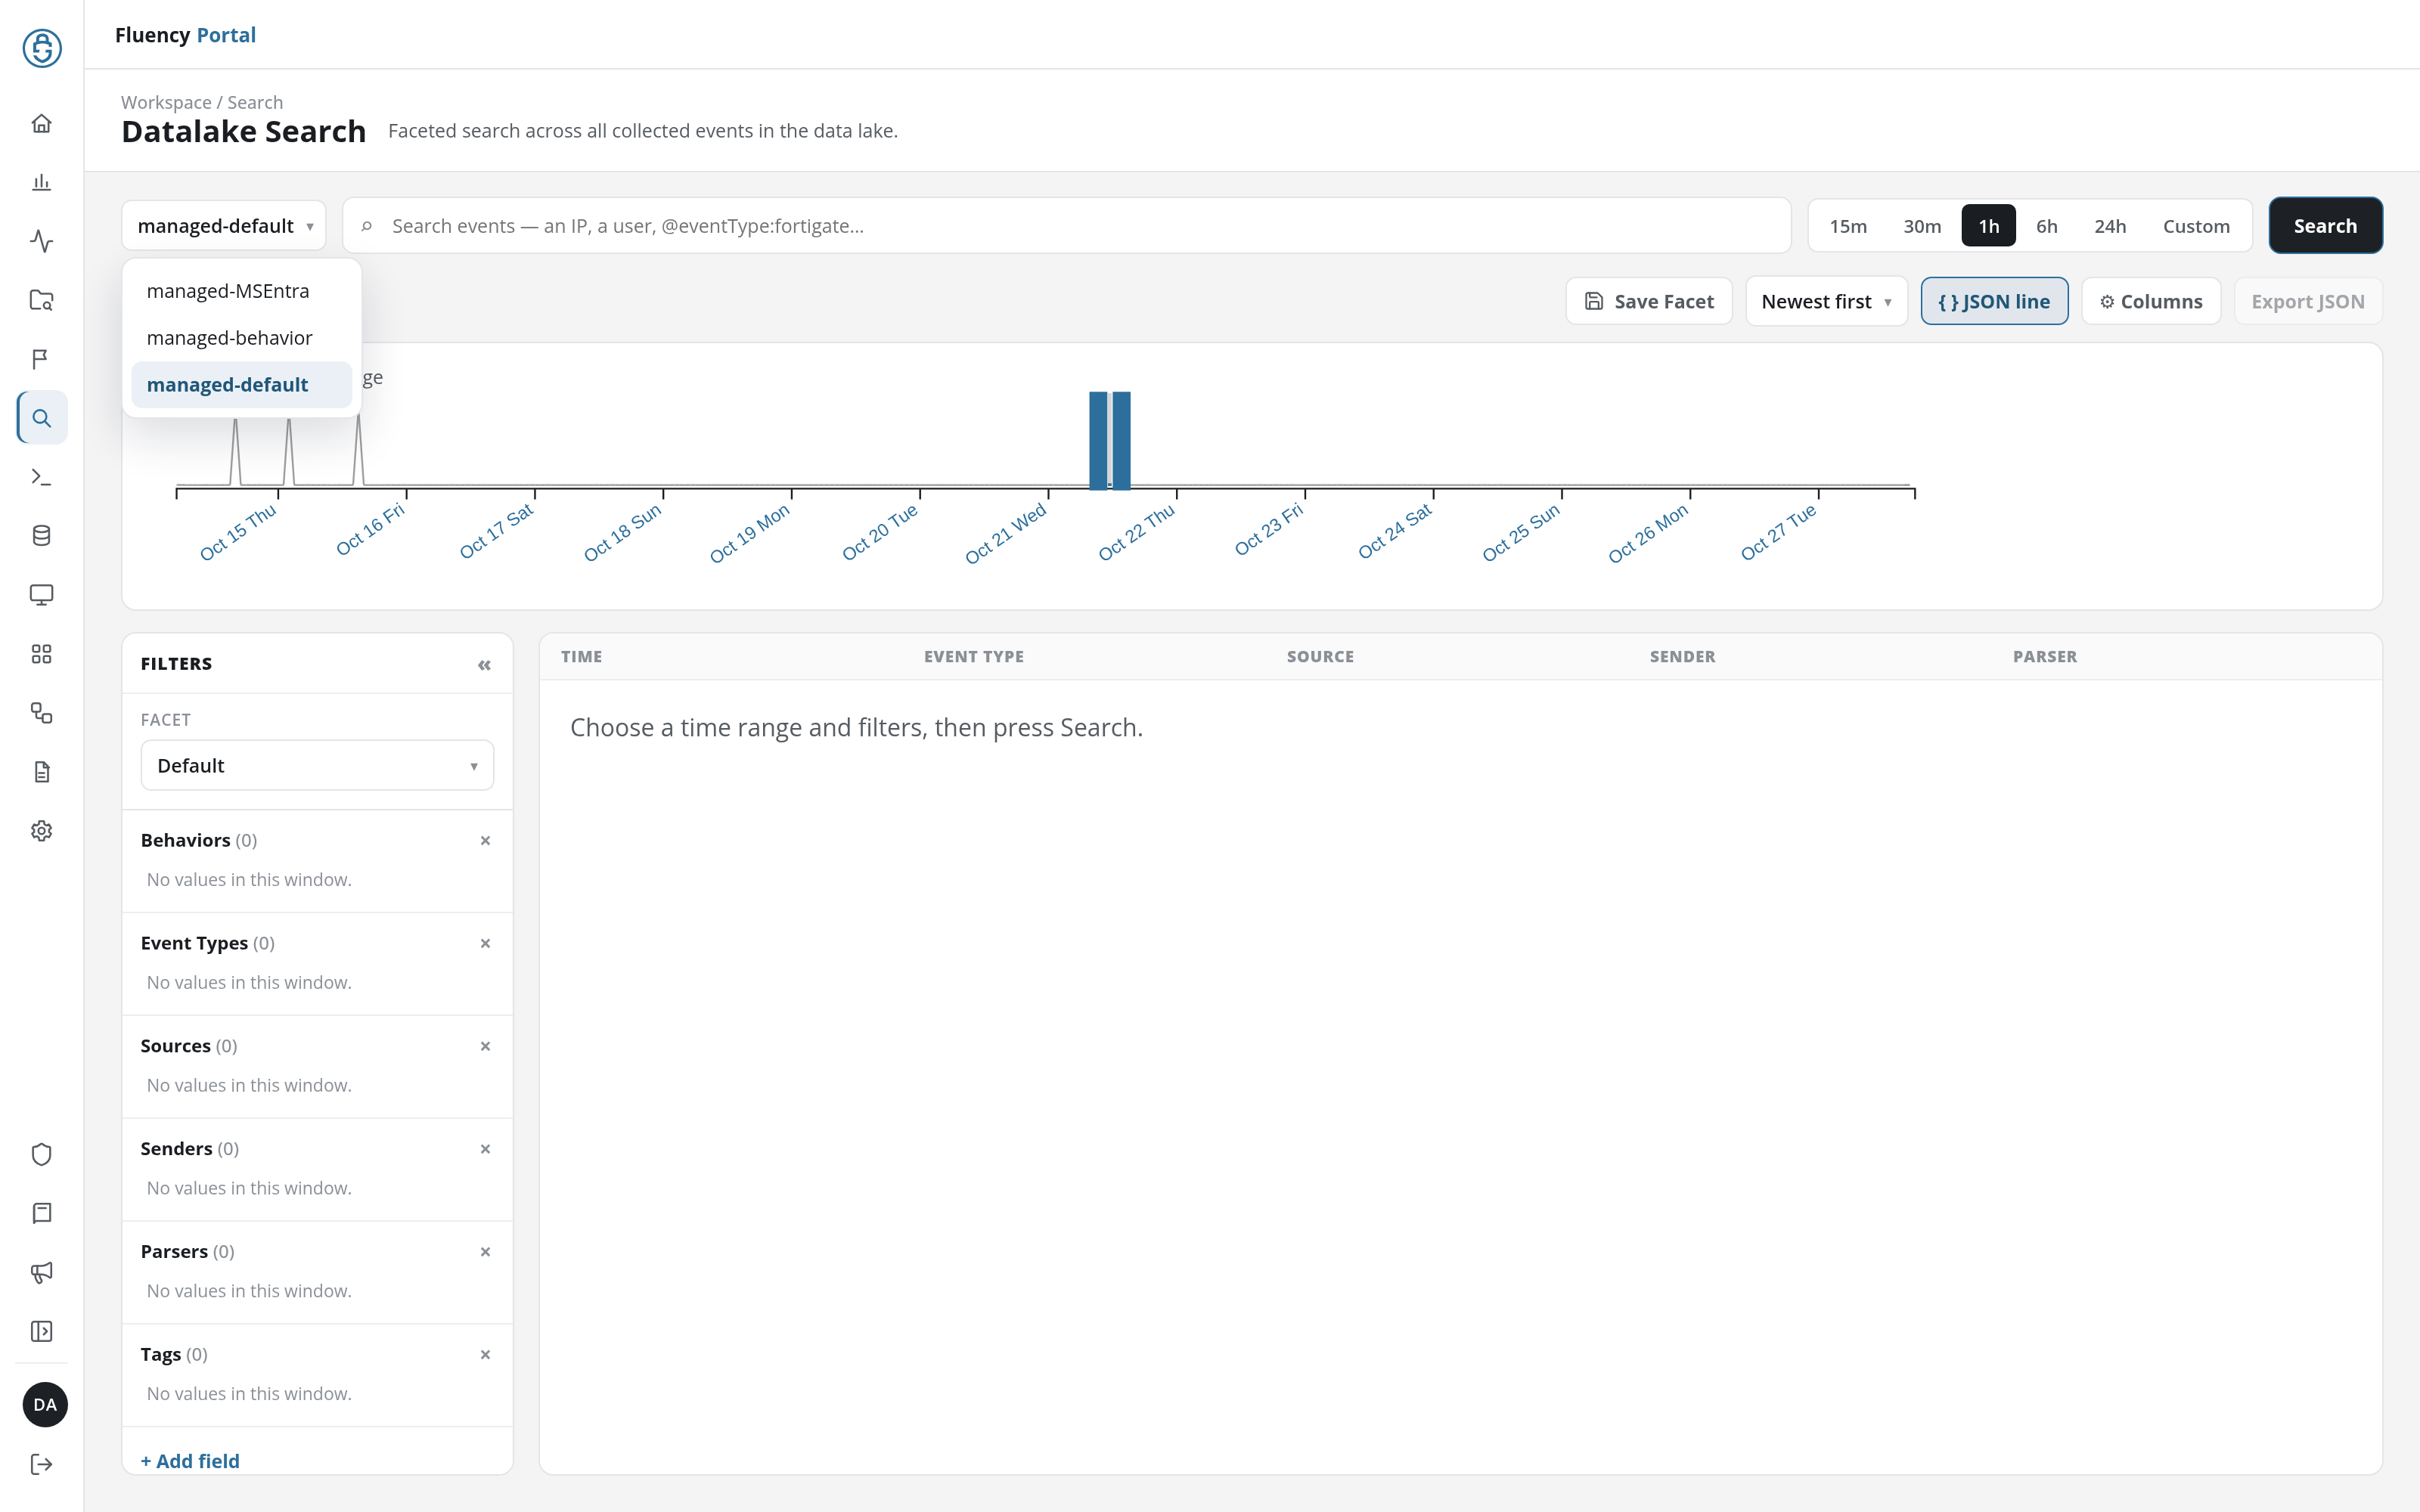
Choosing another index redraws the histogram for that index straight away; the results follow when you press Search.
Search Box
The search box takes the search terms. Its placeholder, Search events – an IP, a user, @eventType:fortigate…, shows the two forms it accepts: a bare value, matched anywhere in the event, and a @field:value term that matches one field. Leave it empty to list every event in the time range.
Time Range
The buttons beside the search box set the time range of the search: 15m, 30m, 1h, 6h, 24h, and Custom. The selected button is shown in black; the page opens on 1h.
Custom adds two date-and-time fields to the bar, Start time and End time, separated by → and filled in with the last hour to begin with. Edit either one to search any window.

Search
Search runs the search with the chosen index, search terms, time range, and filters. The page's URL then carries the index and the time range, so the address of a results page opens the same search again: a preset range is written as range=<preset> (/v2/events?range=24h&index=managed-default), the default 1h adds no range, and a Custom range is written as from=…&to=….
Toolbar
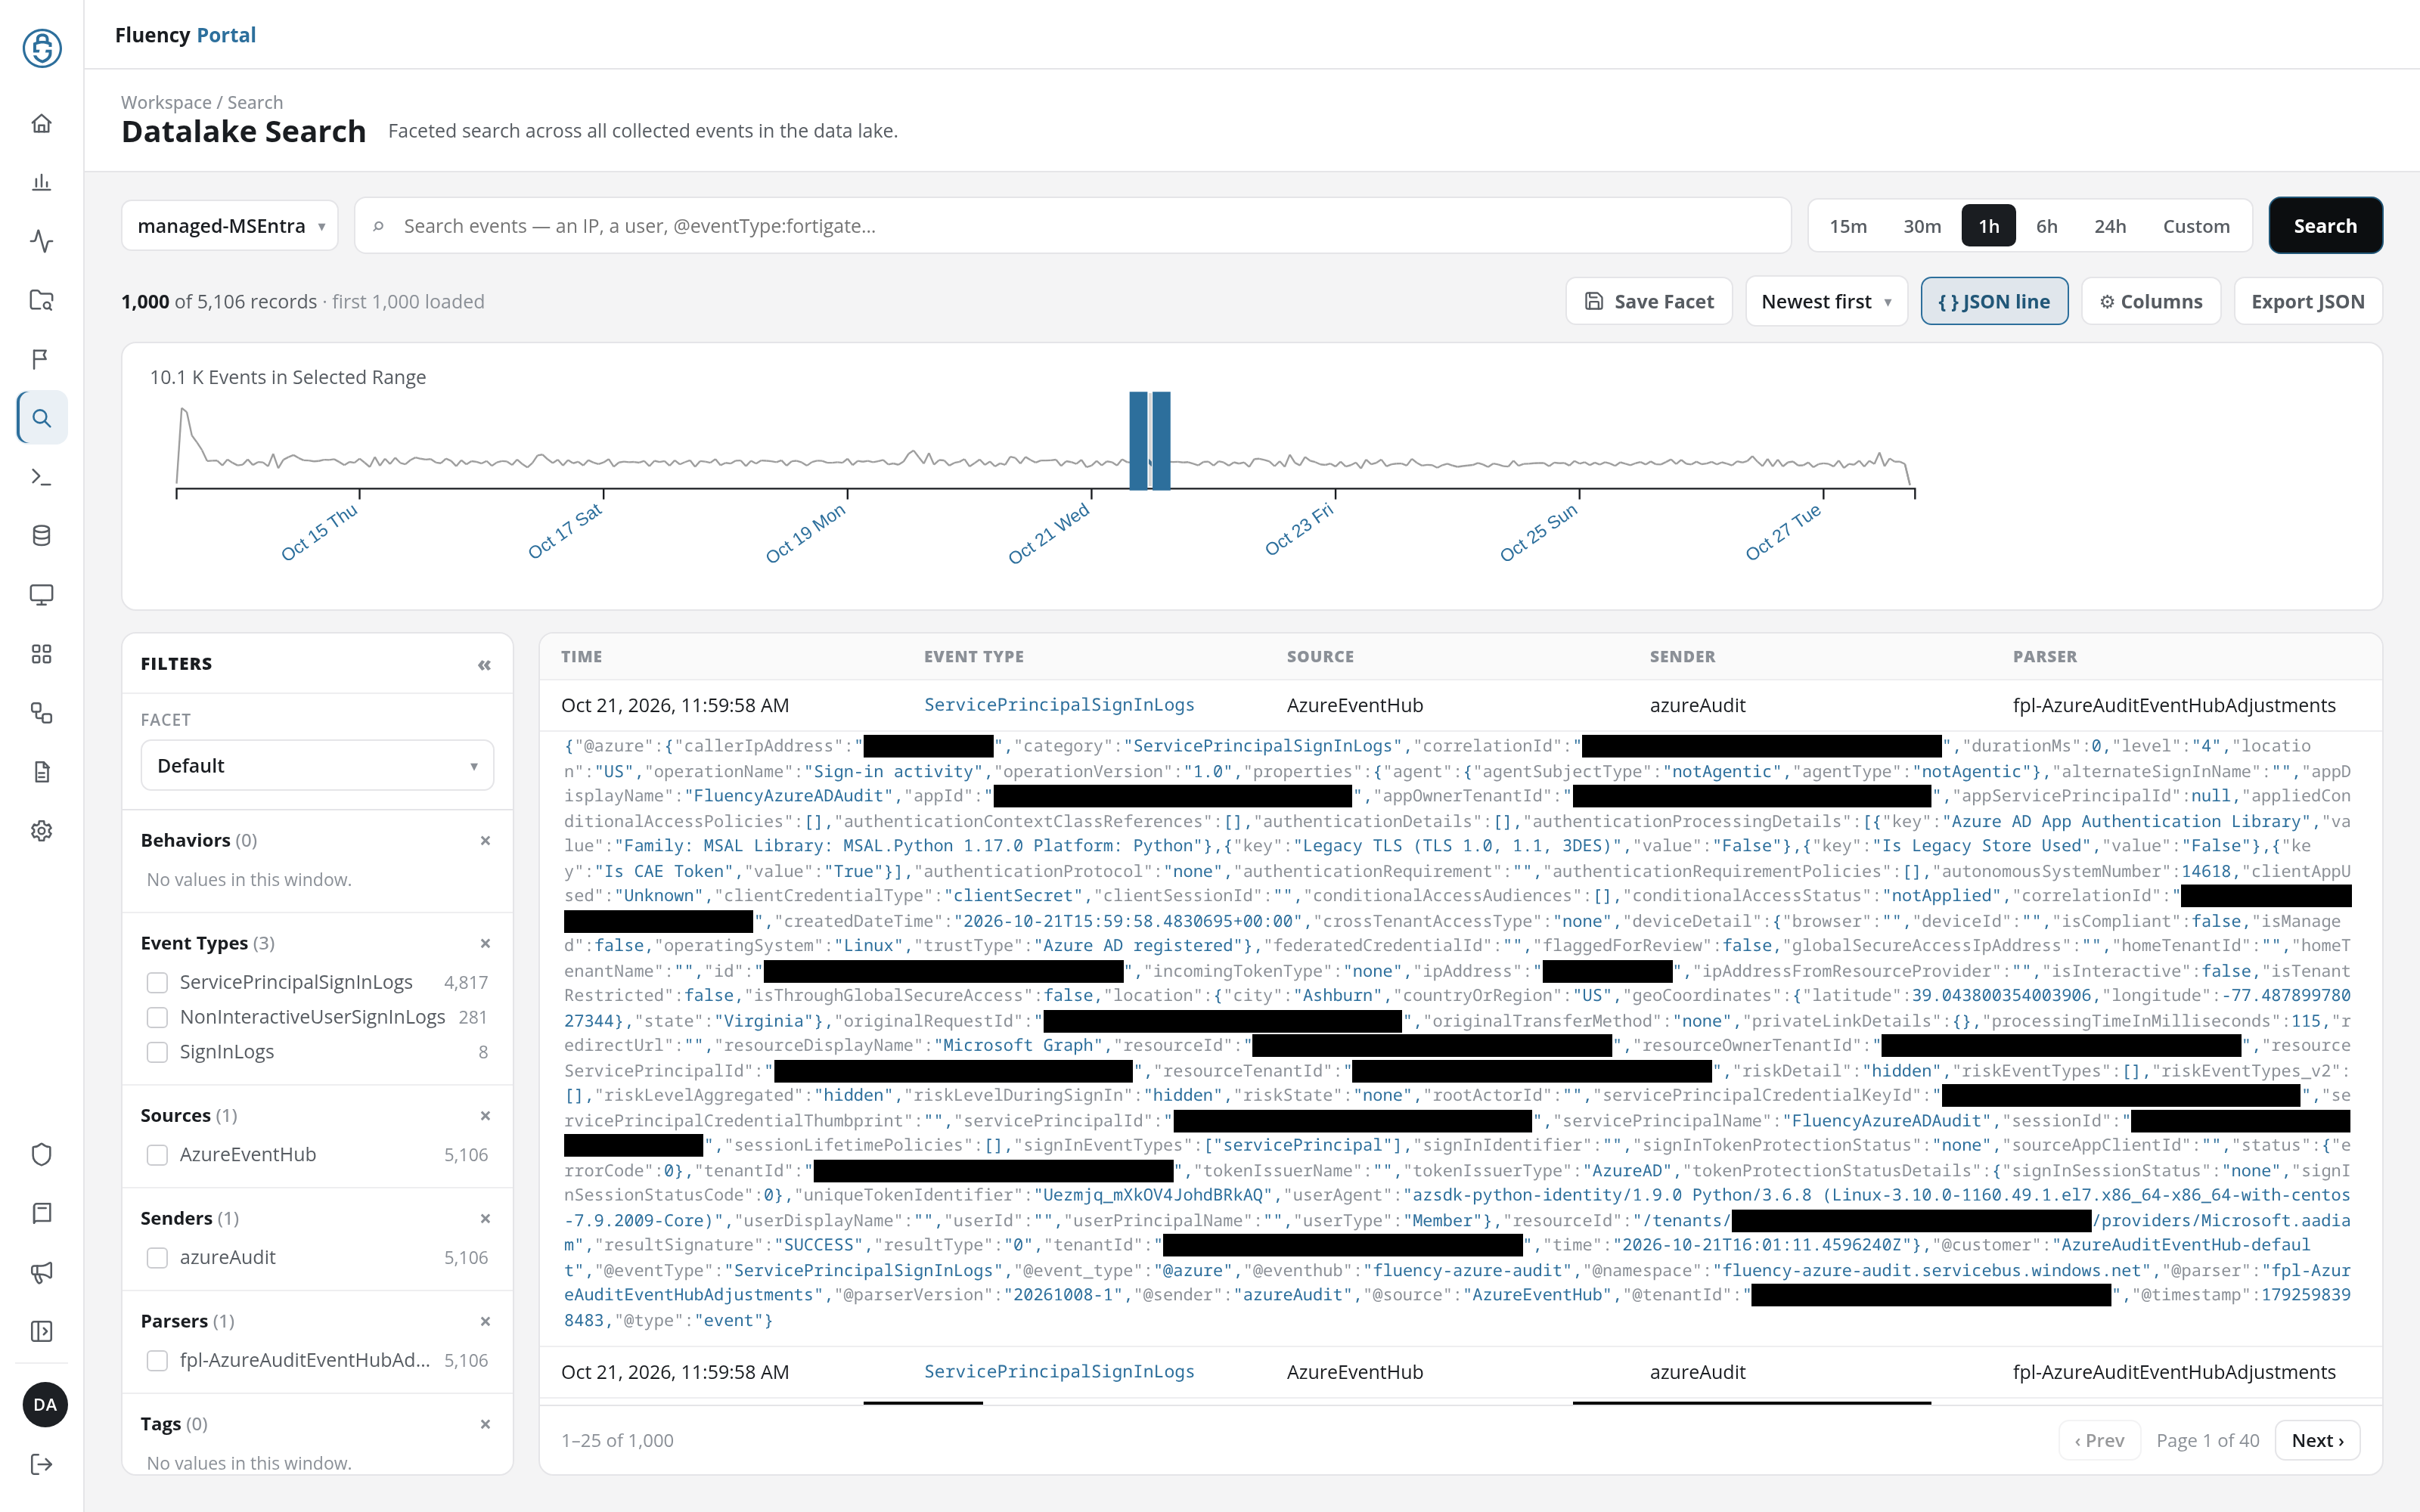
Record Count
The count at the left of the toolbar reports how many events matched and how many are loaded, for example 1,000 of 5,106 records · first 1,000 loaded. A search loads at most the first 1,000 matching events; narrow the time range or add filters to reach the rest.
Save Facet
Save Facet saves a search facet from the page. Saved facets (each a set of fields, with a query and indexes) are offered by the Filters panel's facet selector and managed on Search Facets.
It opens the Save Search Preset dialog, which always starts empty: it saves a new facet, and an existing one is changed on Search Facets.
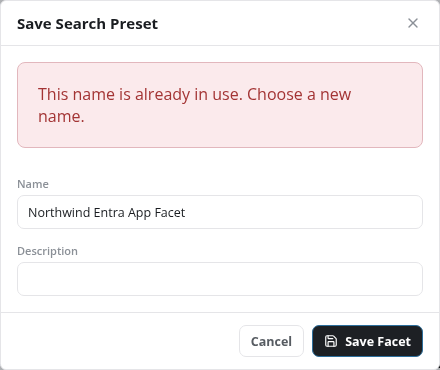
- Name: required. The dialog's Save Facet button stays unavailable while it is empty or blank, and a name that another facet already has is refused with This name is already in use. Choose a new name.
- Description: optional.
Save Facet in the dialog saves the Filters panel's field groups, including any added with + Add field, as a facet for the selected index. The notice Preset "…" saved., with the facet's name, confirms it, and the panel's FACET drop-down switches to the new facet. Cancel or the × closes the dialog without saving.
Sort Order
The sort drop-down orders the results by time: Newest first (the default) or Oldest first. A change applies on the next Search.
JSON Line
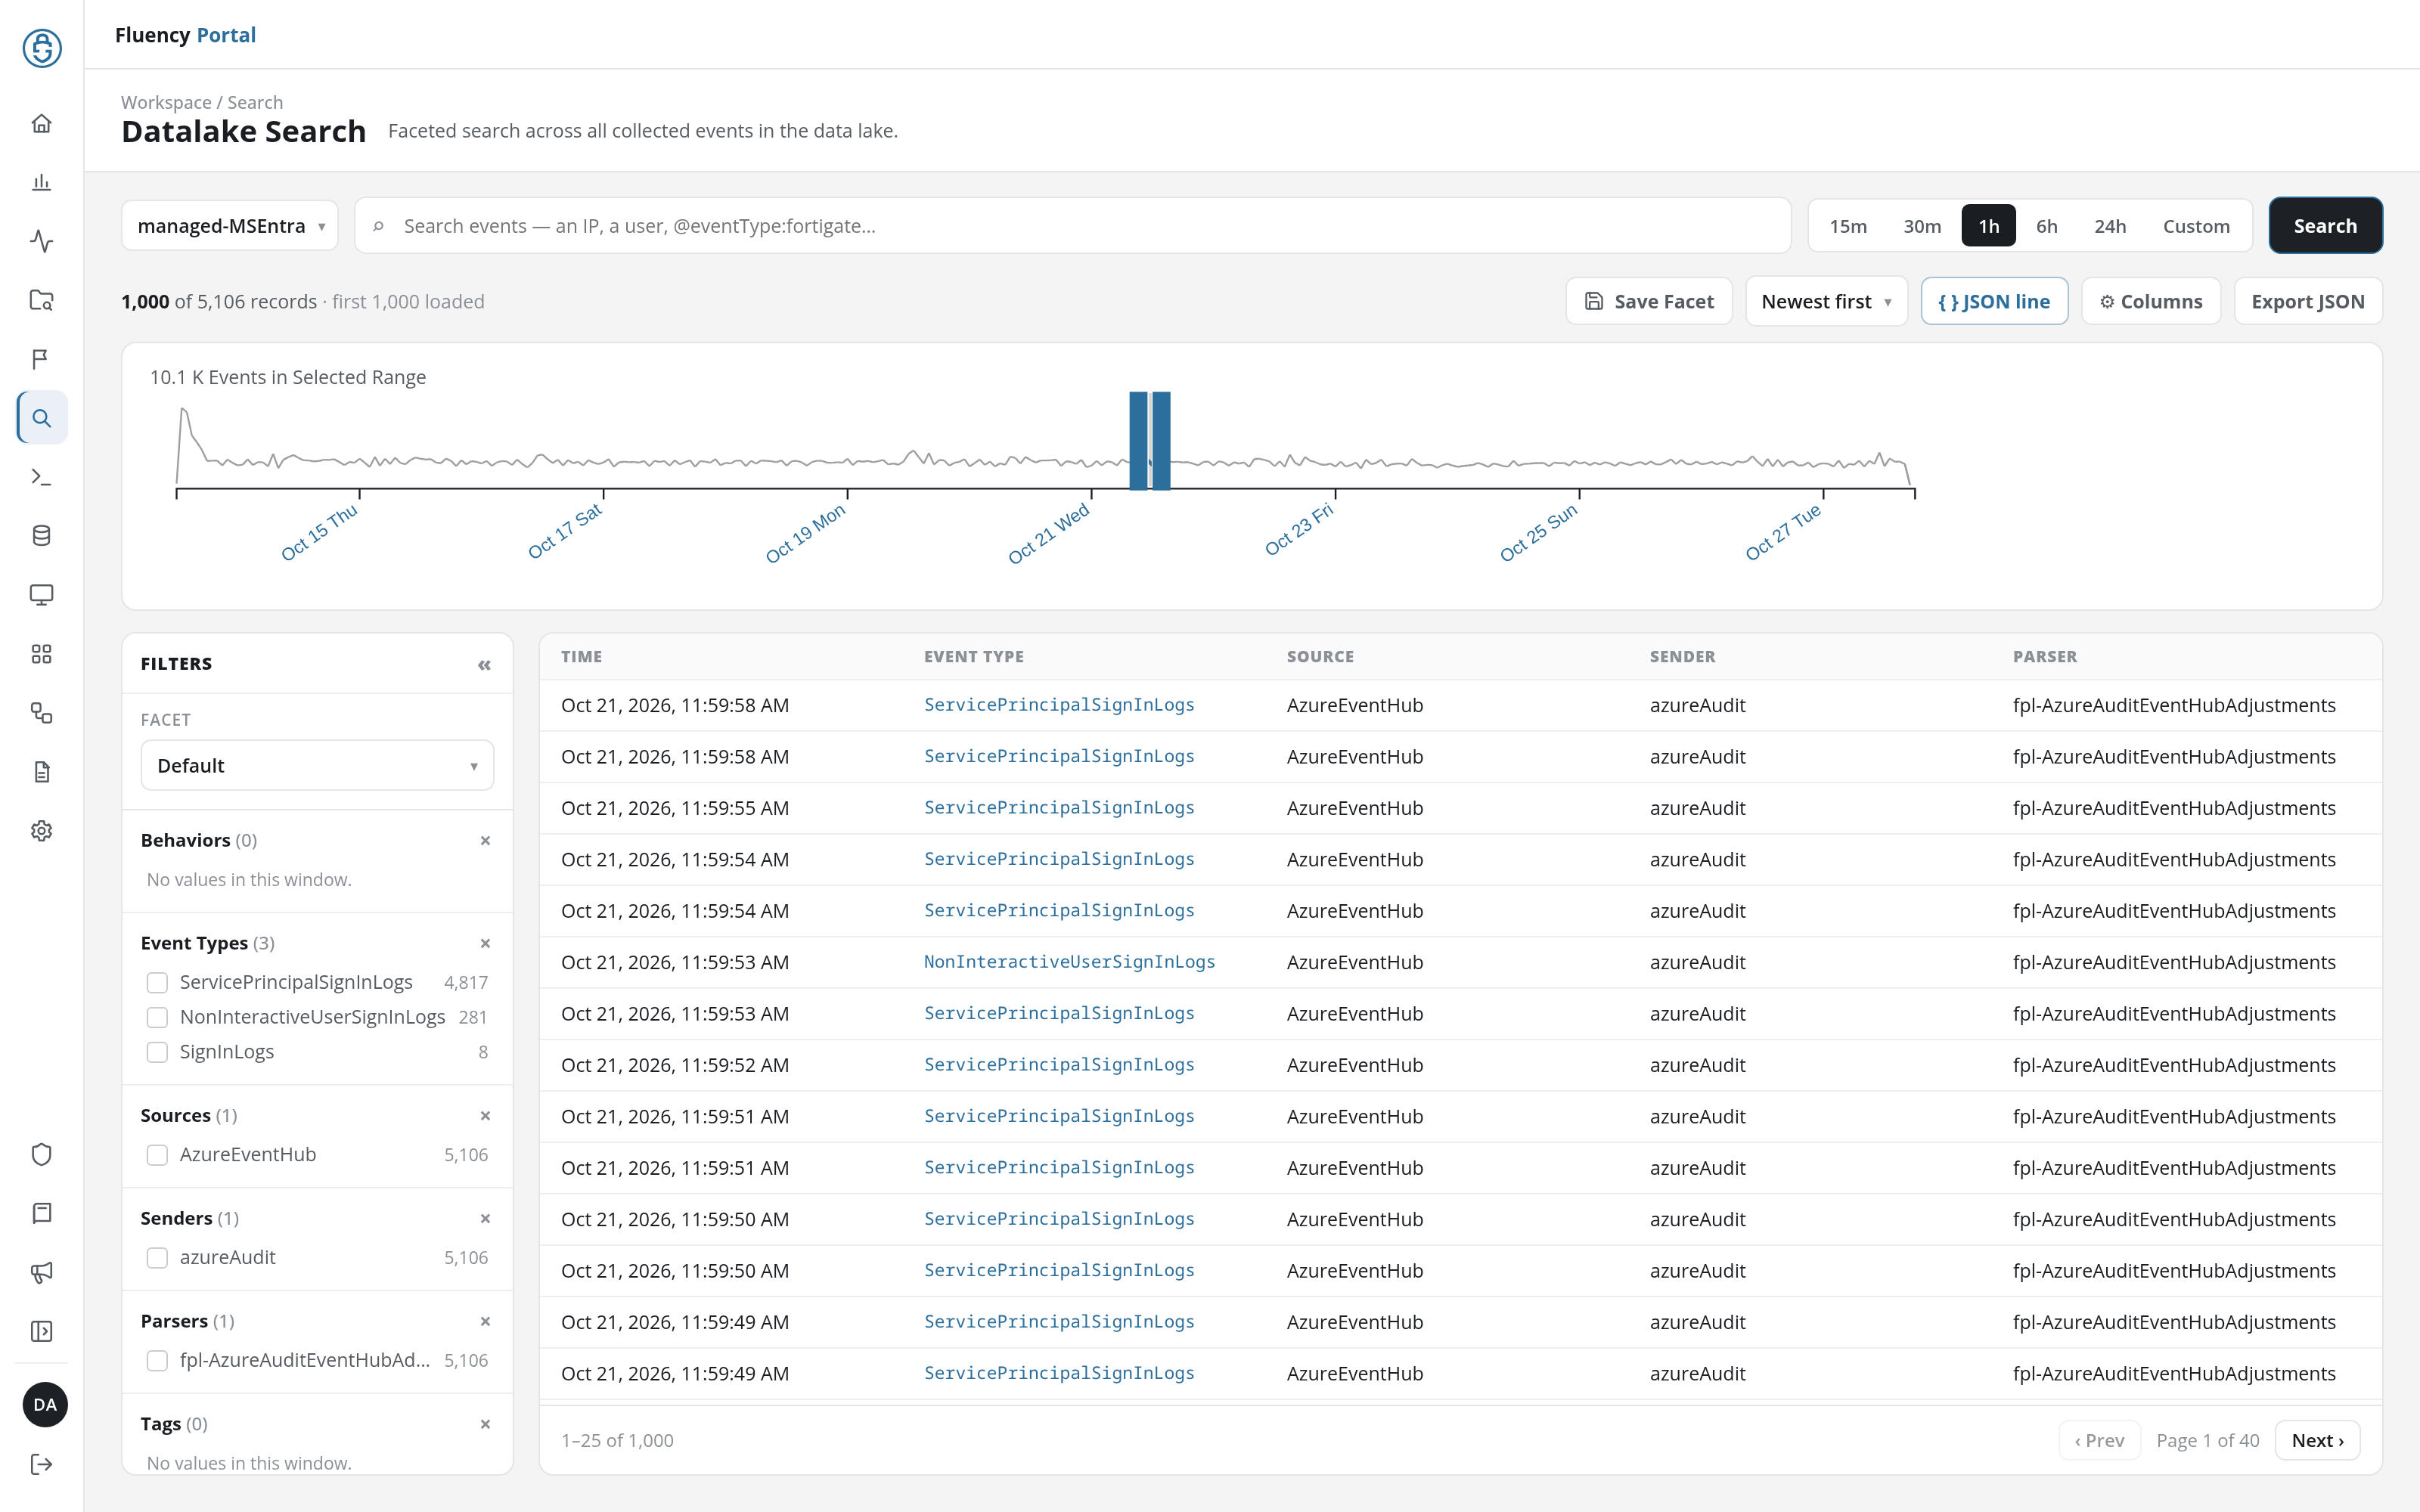
JSON line is a toggle, on by default (shown highlighted). While it is on, each result row is followed by the event's complete JSON on one wrapped line, with keys and values highlighted. Turn it off for a compact table of one line per event:
Columns
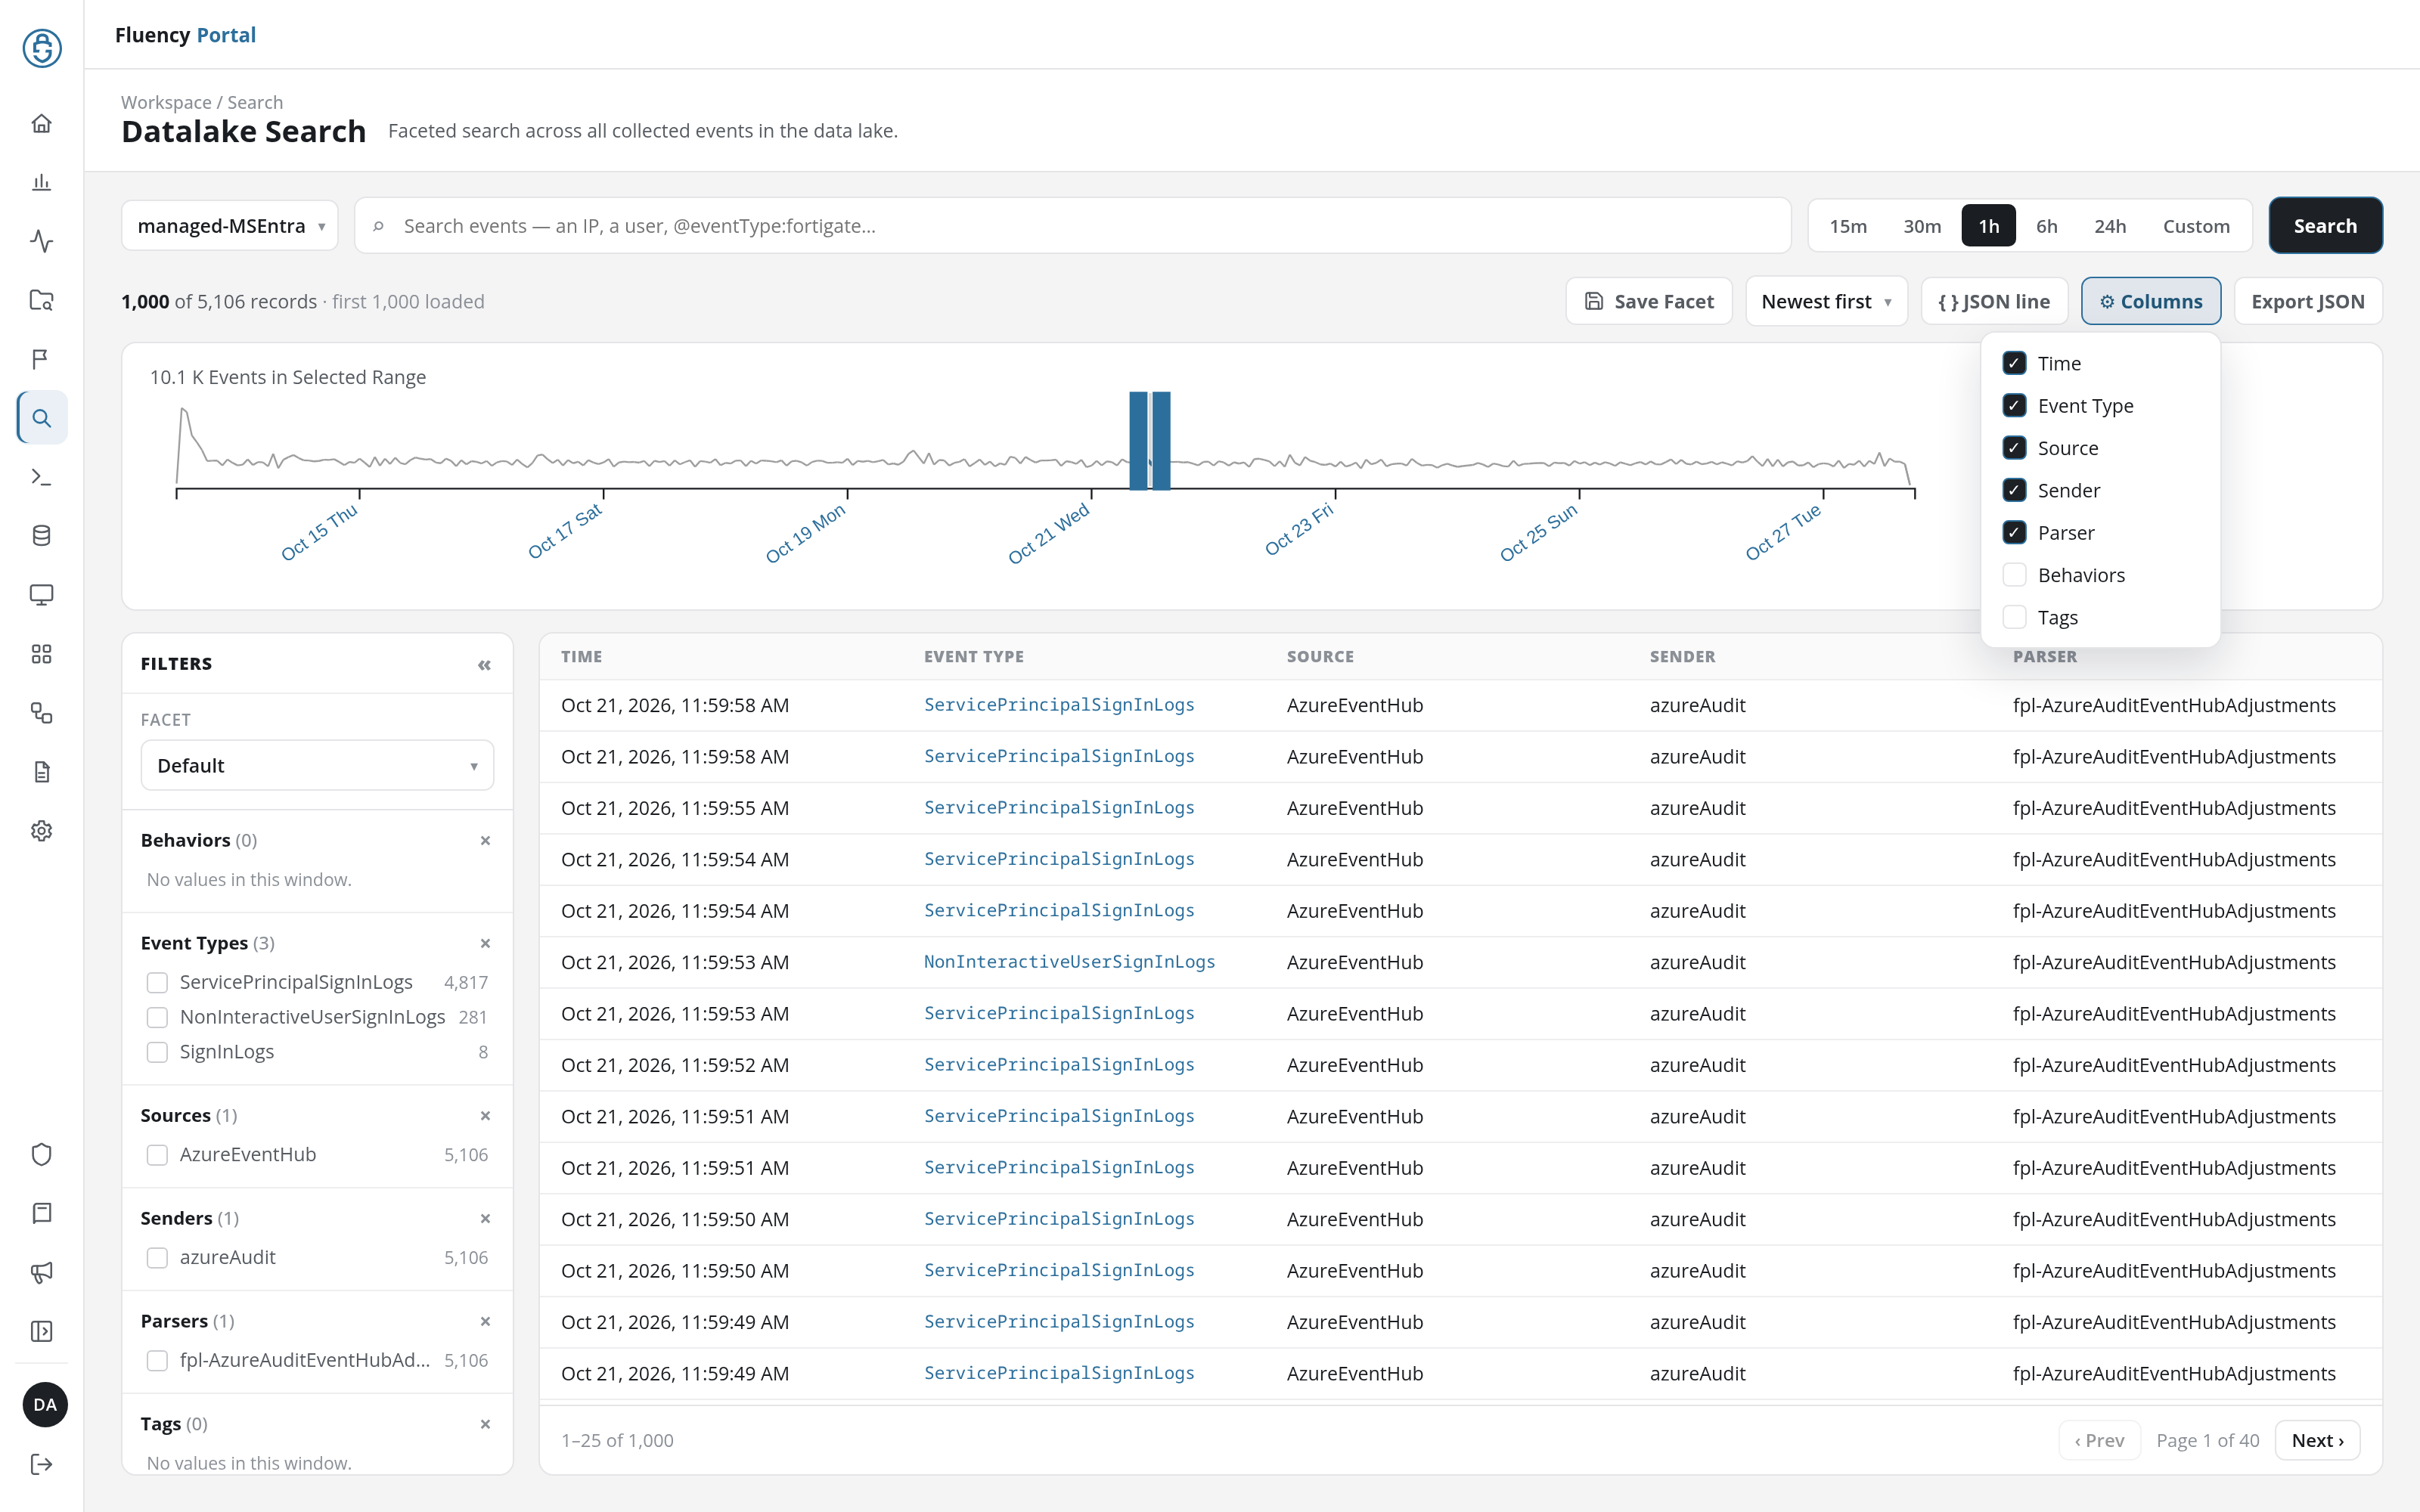
Columns opens a checklist of the result table's columns: Time, Event Type, Source, Sender, and Parser are shown by default; Behaviors and Tags can be added. Each click on an entry shows or hides that column at once.
Export JSON
Export JSON downloads the loaded results as newline-delimited JSON: an .ndjson file with one event per line. It is disabled until a search returns records.
Filter Chips
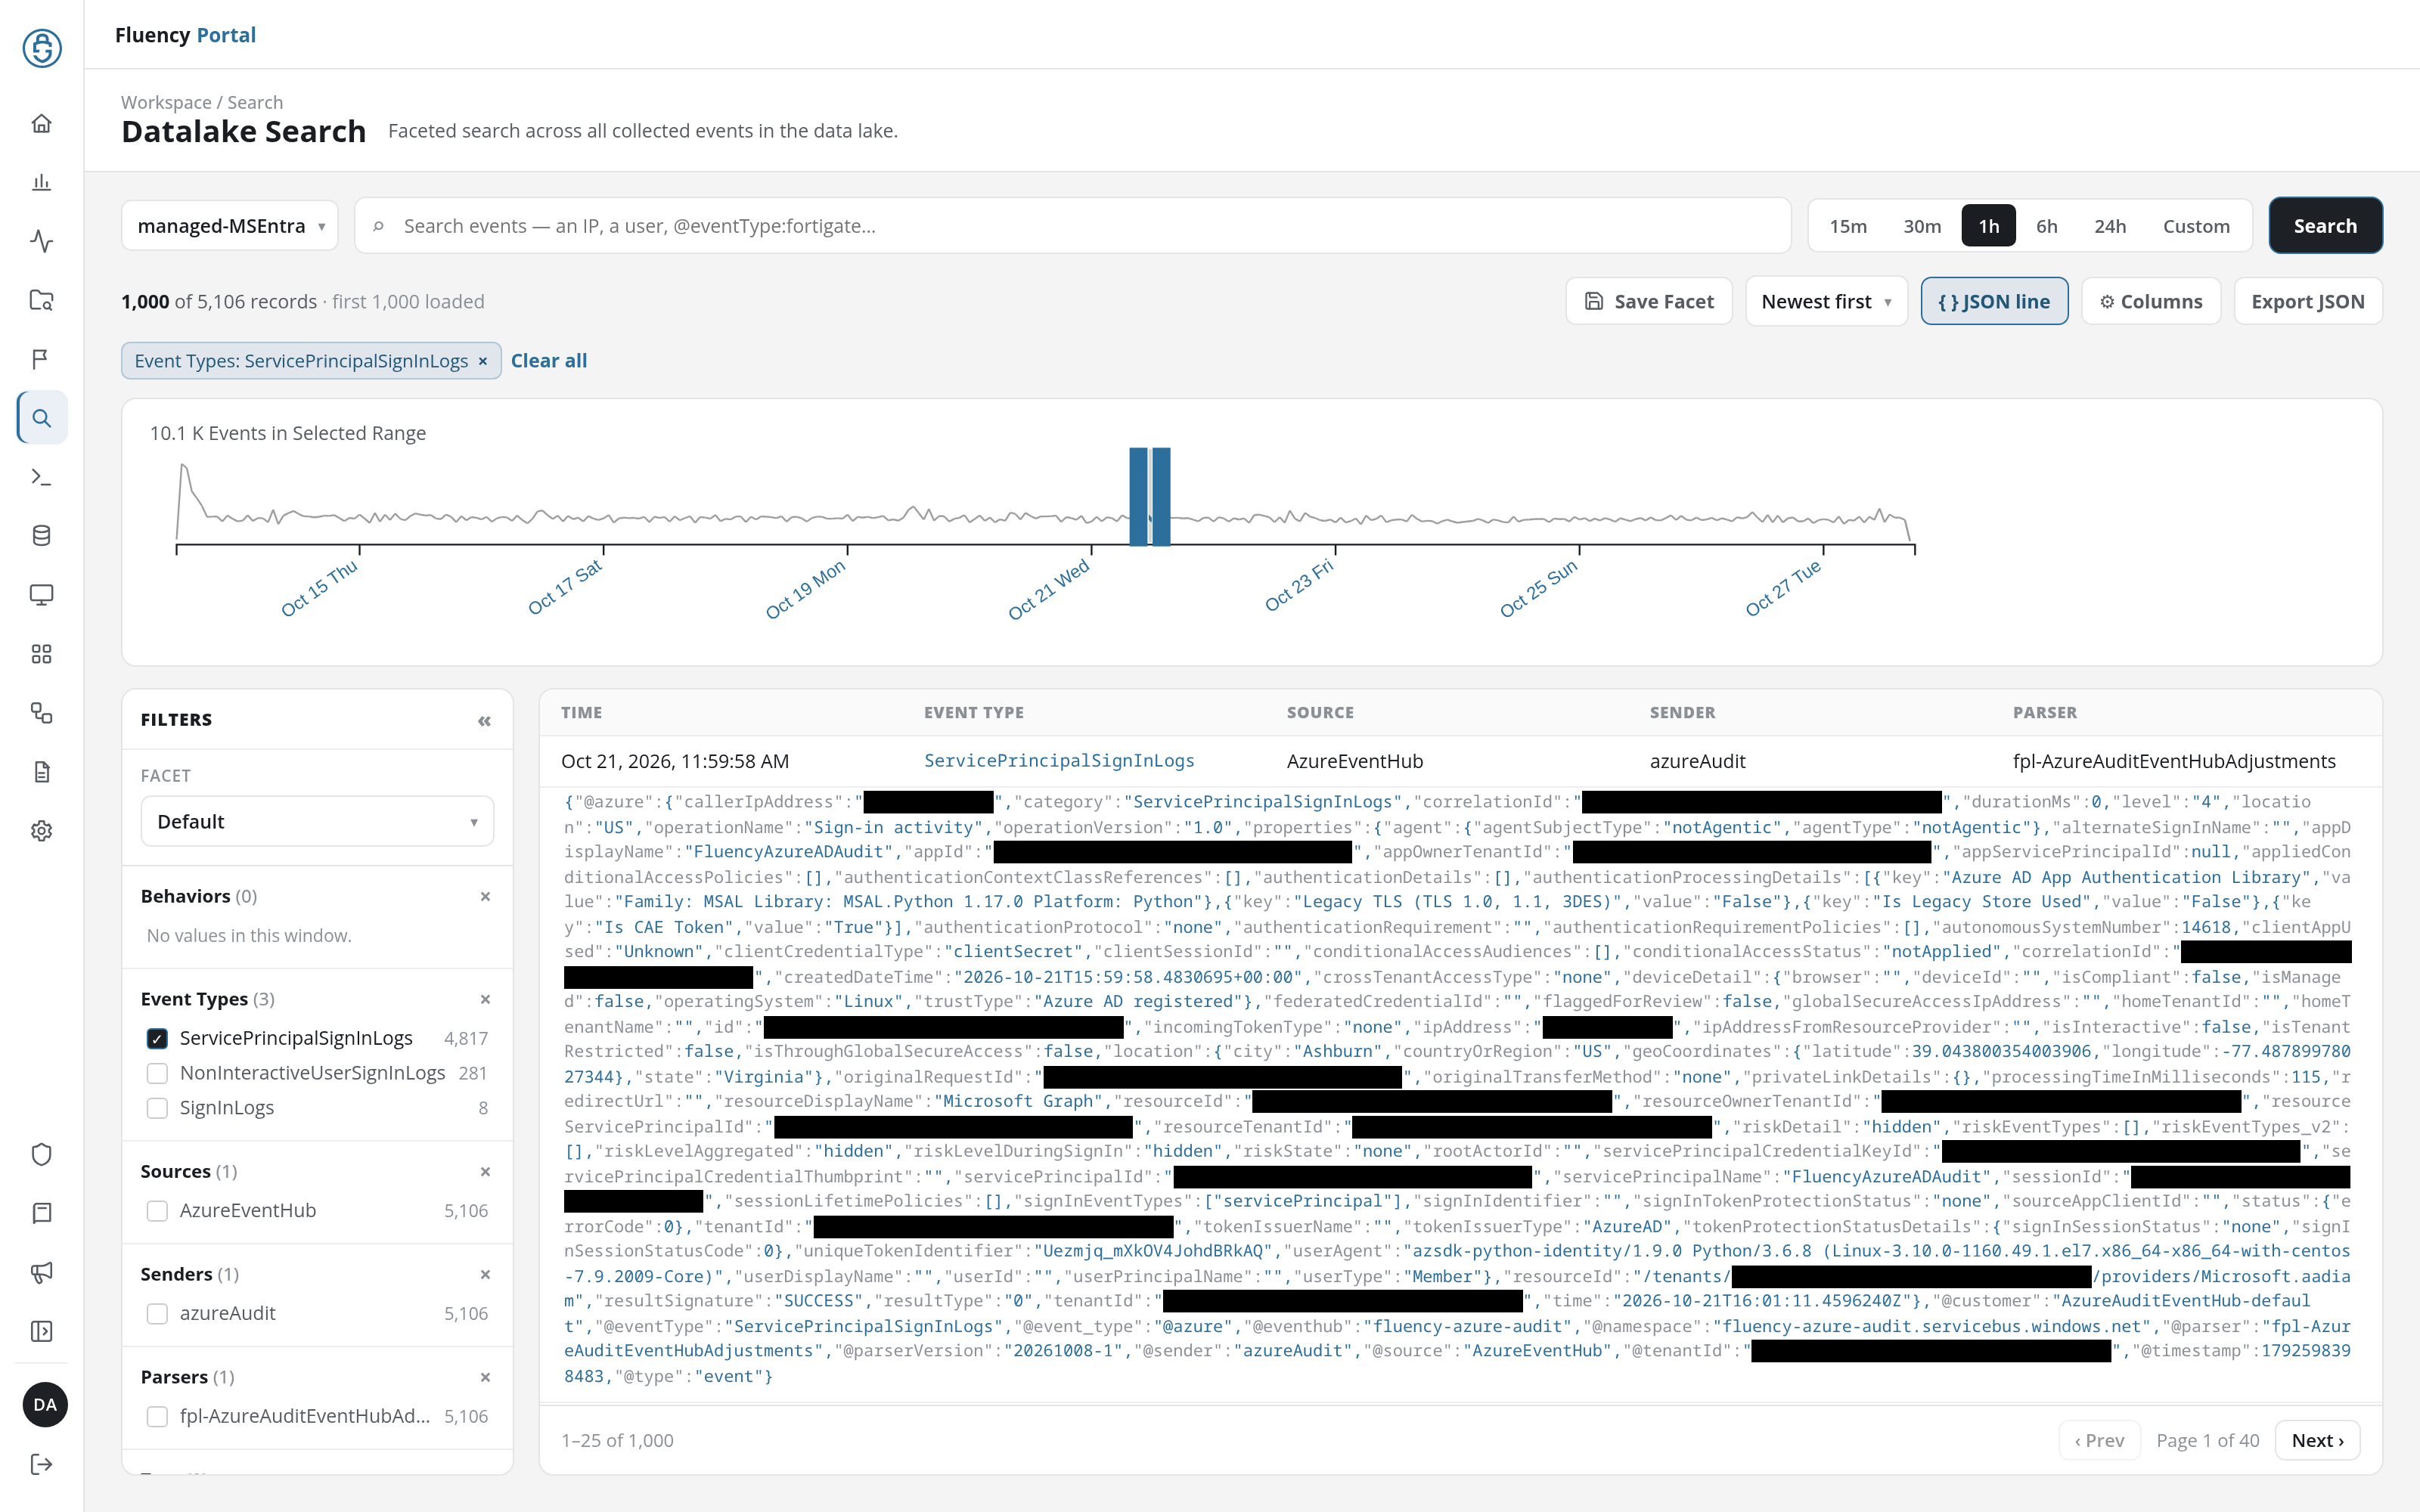
Each filter set from the Filters panel appears as a chip between the toolbar and the histogram, naming the field group and the value (Event Types: ServicePrincipalSignInLogs, for example). An excluding filter is shown in red and starts with NOT. The × on a chip removes that filter; Clear all beside the chips removes them all.
Histogram
The histogram charts the selected index's event count across several days, with the day boundaries labelled along the bottom, and highlights the selected time range as blue bars at its right-hand end. The heading above it gives the event count for the selected range, such as 2.7 K Events in Selected Range.
Two handles on the chart mark the start and end of the selected range (from date/time value and to date/time value). Drag either one to pick a range on the chart: the time range switches to Custom, its Start time and end time fields take the handles' positions, and the heading recounts the events in the new range. Press Search to search it.
Filters Panel
The panel on the left narrows the results by the values of individual fields. The « button in its header (Collapse filters) folds it into a narrow strip labelled FILTERS with a badge counting the active filters, giving the result table the full width; » opens it again.
Facet Selector
The FACET drop-down at the top of the panel chooses a saved search facet: the set of field groups the panel shows. Default shows Behaviors, Event Types, Sources, Senders, Parsers, and Tags; the other facets are named after the data they suit, such as Default-AWS_CloudWatch, Default-Fortigate, Default-Microsoft_Defender_Events, or GSuite, and bring their own groups: GSuite, for example, adds groups such as City, Country, ISP, Org, Email, and IP Address.
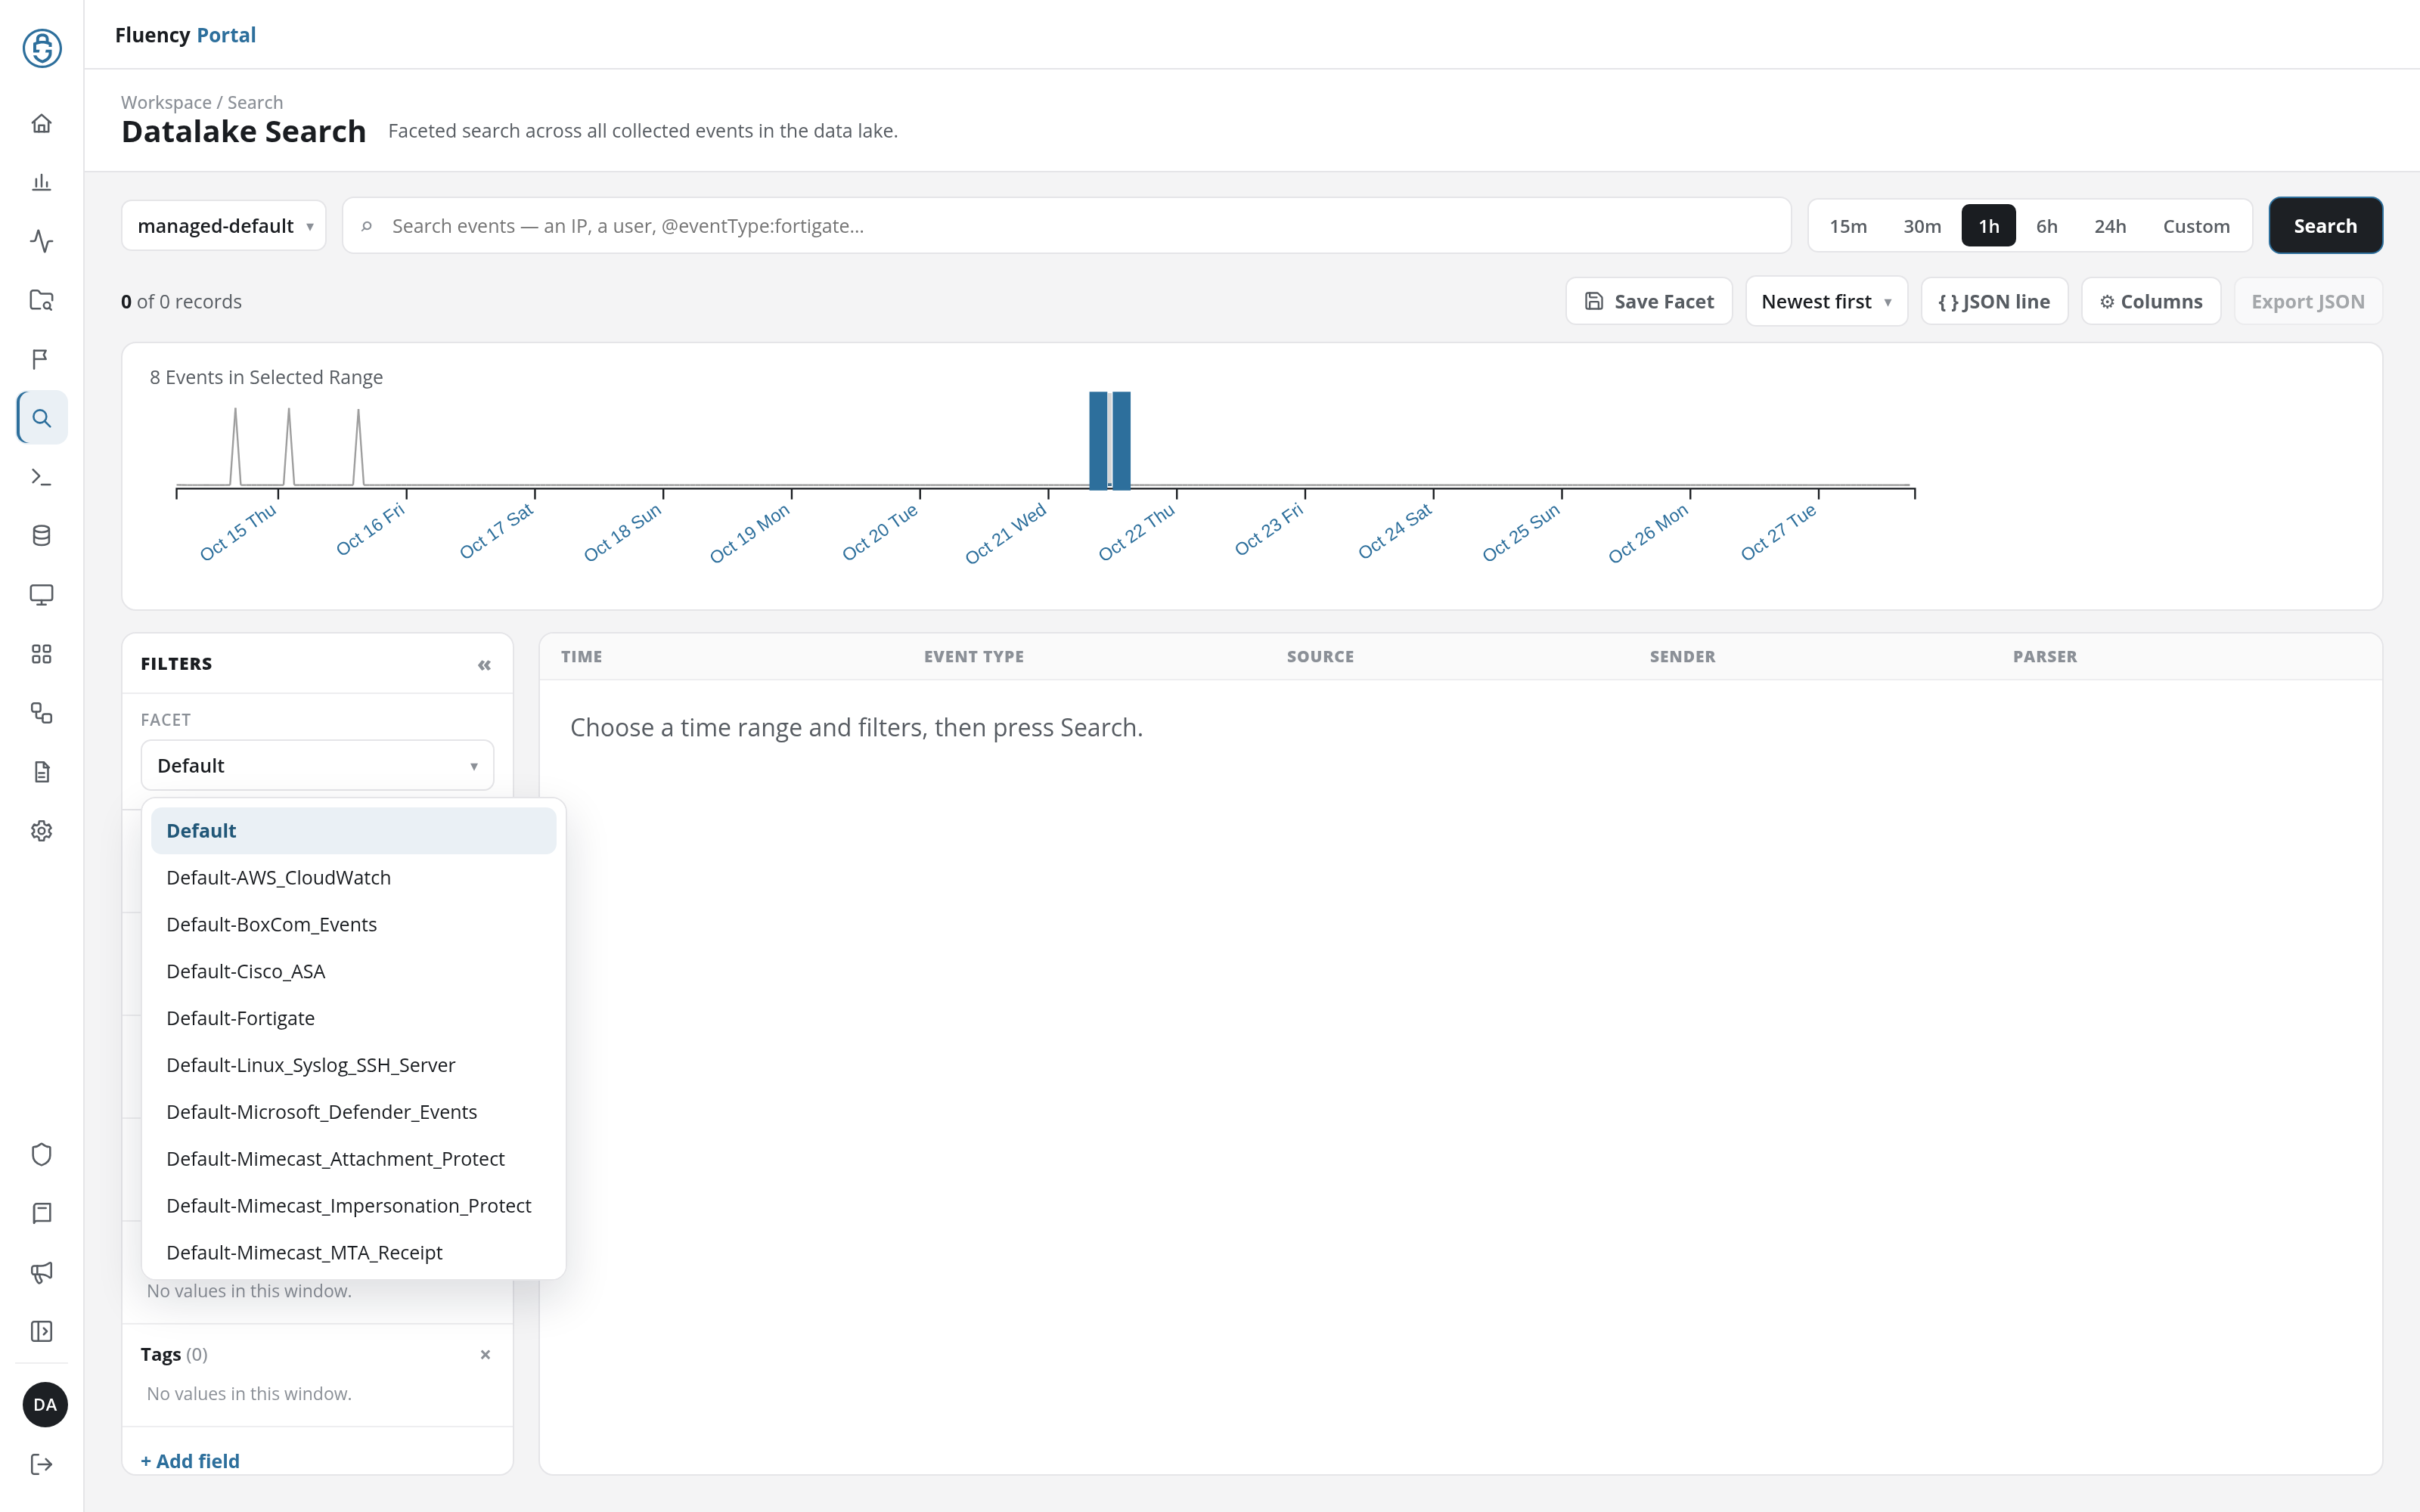
The facets in the list are the ones on Search Facets that fit the selected index. An index with facets of its own offers Default and those: with managed-MSEntra, for example, the list is Default, Default-EntraID_AuditLogs, Default-EntraID_SignIn, and any facet saved for that index. The list above is the one for managed-default.
Choosing a facet asks for confirmation before it changes the search. A facet with a query of its own asks Replace the current query and filter selections with "…"?, quoting its query; one without asks Clear the current query and filter selections for this facet? Confirm to put the facet's query (or nothing) in the search box in place of the current query and filters, or cancel to keep them. The panel shows the chosen facet's groups either way.
Field Groups
Each group is headed by its name and, in brackets, the number of distinct values found: Event Types (3). Below the heading, each value is listed with a checkbox and the number of matching events. A group lists six values at first; + N more below them lists the rest, and Show less shortens the list again. A group with nothing to count reads No values in this window.
The × at the right of a group heading (Remove Event Types field, and so on) removes that group from the panel.
Including and Excluding Values
A value starts out not filtered. Clicking it moves it through the filter states:
-
Included: the checkbox is ticked and a filter chip for the value appears above the histogram.
-
Excluded: the checkbox turns red, the value is struck through, and the chip turns red with NOT in front.
-
Cleared: the third click removes the filter; the value is back to not filtered.
Each value's accessible label, read out by screen readers, states its current state and what the next click does: ServicePrincipalSignInLogs: not filtered. Click to include., then …: included. Click to exclude., then …: excluded. Click to clear filter. Hovering a value shows its name. A click only sets the filter: press Search to run the search with the filters that are set.
Add Field
+ Add field at the bottom of the panel adds a field group of your own. It opens a small form with two inputs, Display name (the group's heading) and Field value (the event field to count; placeholder @field.path), and an Add field button that adds the group to the panel. The button is unavailable until both inputs are filled. A group added this way stays until the page is reloaded; Save Facet keeps it in a facet.
Result Table
Each row is one event, with the columns chosen under Columns: by default the event's Time, Event Type (in blue), Source, Sender, and Parser. With JSON line on, the event's raw JSON follows the row.
The table shows 25 events per page. The footer gives the range shown and the number loaded (1–25 of 1,000), and ‹ Prev, Page 1 of 40, and Next › page through the loaded events.
Event Detail Panel
Click a row, or its JSON line, to open the event in a panel that slides in from the right over the page.
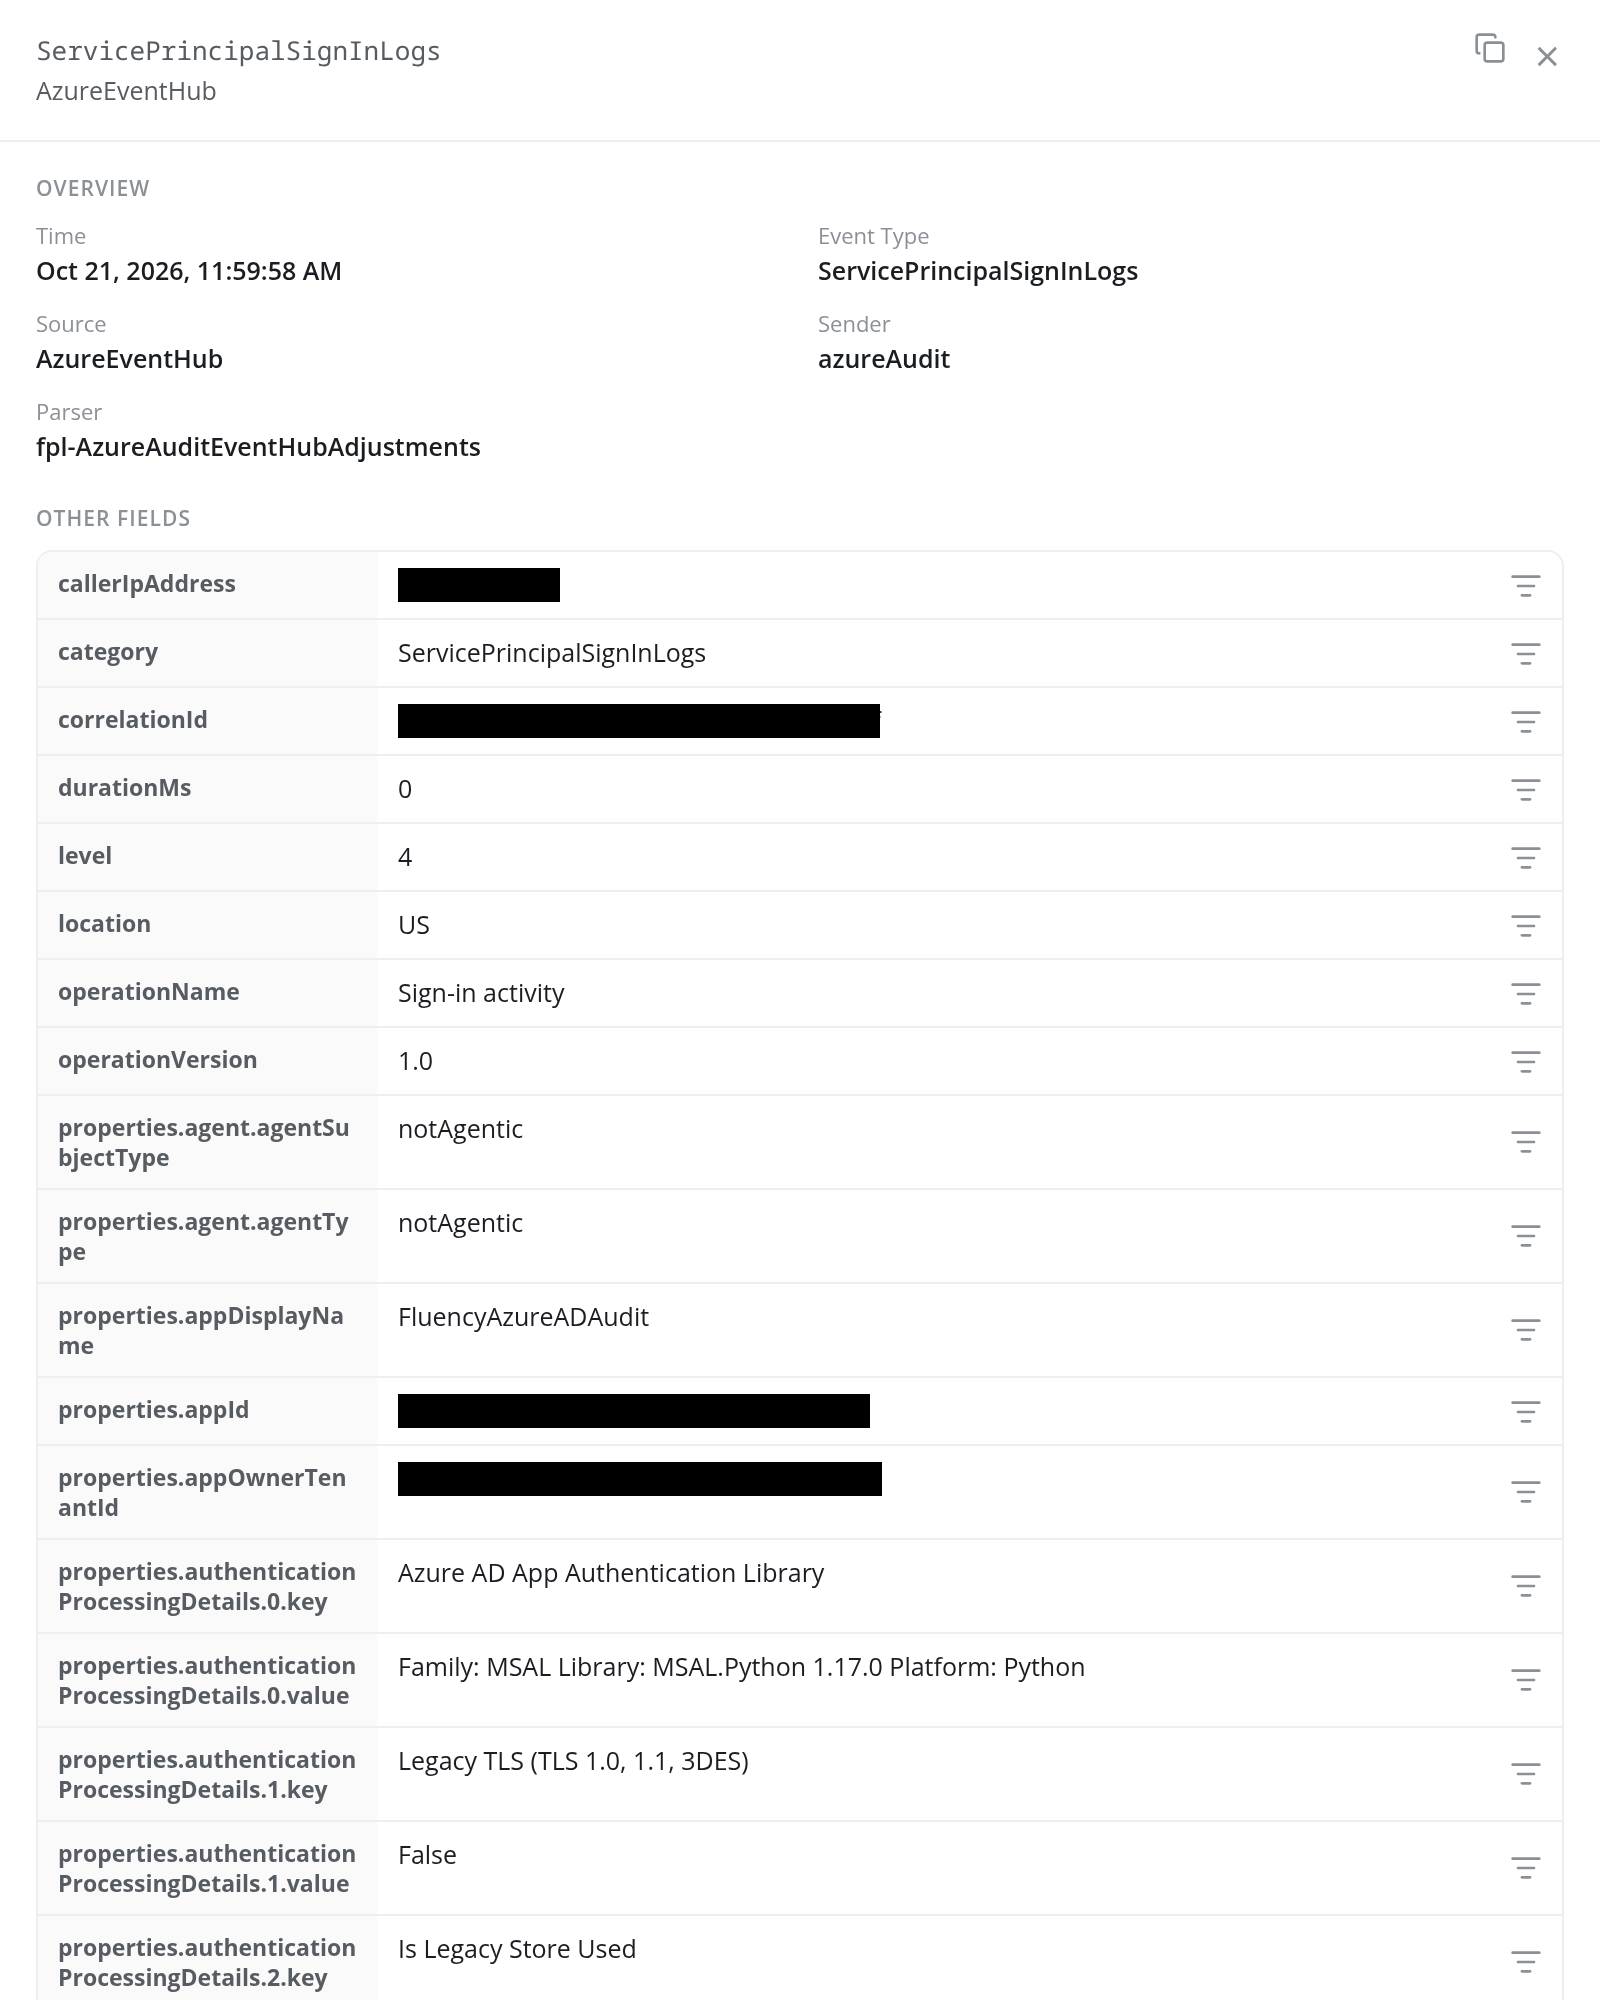
- Header: the event type with the source beneath it, a Copy JSON button (the copy icon), and ×, which closes the panel.
- OVERVIEW: the event's Time, Event Type, Source, Sender, and Parser.
- OTHER FIELDS: every other field of the event, one row each, named from below the event's top-level object, with nested fields written as a dotted path (
properties.agent.agentTypefor@azure.properties.agent.agentType). The filter button at the right end of each row (Add @azure.category to filters, and so on) adds that field and value to the search's filters. - RAW JSON: the event's complete JSON, folded at first: Show displays it and Hide folds it again. Beside them is a second Copy JSON button.