Home
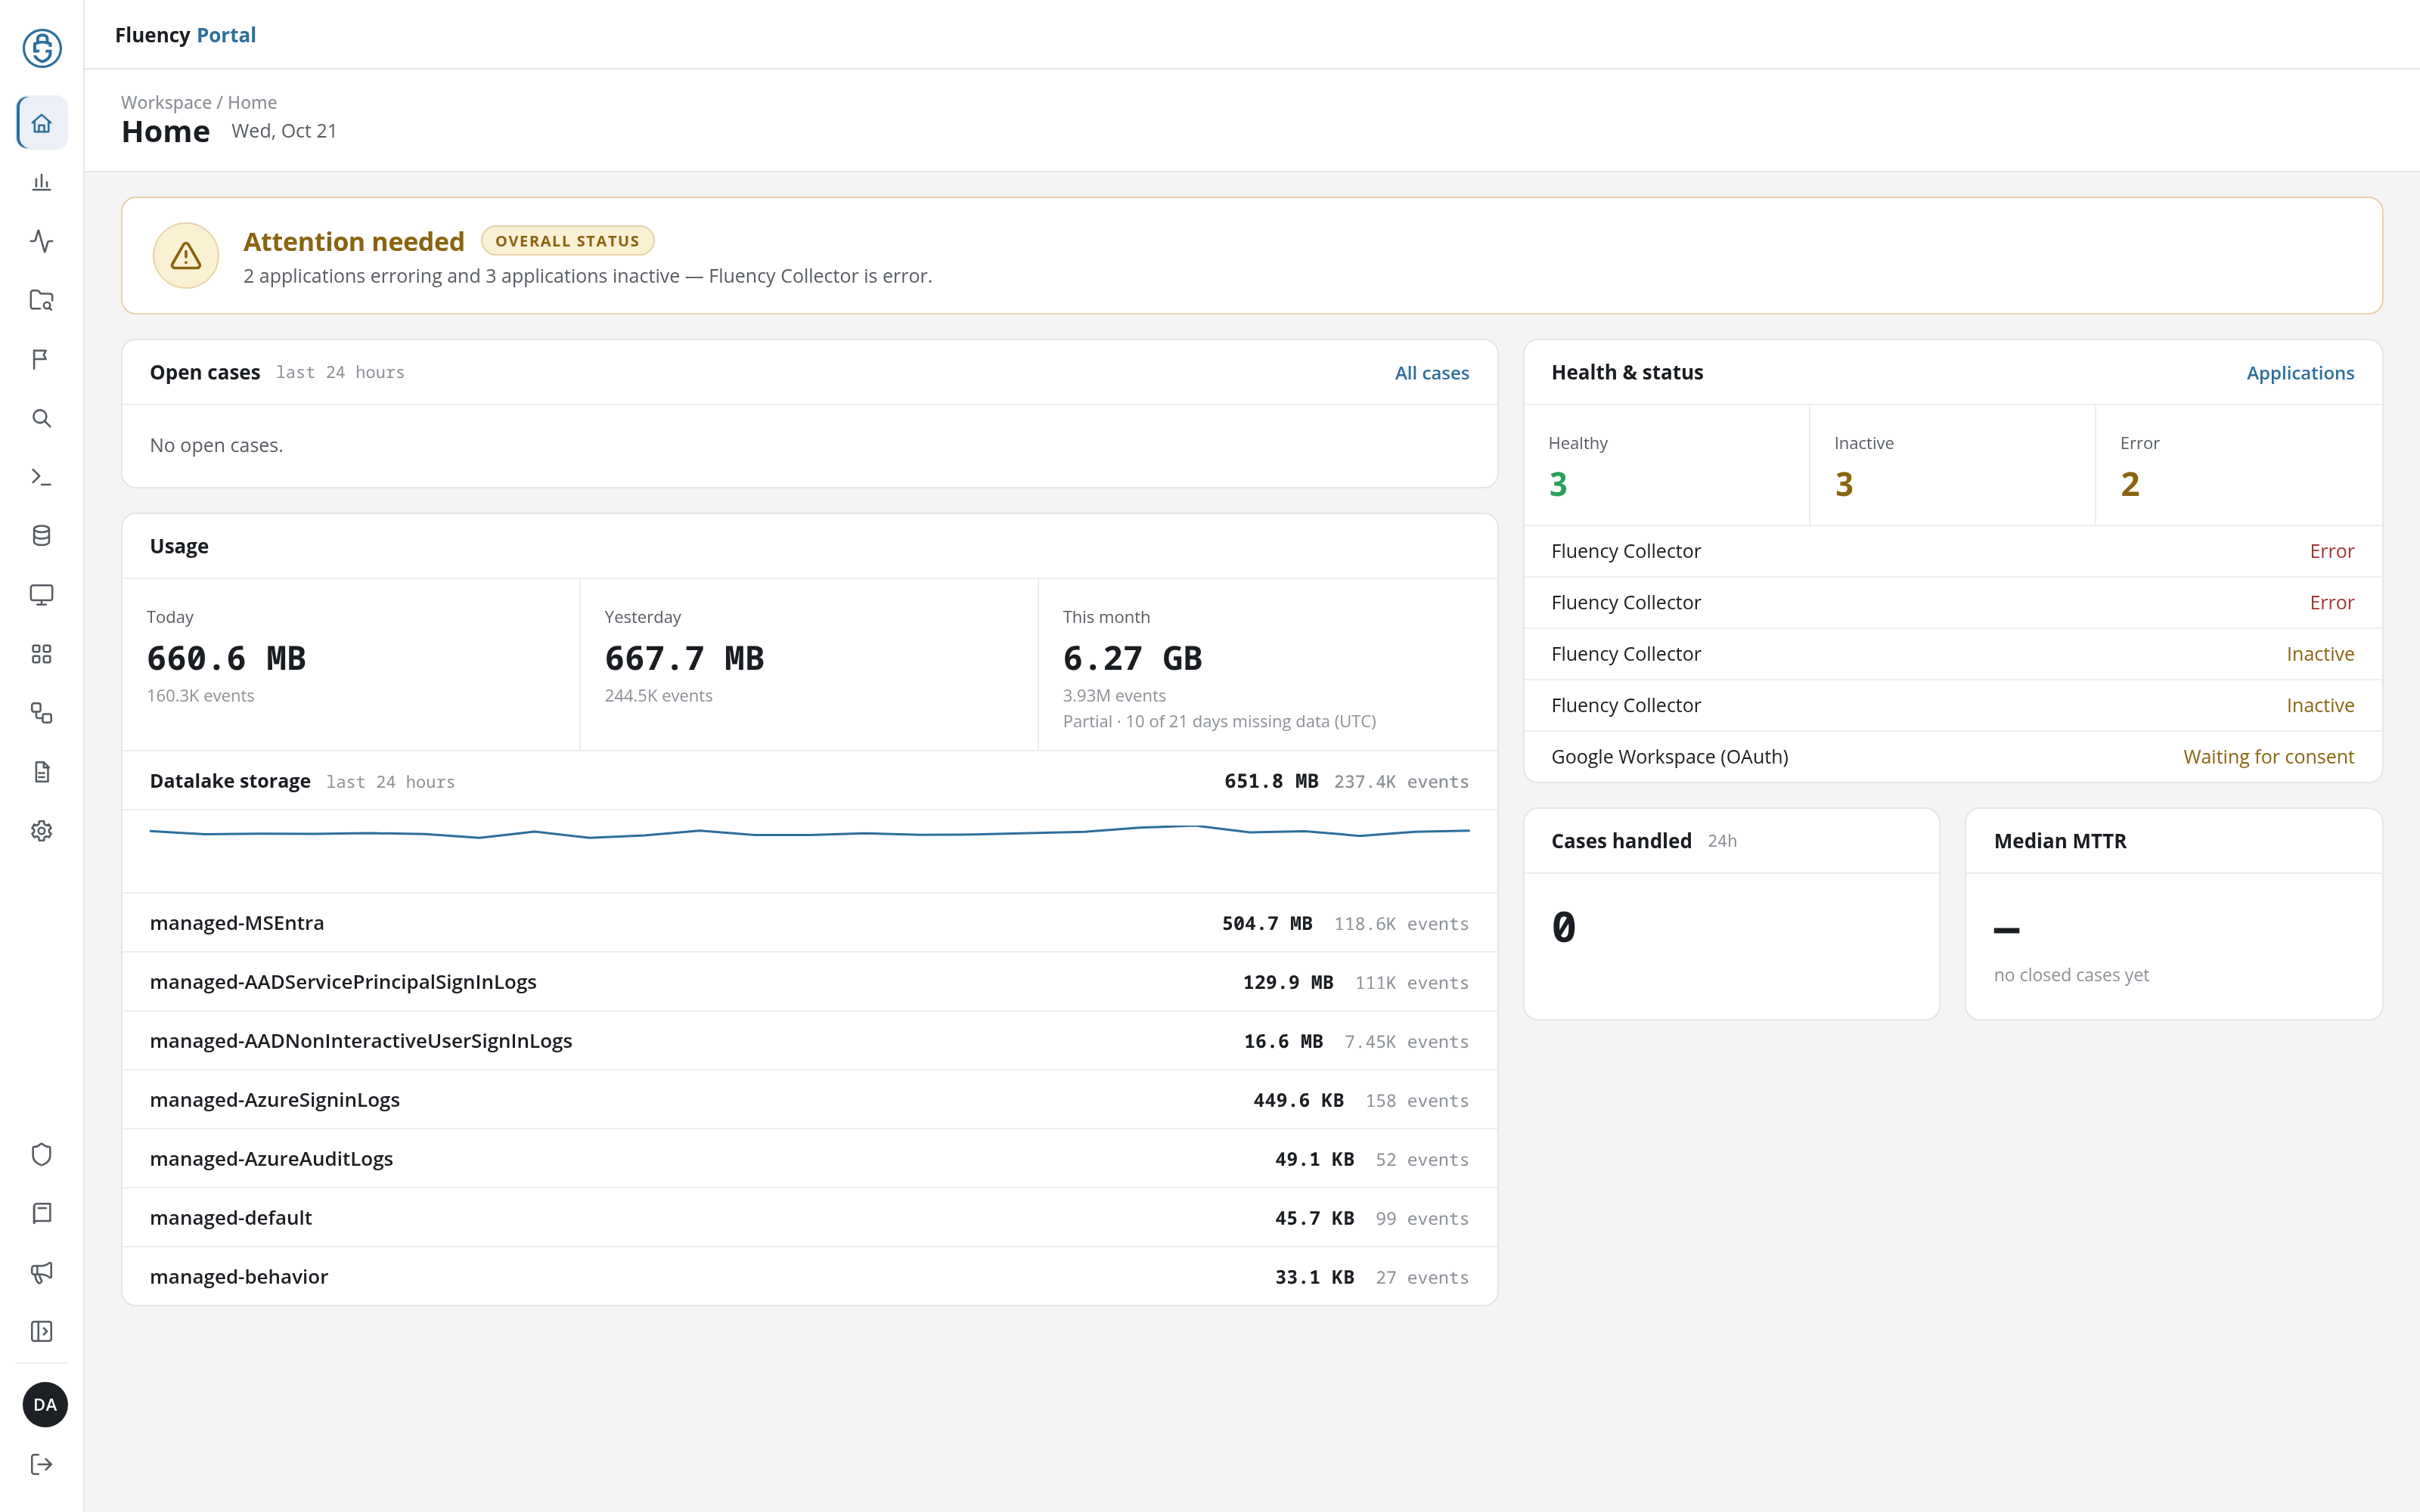
The Home page is the landing dashboard shown after sign-in. It brings together the account's overall status, its open cases, how much data it has received and stored, the health of its installed applications, and how quickly cases are being handled.
Menu path: Home (house icon at the top of the rail, also the landing page after sign-in) · URL path: /v2/home
Right after sign-in, the What’s new dialog can open over Home with Fluency's latest announcements, release notes, and attack coverage (see The Navigation Rail). Close dismisses it; it does not open again when you come back to Home later in the session, and the rail's What’s new button reopens it.
Page Layout
The header shows the breadcrumb Workspace / Home, the title Home, and today's date beside it. Below the header:
- Overall status: a full-width banner across the top.
- Open cases and Usage: stacked panels in the left column. The lower half of the Usage panel is Datalake storage.
- Health & status, Cases handled and Median MTTR: panels in the right column.
Each panel has a title in its upper-left corner, often followed by the period it covers (last 24 hours, 24h). A panel that has a full page of its own carries a link to it in its upper-right corner.
Overall Status
The banner at the top marked OVERALL STATUS sums up what needs attention. When something does, its heading reads Attention needed beside a warning icon, and the line beneath it says what: for example 4 applications inactive – Fluency Collector is inactive.
Open Cases
Lists the cases still open from the last 24 hours. When there are none, the panel reads No open cases.
Click All cases in the panel's upper-right corner to open Overview Summary.
Usage
The data the account has received, in three columns:
- Today
- Yesterday
- This month
Each column gives the volume received (for example 522.5 MB) with the number of events beneath it. When some days of the month have no usage data, the This month column says so: for example Partial · 10 of 21 days missing data (UTC).
Datalake Storage
The lower half of the Usage panel, headed Datalake storage last 24 hours, summarizes what the account's data lakes stored over the last day:
- The total volume and event count, on the right of the heading.
- A line chart of the data stored over the period.
- One row per index, busiest first, with its volume and event count. Each index is named after its data lake and index:
managed-MSEntrais theMSEntraindex of themanagedlake.
Health & Status
The health of the installed applications. Three counters across the top of the panel count the applications in each state:
- Healthy: shown in green.
- Inactive: shown in amber.
- Error
Below the counters, the applications that are not healthy are listed by name with their state on the right, those in error first; in the example above, three Fluency Collector applications marked Inactive, and a Google Workspace (OAuth) application marked Waiting for consent. Click an application to open its details page, which shows its traffic in and out, error bytes, drop rate, last event, pipeline, parameters and actions.
Click Applications in the panel's upper-right corner to open the Applications page.
Cases Handled
The number of cases handled in the last 24h.
Median MTTR
The median time to resolve a case. Until a case has been closed, the panel shows a dash and the note no closed cases yet.