Platform
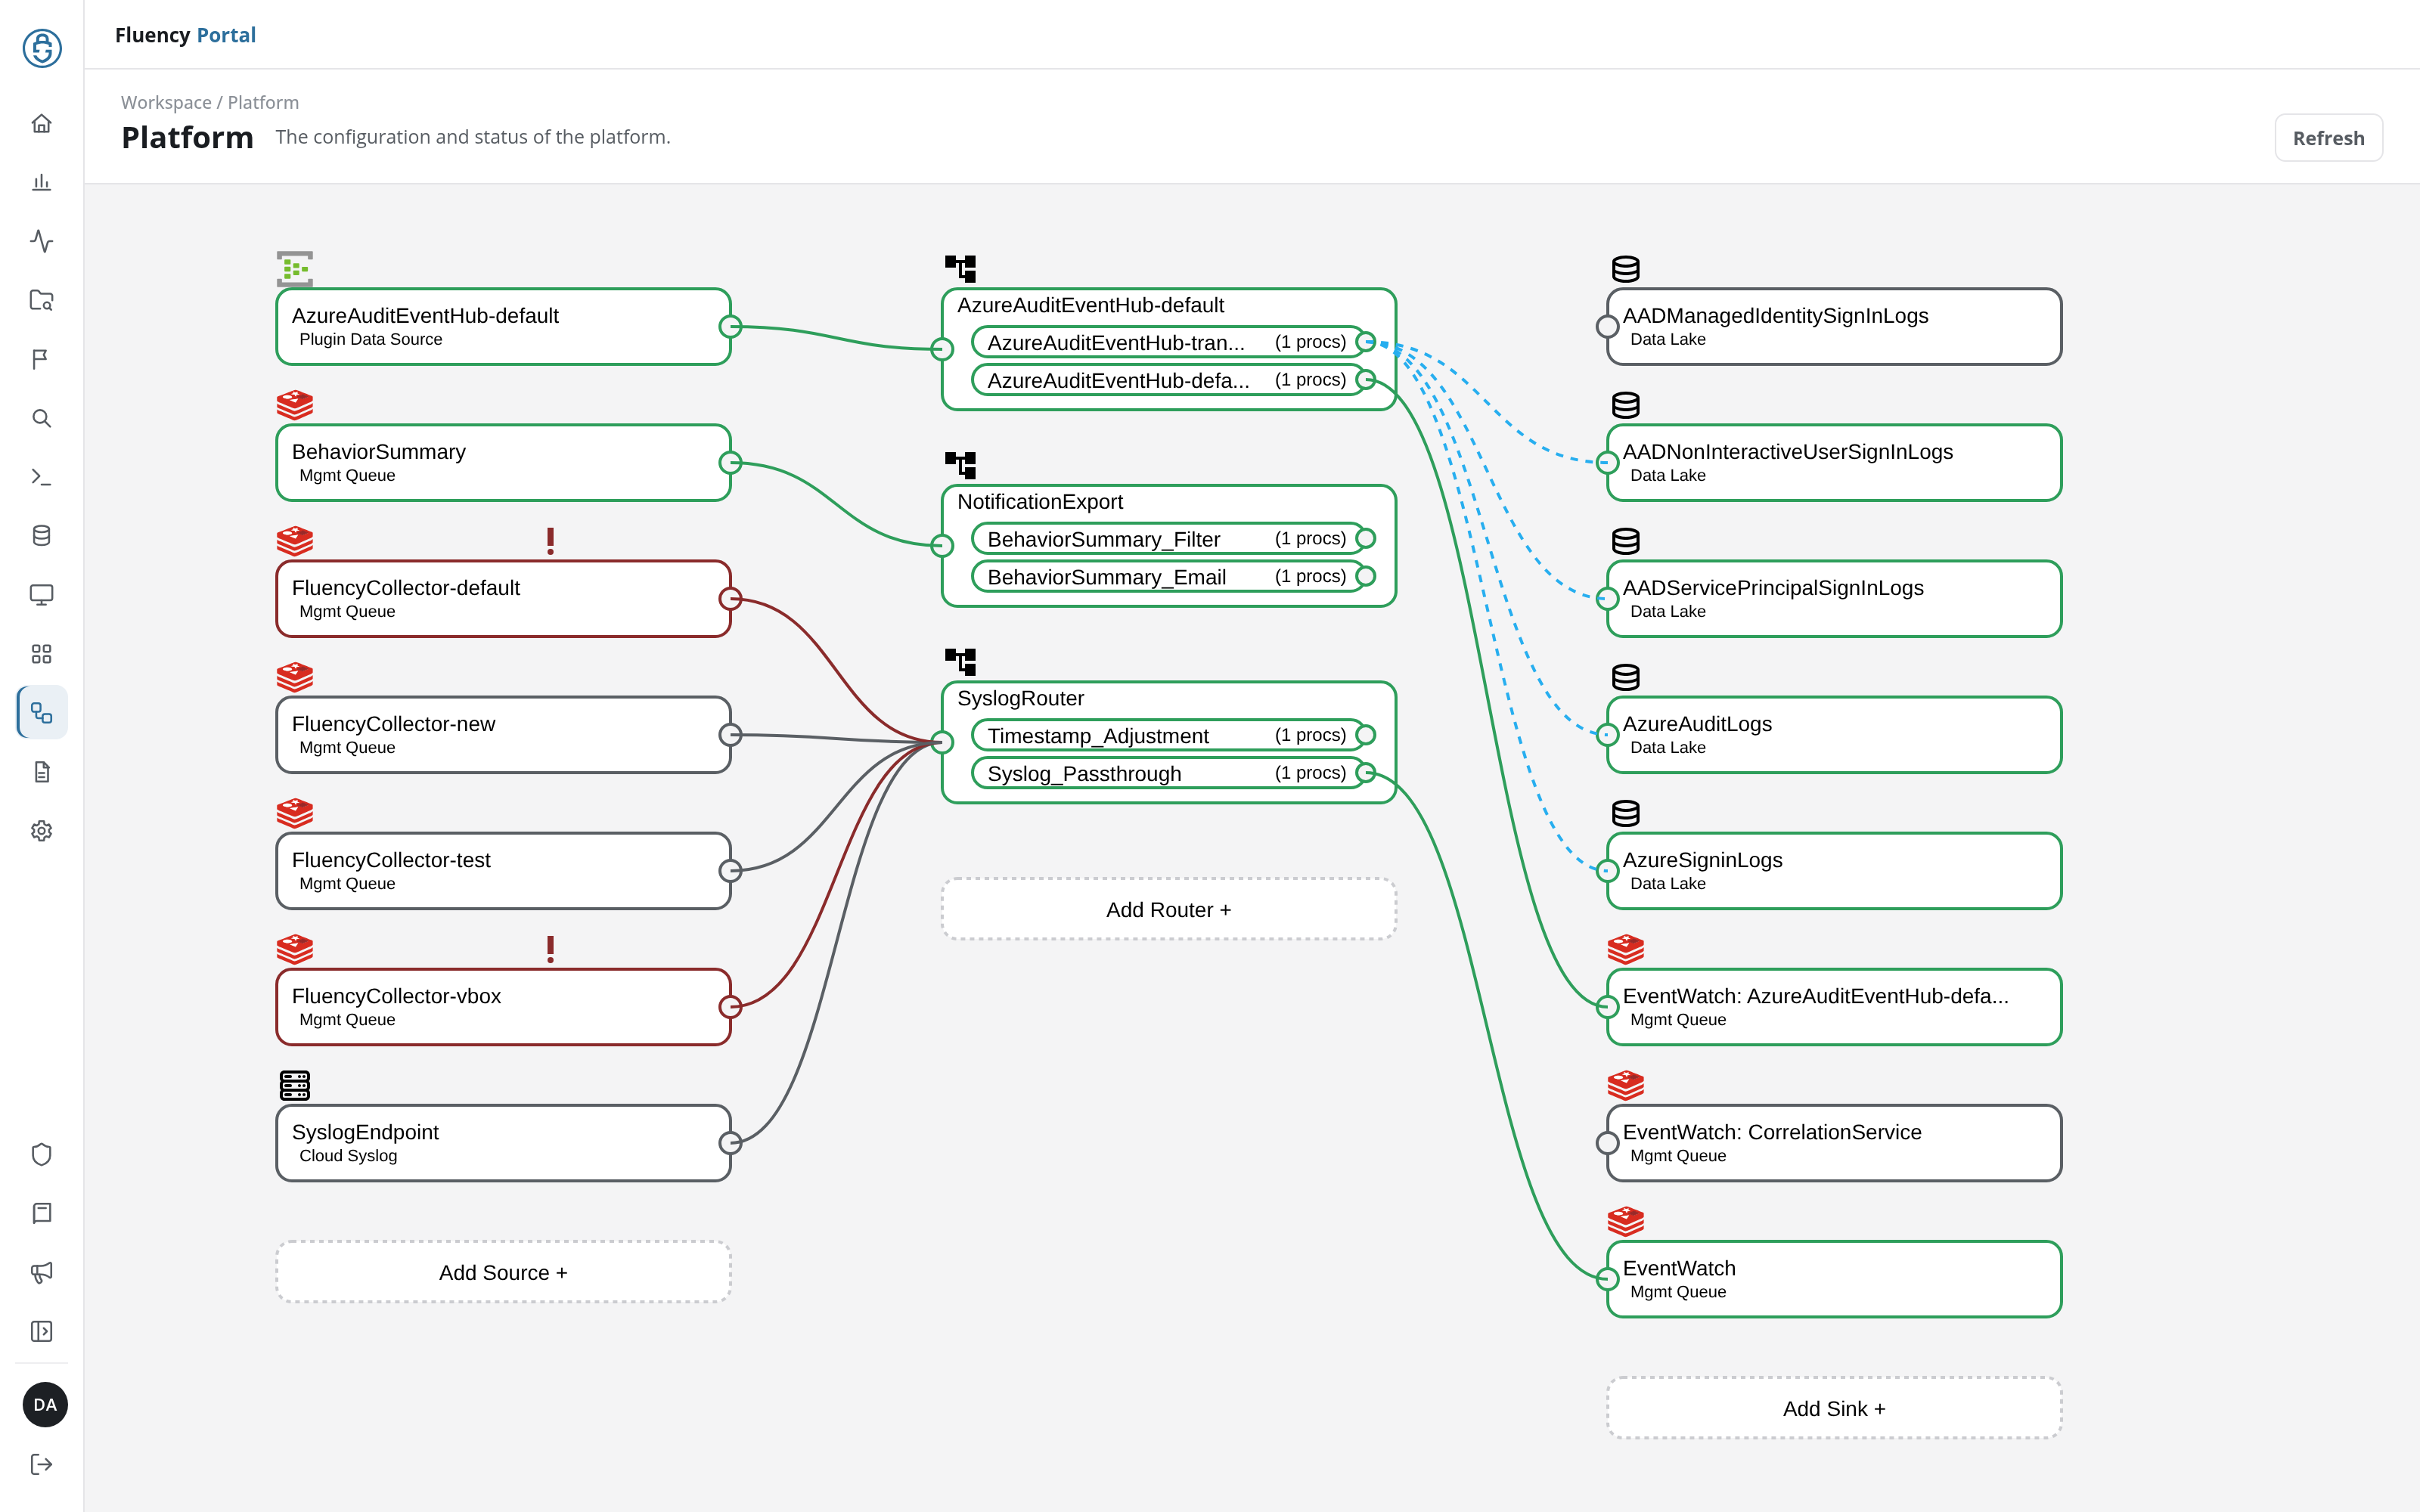
The Platform page is a live diagram of the data pipeline. It shows every source, router, and sink in the account, the processor pipes inside each router, the connections between them, and their current activity. Every card in the diagram opens a panel with that component's settings, state, and event metrics.
Menu path: Platform · URL path: /v2/platform
Task guide: Pipeline Components: what sources, routers, processors, and sinks do.
Page Layout
The header shows the breadcrumb Workspace / Platform, the title Platform with the subtitle The configuration and status of the platform., and a Refresh button on the right that reloads the diagram.
The diagram is arranged in three columns, read left to right in the direction data flows:
- Sources (left): where data enters the pipeline.
- Routers (middle): where processor pipes transform and route events.
- Sinks (right): where processed data is delivered.
Each column ends with a dashed button for adding a node of that type: Add Source +, Add Router +, and Add Sink +. See Adding Components.
Node Status
Every node is a card with its name, a type label, and a type icon above it. Its outline shows its activity:
- Green outline: moving data. Above the card's upper-right corner a small green graph plots its recent volume.
- Grey outline: idle, with no graph.
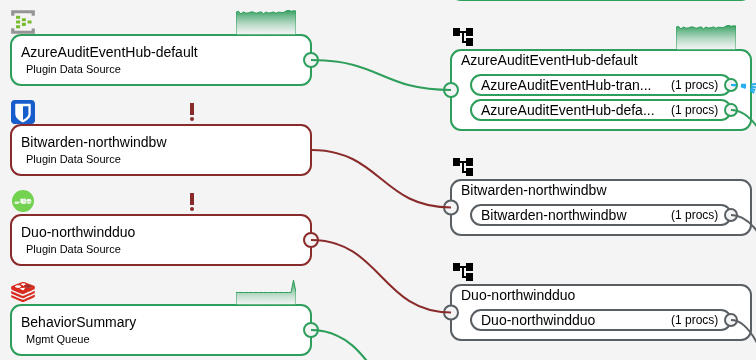
- Red outline: in error, with a red exclamation mark (!) above the card. The connection from a source in error to its router is drawn in dark red. For a source an application installed, the error is listed under Data source errors on the application's details page.
Sources
Each source card names the source and the transport that feeds it, with an icon for its type:
- Plugin Data Source: data pulled in by an installed application, marked with the vendor's icon, for example AzureAuditEventHub-default, the source of an Azure Directory Audit (Event Hub) application.
- Mgmt Queue: an internal management queue, marked with a stacked-layers icon, for example the BehaviorSummary feed and one queue per Fluency Collector (FluencyCollector-default, FluencyCollector-new, and so on).
- Cloud Syslog: the cloud syslog endpoint (SyslogEndpoint), marked with a server icon.
A source's panel and the source types you can add are described in Sources.
Routers
Each router card, marked with a branching icon, lists the pipes it runs. A pipe row shows the pipe's name and its processor count, such as (1 procs); long names are cut short with an ellipsis. In the example:
- AzureAuditEventHub-default runs a transform pipe and a default pipe for the event hub source.
- NotificationExport runs BehaviorSummary_Filter and BehaviorSummary_Email, fed by the BehaviorSummary queue.
- SyslogRouter runs Timestamp_Adjustment and Syslog_Passthrough, fed by the collector queues and the cloud syslog endpoint.
The router, pipe, and processor panels are described in Routers.
Sinks
Each sink card shows the sink's name and type:
- Data Lake: delivery into a data lake index, marked with a database icon, here five Entra ID indexes, from AADManagedIdentitySignInLogs to AzureSigninLogs.
- Mgmt Queue: delivery into an internal queue, marked with a stacked-layers icon. These are the EventWatch sinks: a general EventWatch sink and per-feed sinks, which the diagram labels EventWatch: followed by the feed, such as EventWatch: CorrelationService. Elsewhere (the sink's panel title, its Name, and a pipe's Attach data sink list), a per-feed sink goes by the bare feed name, such as CorrelationService.
A sink's panel and the sink types you can add are described in Sinks.
Connections
Small circular ports sit on the edges of each card: a source's on its right, a sink's on its left, and a router's input on its left with one output per pipe on its right. Lines between the ports trace the path events take:
- Solid green: a connection carrying data.
- Solid grey: a connection from an idle node.
- Dashed blue: in the example, the lines that fan out from the AzureAuditEventHub transform pipe to the Entra ID index sinks its processor writes to. The pipe's panel lists these sinks under Implicit Sink Connections.
Making a Connection
Connections are drawn by clicking two ports, output first. The browser asks you to confirm each one, and the notice Connection Updated Successfully follows; the new line is drawn solid grey until data flows through it.
- Source to router: click the source's output port (it fills blue), then the router's input port. The confirmation, Adding Source Connection, asks Are you sure you want to connect followed by the source and the router. A source can be connected while it is active.
- Pipe to sink: click the output port of the pipe's row, then the sink's input port. The confirmation, Adding Pipe Connection, names the sink first: Are you sure you want to connect followed by the sink and the pipe. The sink is added to the pipe's DATA SINKS.
To remove a connection, use the panels: Disconnect Source From Router on an inactive source's panel (see Source Panel), and Detach followed by Save pipe on a pipe's panel (see Pipe Panel).
Component Panels
Click a card (a source, a router's title, one of a router's pipe rows, or a sink) to open that component's panel over the right half of the page. The diagram stays in view, dimmed, on the left.
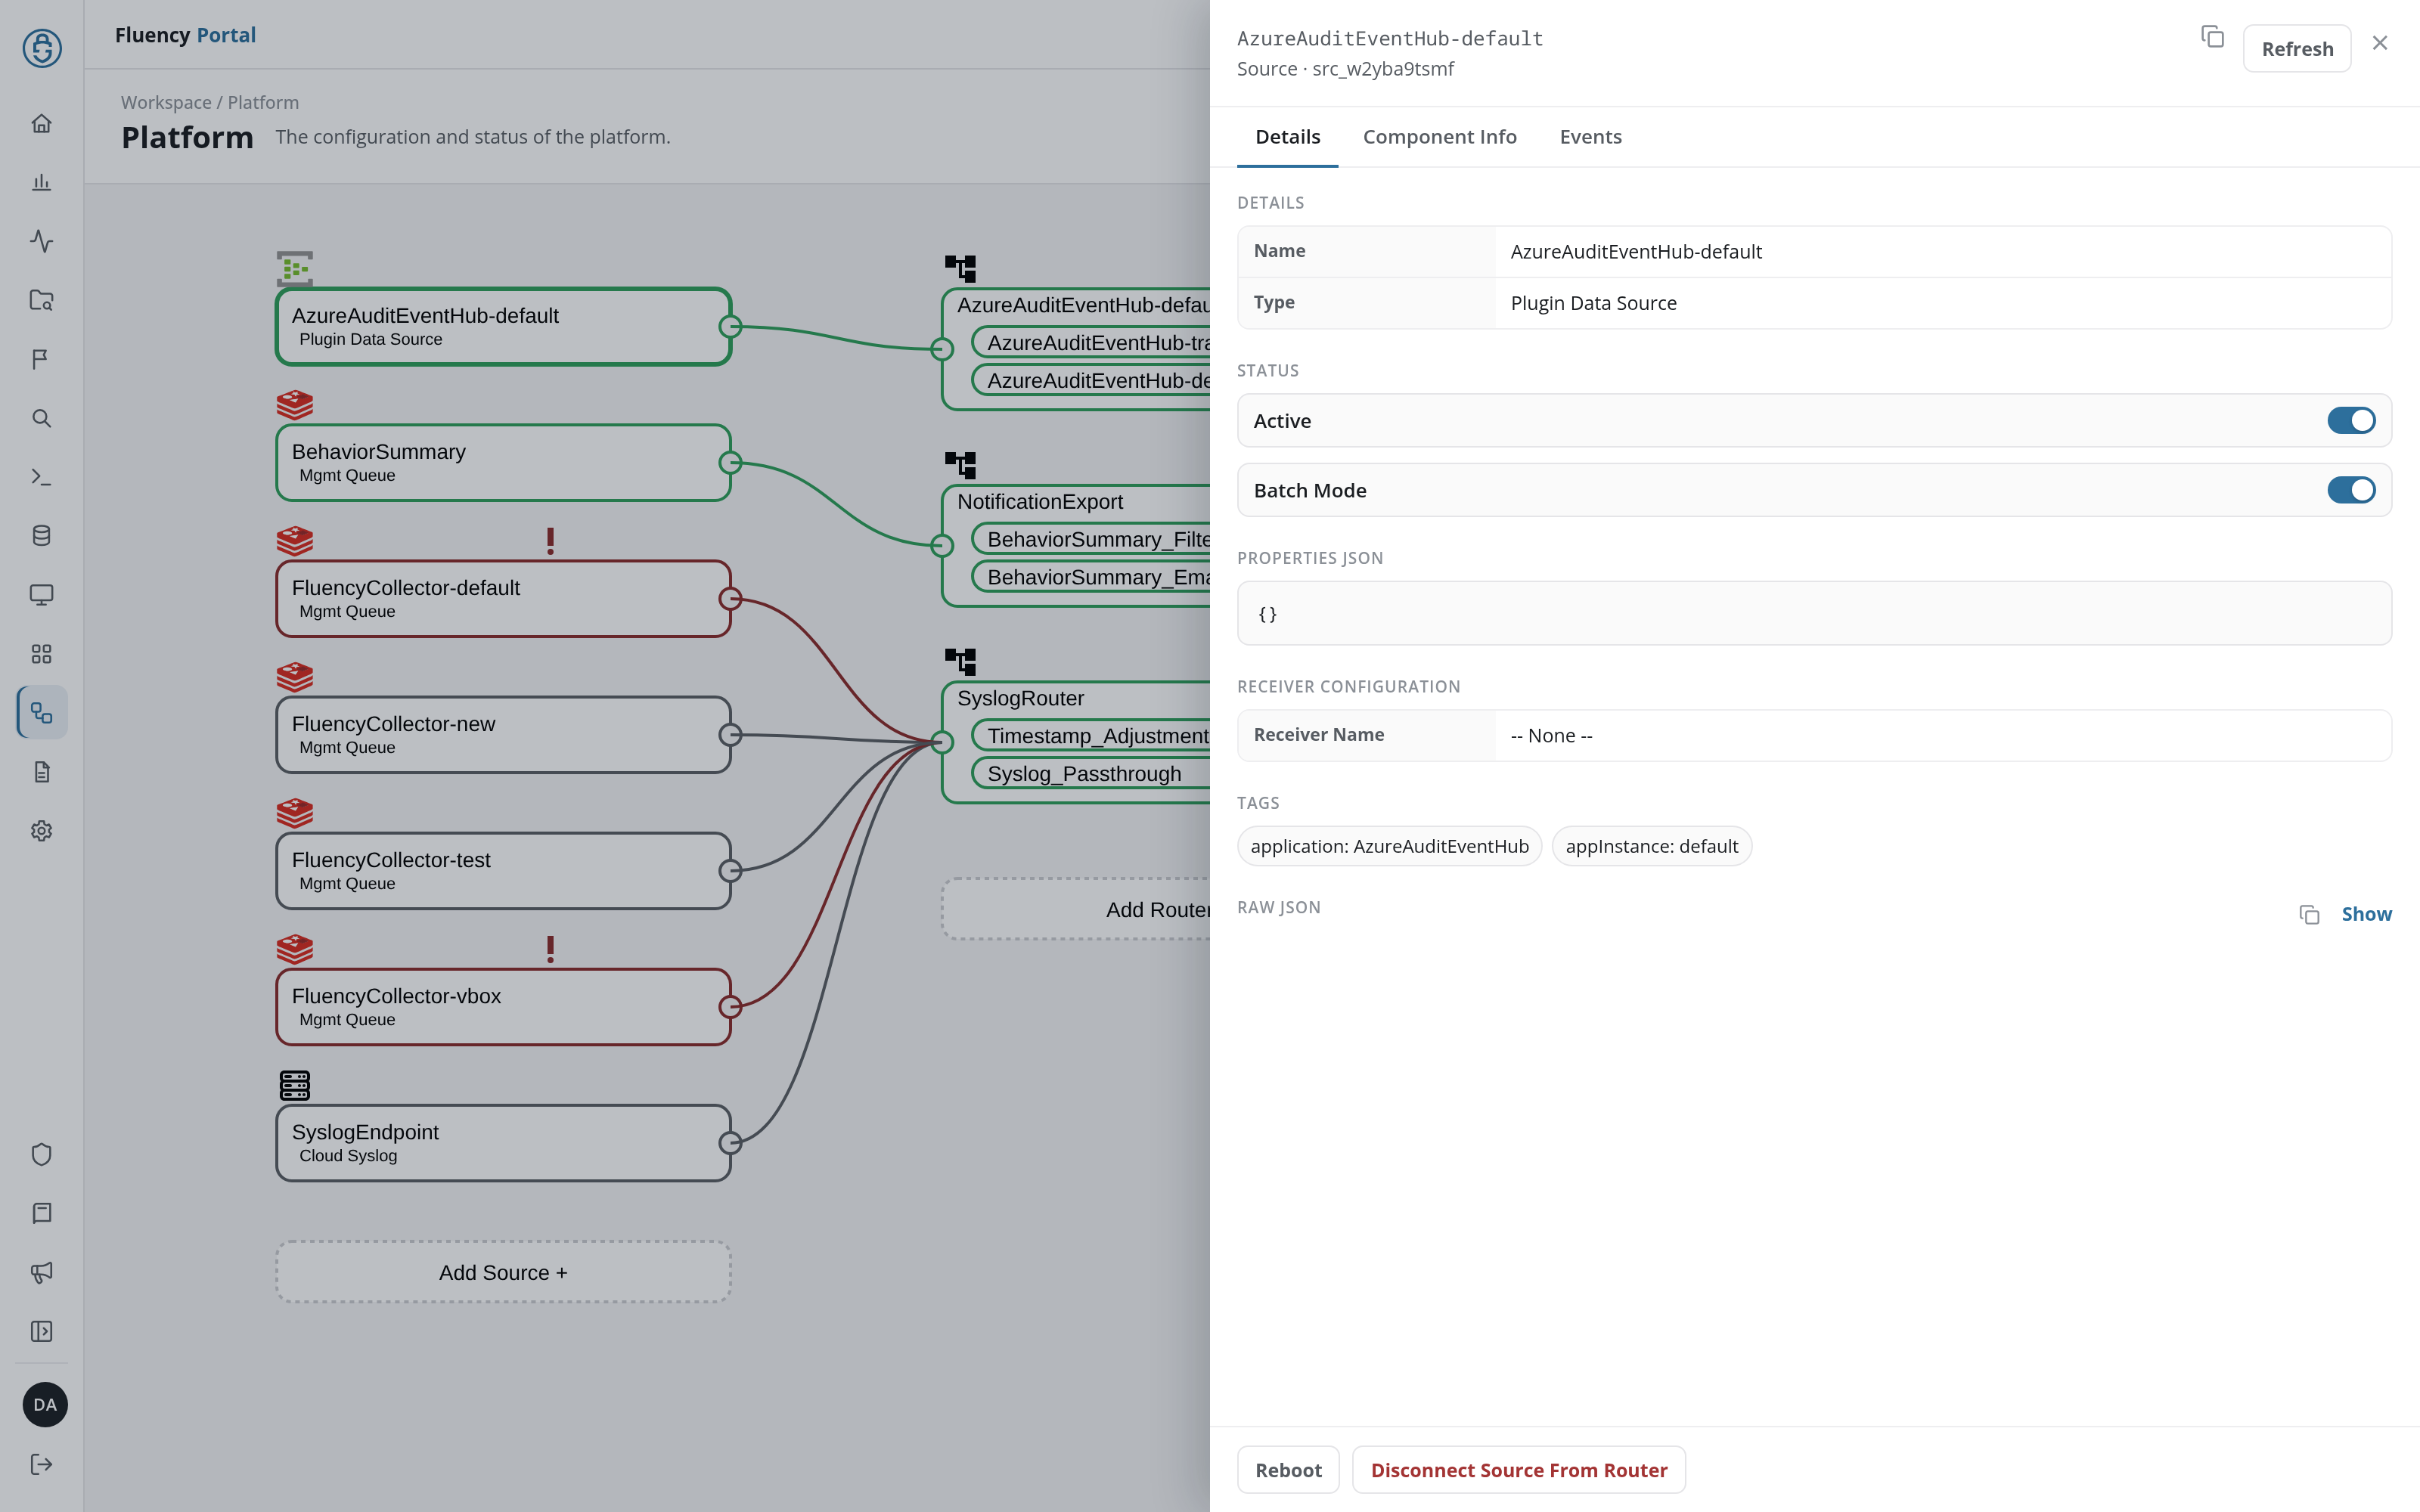
Every panel has the same frame:
- Header: the component's name and, beneath it, its kind and ID, such as Source · src_w2yba9tsmf. On the right are a copy icon (Copy JSON), which copies the component's definition, Refresh, which reloads the panel, and ×, which closes it.
- Tabs: Details, the component's settings; Component Info, its runtime state (sources, routers, and sinks); and Events, its event metrics and recent events.
- Raw JSON: at the end of the Details tab, the component's definition as JSON: Show displays it, and the copy icon copies it.
- Footer: the actions for that component: Reboot and either Disconnect Source From Router (while the source feeds a router) or Delete (once it feeds none) for a source, Delete for a router or a sink, Remove From Router for a pipe, Remove From Pipe for a processor.
| Panel | Opened by | Described in |
|---|---|---|
| Source | a source card | Sources |
| Router | a router card's title | Routers |
| Pipe | a pipe row inside a router card | Routers |
| Processor | View on a pipe's processor, or a processor link in the router panel | Routers |
| Sink | a sink card | Sinks |
Events Tab
The Events tab works the same way on every panel. EVENT METRICS charts the component's traffic over the period chosen in the list on the right, Last Hour, Last 8 Hours (the default), Last 24 Hours, Last 7 Days, or Last 30 Days:
- BYTES (UTC) and COUNT (UTC): the volume and the number of events, one line per series. The series depend on the component: input and error for a source; input, pass, drop, error, and ignored for a router; pass, abort, drop, and error for a pipe or a processor; output and compressed for a sink, plus error on a management queue or webhook sink.
- PERCENT (%) (UTC): on routers and sinks, how full the component's buffer is.
Each series' legend entry gives its last, avg, and max values and a trend figure (↑ or ↓ with an amount). Below the charts, EVENT LOGS shows the component's most recent events as JSON, or No events found.
Adding Components
The dashed button at the foot of each column opens a panel for adding a component of that type. Each panel ends with Save, which creates the component; × closes it without saving.
| Button | Panel | Described in |
|---|---|---|
| Add Source + | Adding Data Source | Adding a Source: ten source types, from Plugin Data Source to Mgmt Queue |
| Add Router + | Adding Router | Adding a Router |
| Add Sink + | Adding Data Sink | Adding a Sink: eleven sink types, from AWS S3 to Mgmt Queue |
Installed Applications
An application installed from the Application Catalog adds its components to the diagram, named after its template ID and instance name (<template>-<instance>). A template that collects through an API adds a Plugin Data Source card, a router of the same name with one pipe, and a Mgmt Queue sink labeled EventWatch: <template>-<instance>. A syslog template such as Cisco ASA Syslog adds no source: it adds a pipe named <template>-<instance> to SyslogRouter, and its sink. The components carry the tags application: with the template ID and appInstance: with the instance name. Uninstalling the application removes them.