Application Details
The application details page shows a single installed application: its current state and traffic, the pipeline components it installed, the parameters it was installed with, and the setup actions its installation carried out. It opens from a row or card on the Applications page.
Menu path: Applications → an application's row · URL path: /v2/applications/detail?application=<template>&instance=<instance name> (for example /v2/applications/detail?application=AzureAuditEventHub&instance=default)
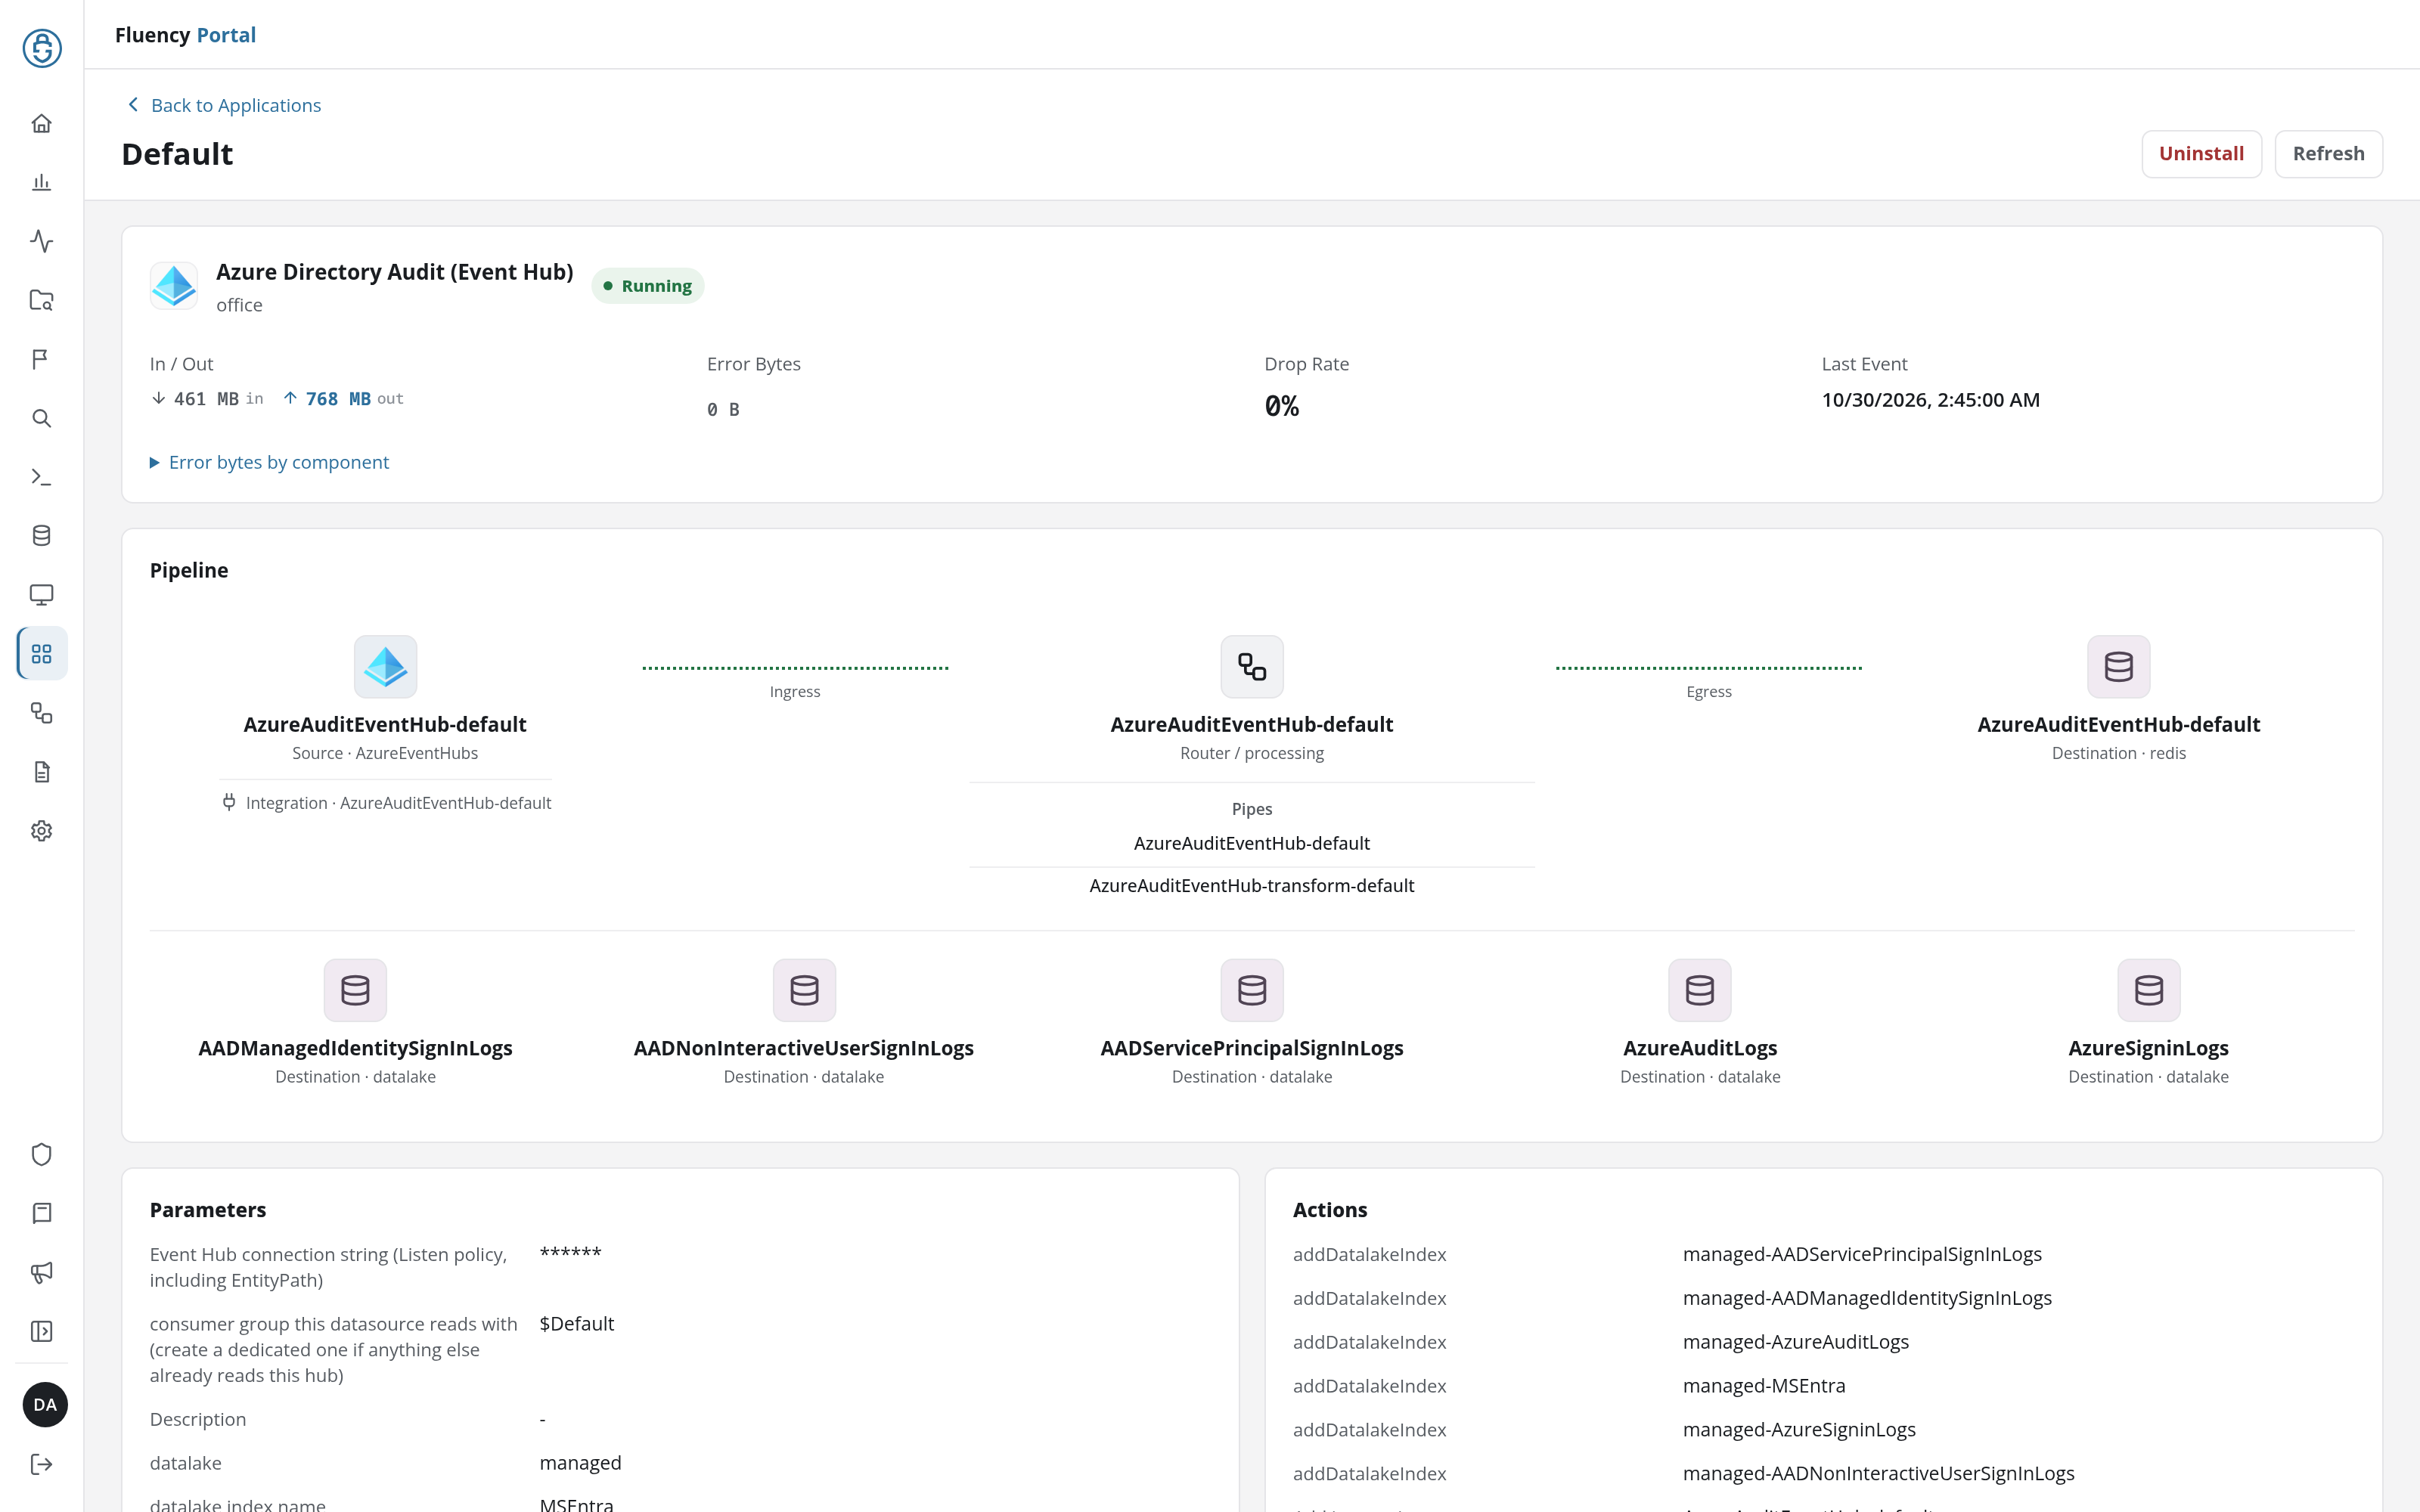
Page Layout
The header carries a Back to Applications link above the title (the instance's display name, such as Default) and two buttons on the right: Uninstall, in red, which removes the application (see Uninstall), and Refresh, which reloads the page's data. Below it the page is a stack of cards:
- Summary: the application, its state, and its traffic.
- Pipeline: the components the application installed.
- Parameters or Outputs (left) and Actions (right): side by side at the bottom. An application with neither a Parameters nor an Outputs card, such as Fluency Syslog Endpoint, shows Actions alone, on the left.
Summary
The top card names the application (for example Azure Directory Audit (Event Hub)) with its icon and category beneath it (such as office or system), followed by its status badge: Running, Inactive, Waiting for consent, or Error. An application that is not running also shows its state as a grey label beside the badge.
Four figures follow:
- In / Out: the data received and sent.
- Error Bytes: the bytes the application reported as errors.
- Drop Rate: the share of data dropped, as a percentage.
- Last Event: the date and time of the most recent event.
A dash stands in for a figure the application has not reported. Error bytes by component, beneath the figures, is a collapsed section: click it to list the error bytes per pipeline component. When there are none it reads No error bytes reported., and an application that has reported no metrics at all (one still waiting for consent, for example) reads No error-byte metrics available.
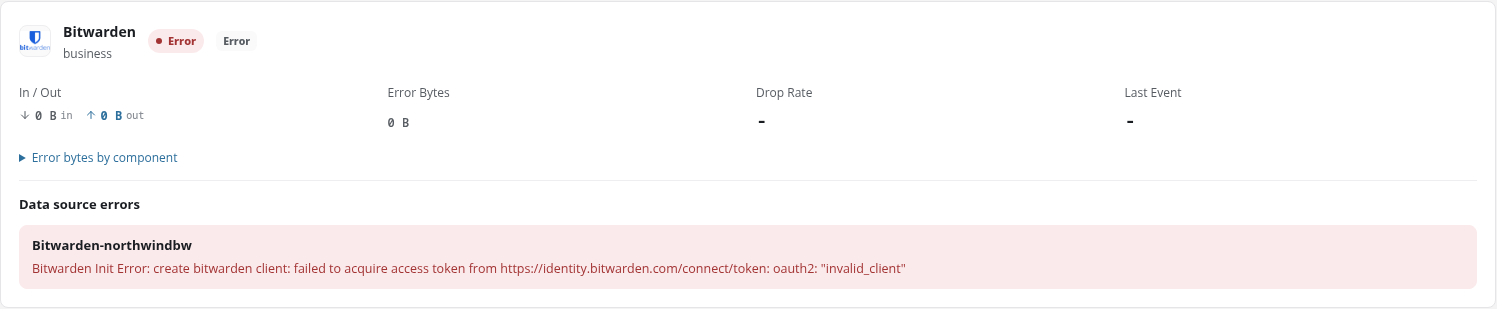
Data Source Errors
When one of the application's sources fails, the summary card ends with a Data source errors section: one red box per failing source, headed with the source's name (<template>-<instance>, as on the Platform diagram) and holding the error the source reported, such as a credential the vendor rejected.
Configure NXLog
A Windows Server w/ NXLog application has one more card, between the summary and the pipeline: Configure NXLog, with the line Build an nxlog.conf for this Windows server. Choose the syslog endpoint, which event logs to collect, and whether to include Sysmon. Its Configure NXLog button opens the NXLog Configuration Download Wizard (Choose the syslog endpoint and the Windows logs this agent should forward.), in three steps, 01 General Settings, 02 Logging Configurations and 03 Advanced Logging Settings, each ticked off once passed. Next and Back move between them, Cancel or × closes the wizard, and Download on the last step saves the file as nxlog.conf. The wizard builds the file in the browser and changes nothing on the platform.
| Step | Field | Default | Options |
|---|---|---|---|
| General Settings | Fluency Endpoint URL | <cluster>.syslog.ingext.io. | Text |
| General Settings | Port | 6514 | Number |
| General Settings | Mode | TCP (w/TLS) | UDP, TCP, TCP (w/TLS); with TCP (w/TLS), a Download CA Certificate link to the cloud endpoint's CA bundle |
| General Settings | Version | NXLog CE 3.x | NXLog CE 2.x (legacy), NXLog CE 3.x |
| Logging Configurations | Windows Event Logs: Application, Security, System, Power Shell, Windows Defender | All ticked but Windows Defender | Checkboxes |
| Logging Configurations | Windows Internal Logs: Internal | Ticked | Checkbox |
| Advanced Logging Settings | Microsoft Sysmon: Sysmon (Additional configurations may be required to enable the following logs.) | Unticked | Checkbox |
| Advanced Logging Settings | Historical Events: Send events already in the event logs | Unticked | Checkbox; ticked, it shows On its first start, NXLog sends every event still retained in each selected event log, including Sysmon. This can be a large one-time volume. Servers that already run NXLog keep their saved position and send only new events. |
Task guide: Windows Active Directory: what to enter, and the file it produces.
Pipeline
The Pipeline card draws the components the application installed, left to right in the direction data flows:
- Source: the component that brings data in, labeled Source · and its type (for example AzureEventHubs or redis). A source fed by an integration also names it (Integration · and the integration's name).
- Ingress: the dotted connector from the source to the router.
- Router: labeled Router / processing, with the Pipes it runs listed beneath it.
- Egress: the dotted connector from the router to its first destination.
- Destinations: each labeled Destination · and its type, such as redis or datalake. Further destinations, such as the data lake indexes an application writes to, fill a row beneath the diagram.
A syslog template, such as Cisco ASA Syslog, installs no source of its own: it adds a pipe to the shared SyslogRouter, so its pipeline starts at that router, with its pipe listed under Pipes.

An application whose components are not installed yet, such as one still waiting for consent, shows No installed components.
Parameters and Outputs
The bottom-left card lists the values the application was installed with, as label–value pairs in the wording of its install form: the template's own settings and the data lake settings (datalake and datalake index name). Secrets are masked (******).
An application whose installation produced values for you to use shows them in an Outputs card instead: for a Fluency Collector, its Security token.
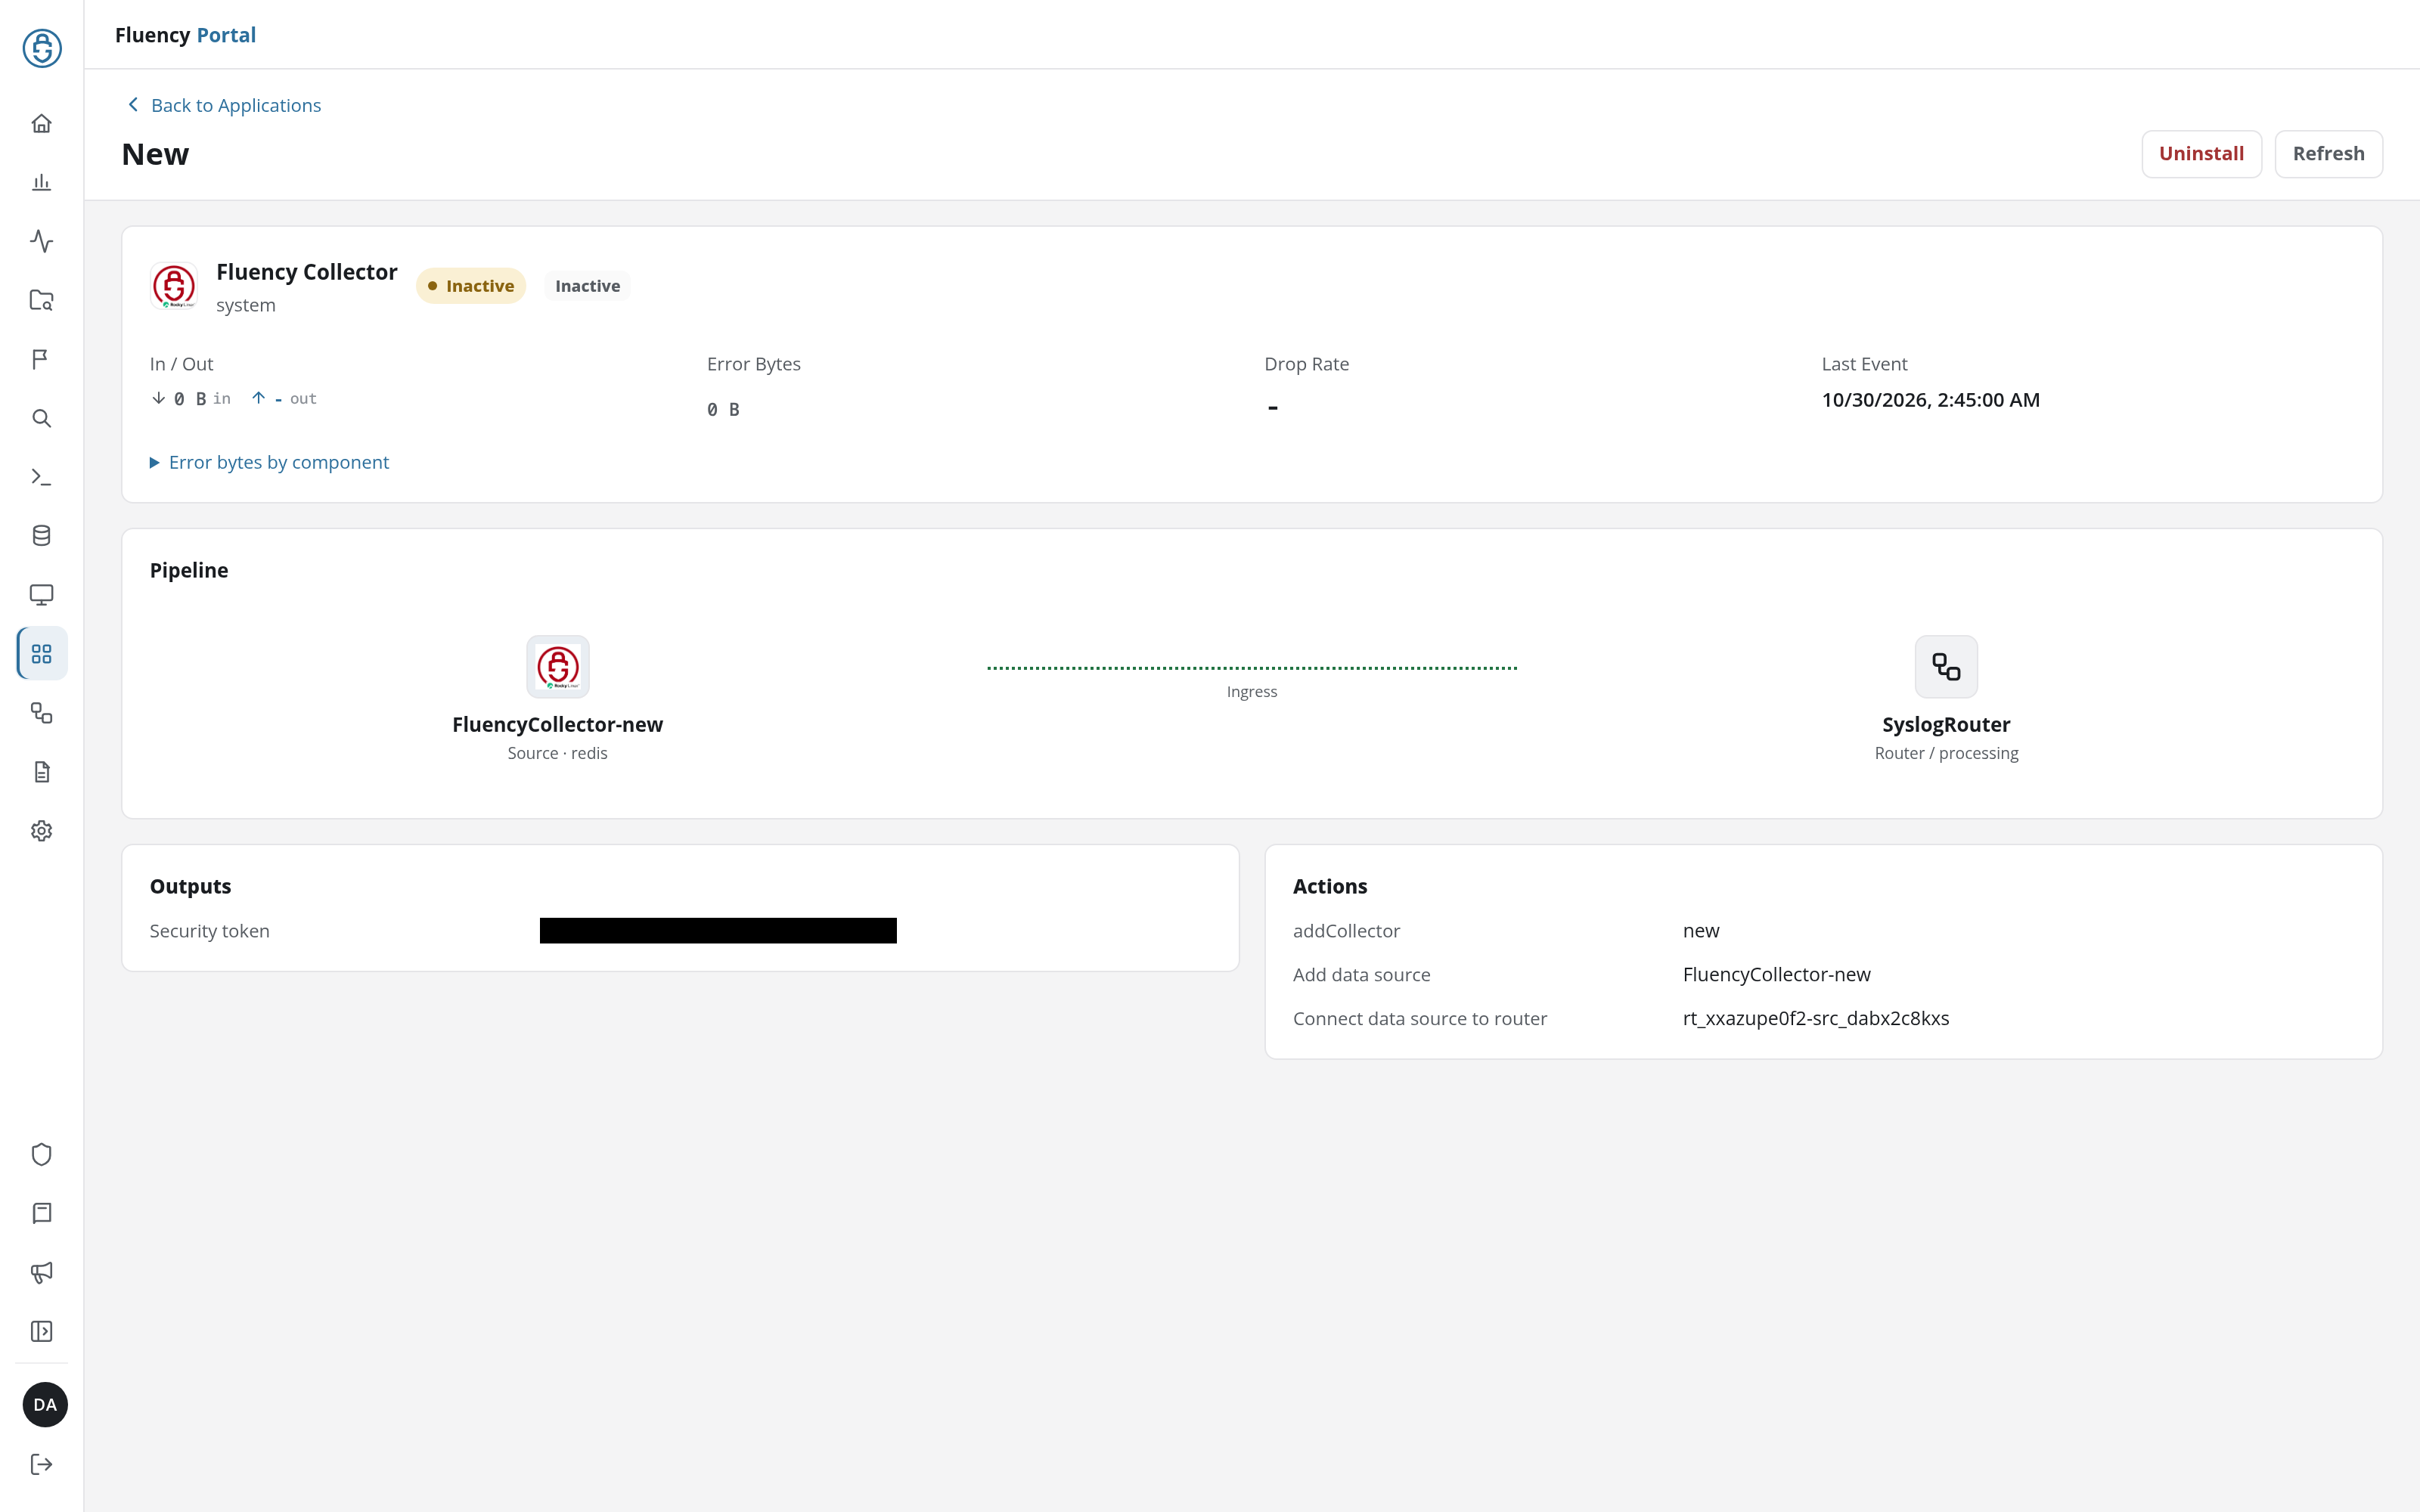
Actions
The Actions card lists the setup steps the installation carried out, each with the object it acted on: for example addDatalakeIndex with the index it added, Add integration, Add router, Add data sink, Add pipe to router, Add data source, and Connect data source to router. A syslog template such as Cisco ASA Syslog lists only addDatalakeIndex, Add data sink, and Add pipe to router. A Fluency Collector's list starts with addCollector and the collector's instance name. A Google Workspace (OAuth) application lists Sent invitation.
Uninstall
Uninstall, at the top right of the page, removes the application. The browser first asks you to confirm, naming the template and the instance (Uninstall Azure Directory Audit (Event Hub): default?) and adding This will remove the application instance and its installed components. Confirm, and the button reads Uninstalling… until the application is removed, then the Applications page opens; cancel, and nothing changes. If the uninstall fails, the error is shown at the top of the page.
The components listed under Actions go with the application, the data lake index it added among them: it leaves Applications, the Health & status list on Home, and the Platform diagram. Its old details address then reads Unknown app instance: followed by <template>-<instance>, with Retry.
Nothing on this page can be edited. To change a parameter, uninstall the application and install it again from the Application Catalog.