Events Search
Some screenshots and table controls on this page (the "expand" icon and < > code view under Base Event Record, and the older captures at the end of Page Layout) are from an older version of the interface. The current page is shown and described under Page Layout below: it adds an index selector, facet configurations, an event count timeline, data export, and investigation runs. The event record fields described below still apply.
The Events Search page addresses the review of raw events data. It is reached from Data Lake → Search in the navigation bar (/dataLake/search). The on-screen heading is Events Search, with the tagline "Database Search for all collected Events."
The page itself, control by control, is documented in the interface reference at Data Lake → Search, which is canonical for what the screen contains. This page covers what to do with it.
Page Layout
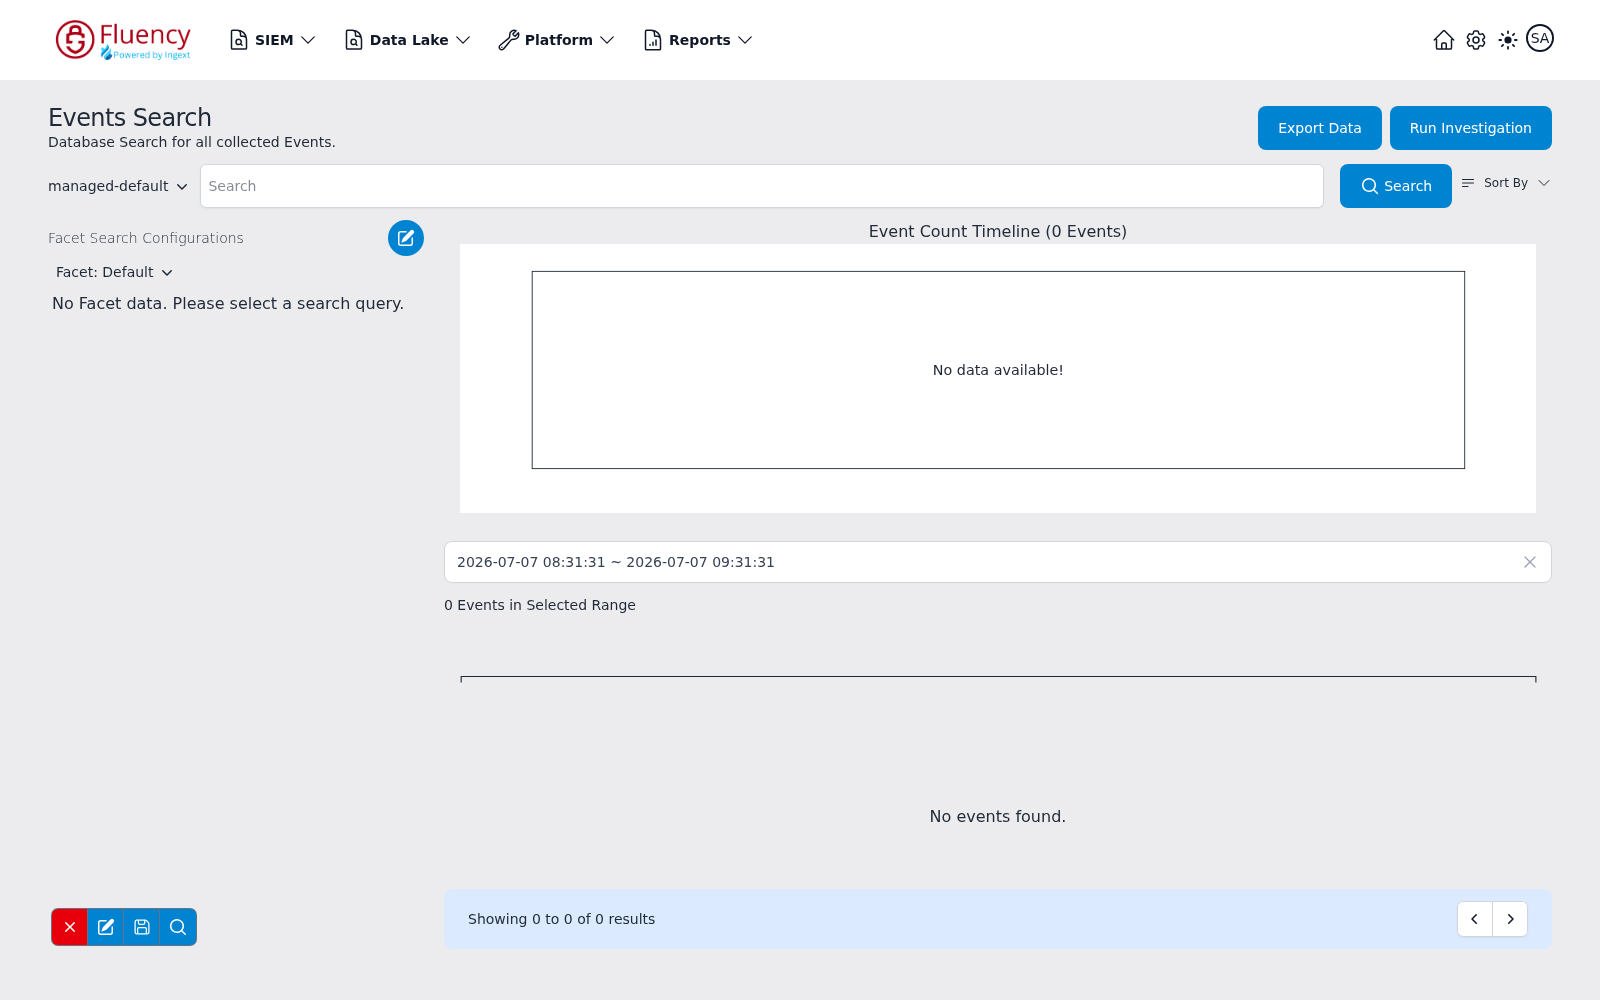
From top to bottom:
- Header — the Events Search title on the left and the Export Data and Run Investigation buttons on the right.
- Search bar — an index selector, the query input, the Search button, and a Sort By menu.
- Facet Search Configurations (left column) — the facet configuration selector, the facet groups computed from the search results, and a small facet toolbar of four icon buttons (red X, edit, save, magnifier) at the bottom left of the panel.
- Event Count Timeline (main column) — a chart of event counts over the searched period, followed by the time-range field and an Events in Selected Range counter.
- Results list — the matching events, with a Showing X to Y of Z results footer and paging arrows.
Choosing an Index
The leftmost control in the search bar shows the index the search runs against. Click it to choose among the managed indexes configured for your organization — for example managed-Office365, managed-CloudTrail, managed-default, and managed-behavior.
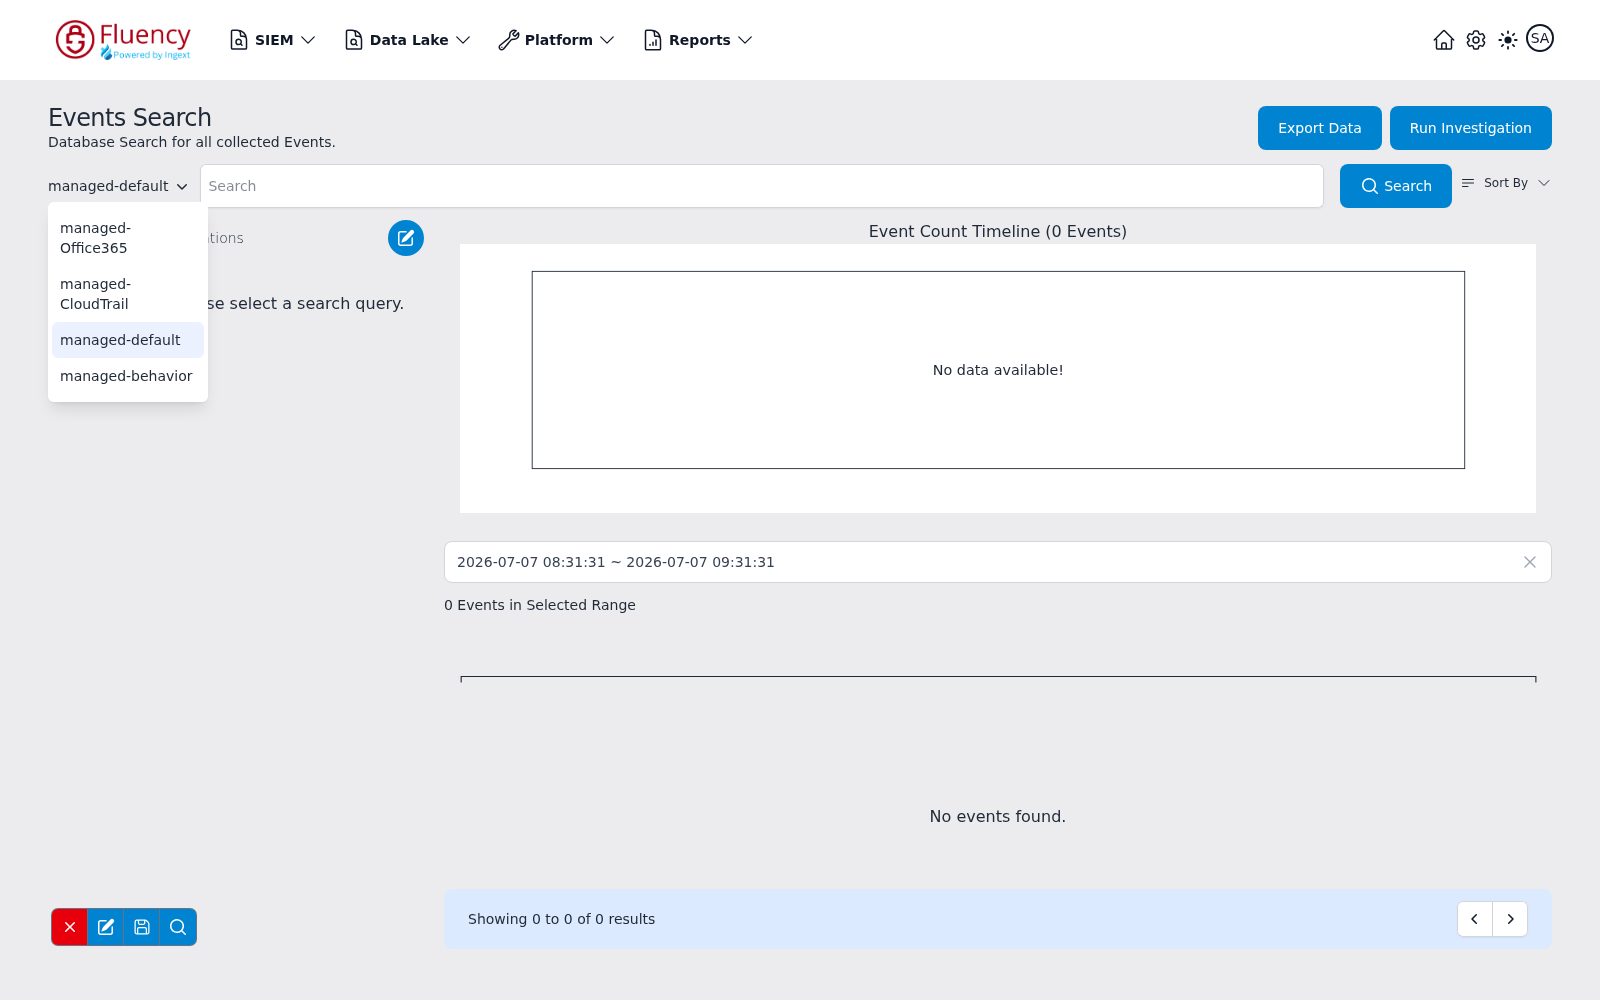
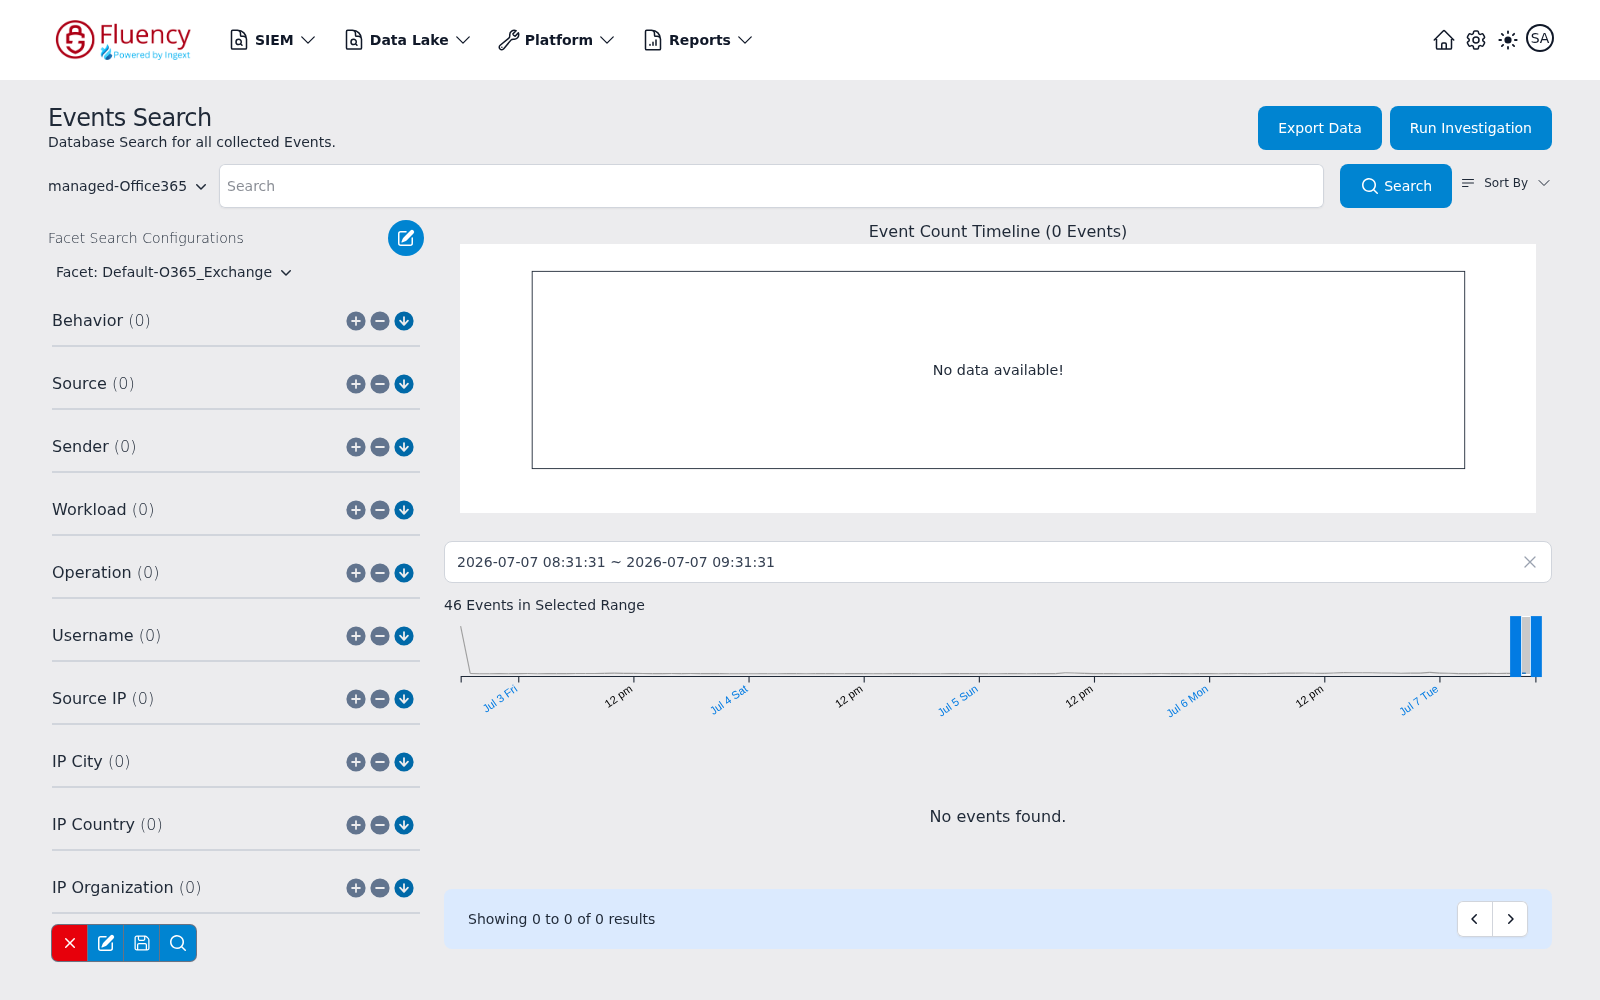
Picking a different index re-runs the search against it immediately, and also switches the facet panel to the per-source facet configuration that matches the index. Choosing managed-Office365, for example, applies the Default-O365_Exchange configuration and redraws the range strip and the Events in Selected Range counter for the new index's events.
Running the Search
Type the query into the Search field and click Search (the magnifier icon) to run it. The query, the selected index, and the time range together define what comes back. Running a search navigates to a URL that records the whole search — the query (q), the time window (from, to), the filter terms (must, not), and the index (index) — so a search can be bookmarked or shared.
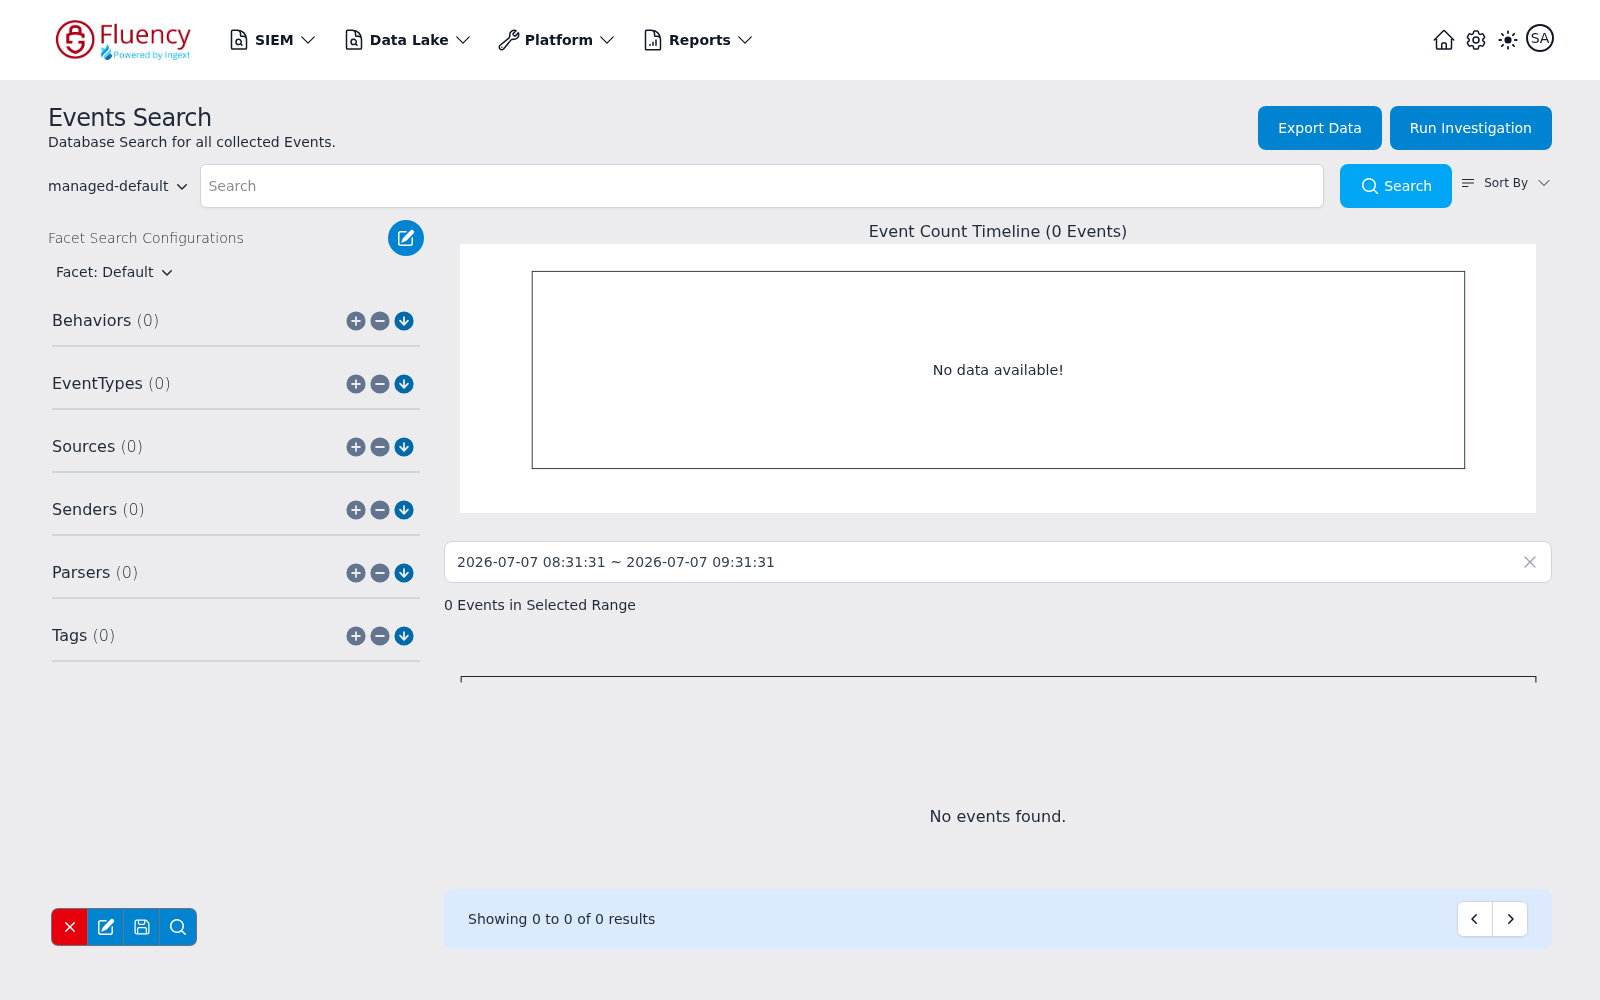
Sort By sets the order of the results list: Newest or Oldest.
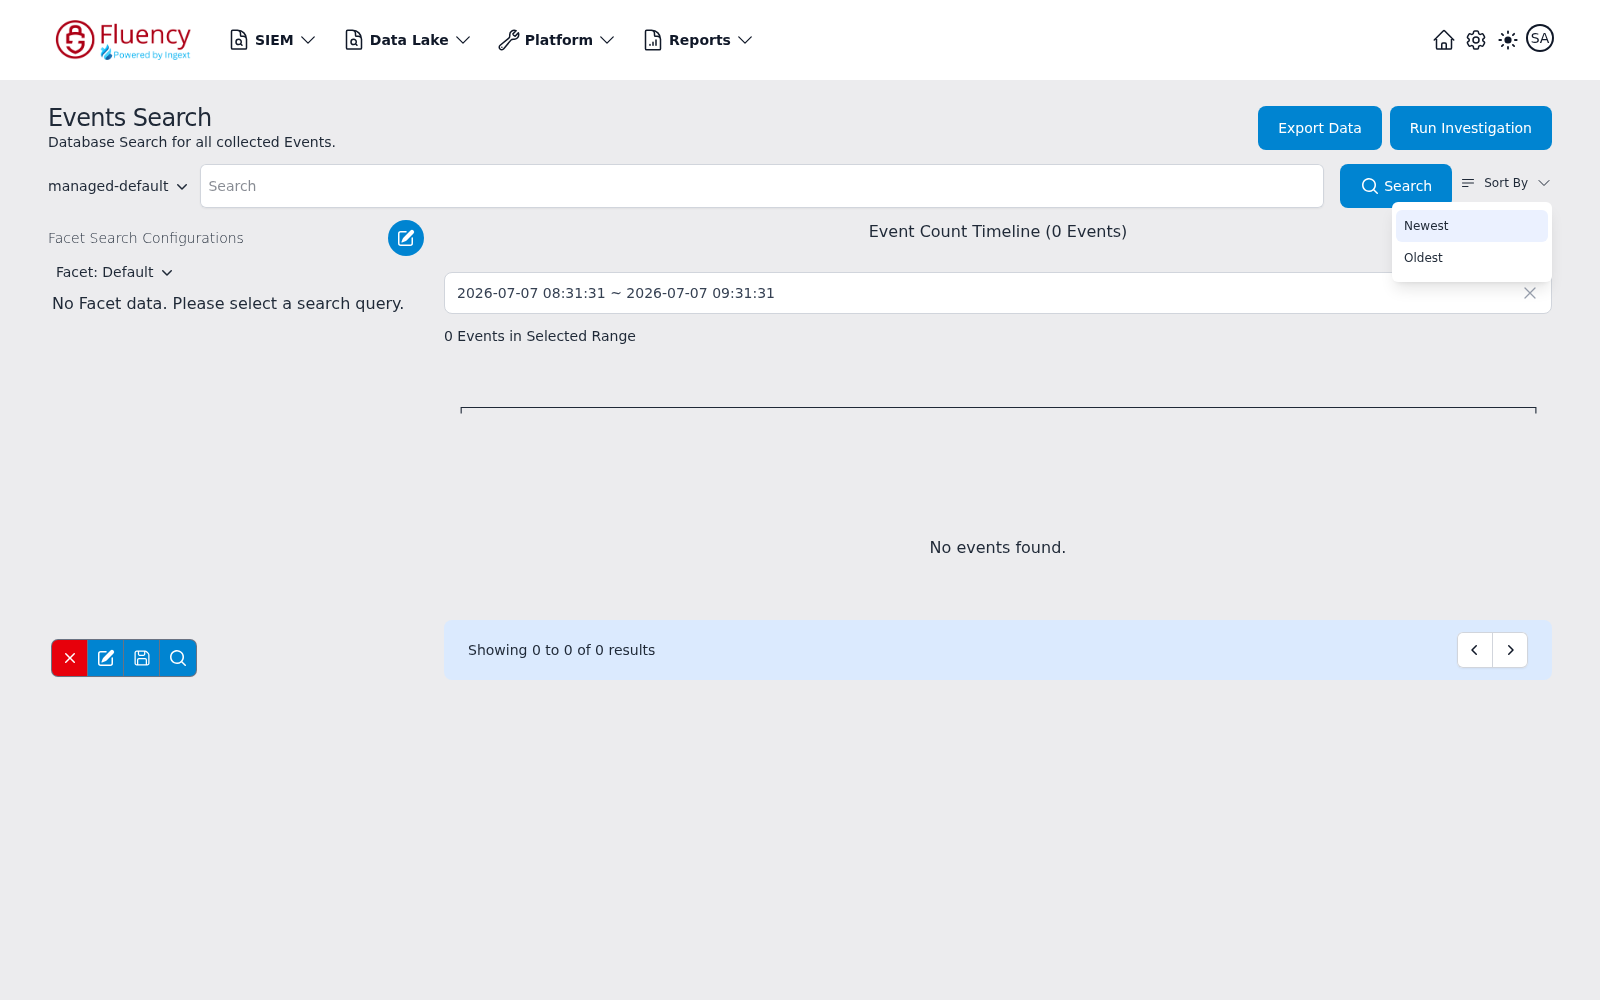
Event Count Timeline
The main column charts how many events the search matched over time; the heading gives the total, as in Event Count Timeline (0 Events), and the chart area reads No data available! when nothing matched. Below the chart, a time-range field displays the current search window as start and end timestamps (click its x to clear the range), and the Events in Selected Range line counts the events inside the currently selected portion of the timeline.
Export Data
Export Data in the page header downloads the events in the current result set. If the search returned nothing, nothing is exported and a red Export error toast appears reading No events data to download; dismiss it with its x.
Run Investigation
Run Investigation opens the Investigation Search dialog, which previews the scope and cost of running the current search as an investigation before you start it.
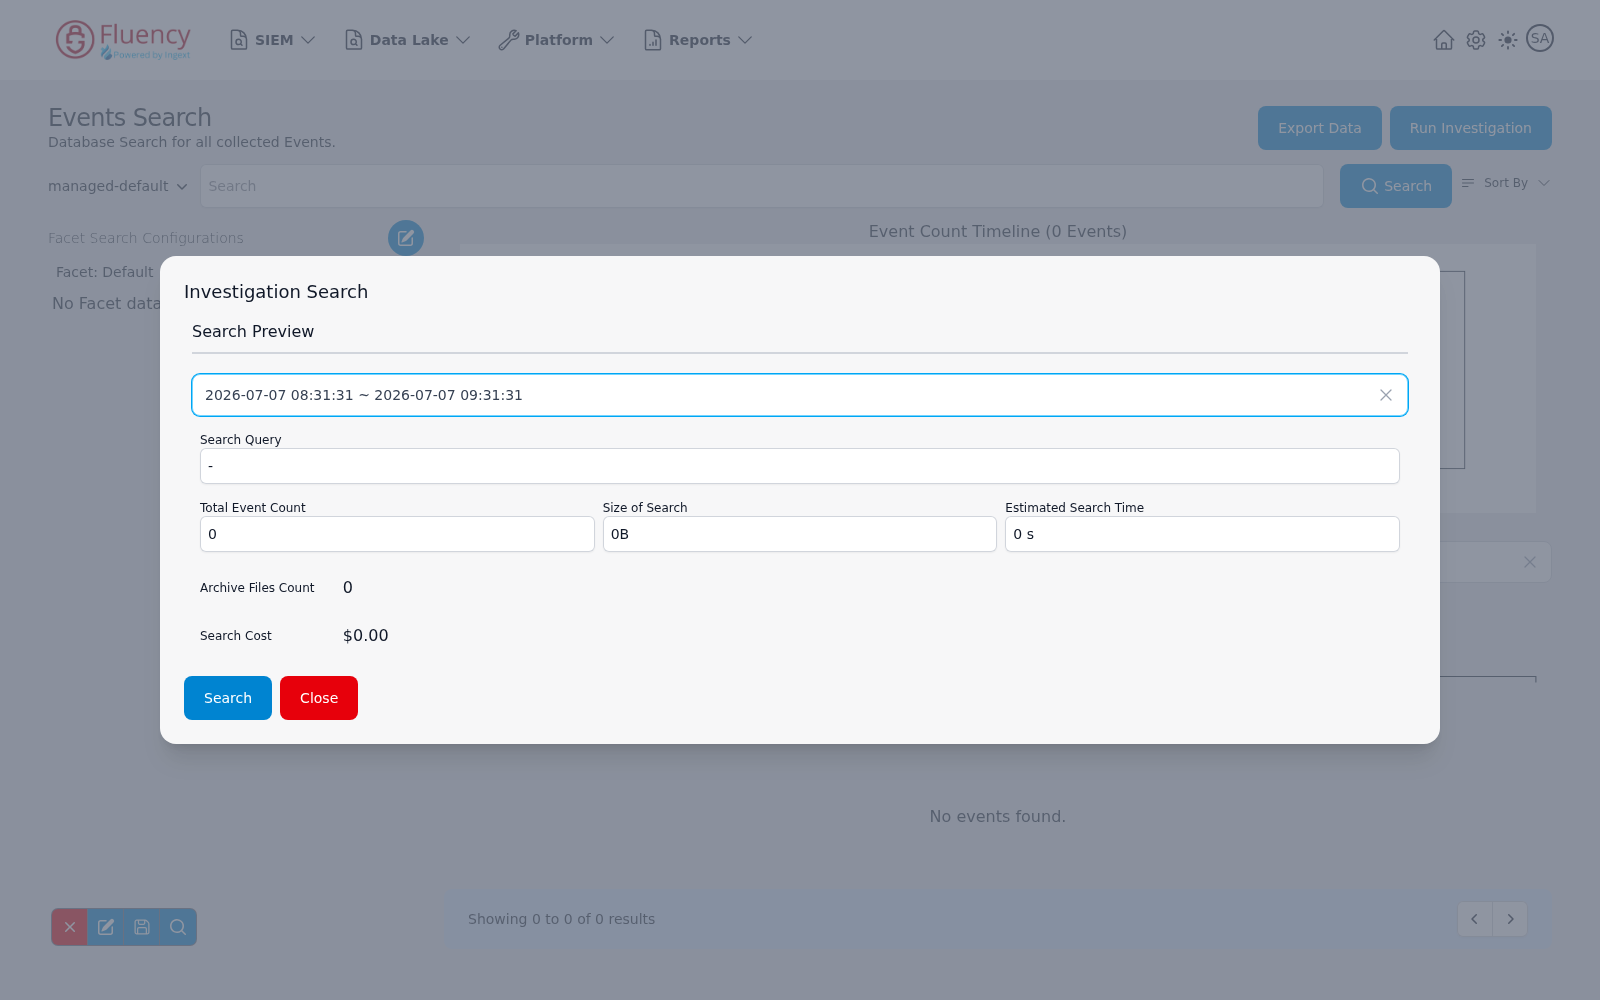
The Search Preview section shows the time range to be searched (with an x to clear it), the Search Query the investigation will run, the projected Total Event Count, Size of Search, and Estimated Search Time, the Archive Files Count the search covers, and the estimated Search Cost in dollars. Click Search to start the investigation or Close to dismiss the dialog without running it.
Runs are tracked on the Data Lake → Investigations page (/dataLake/search/history), titled Investigation History.
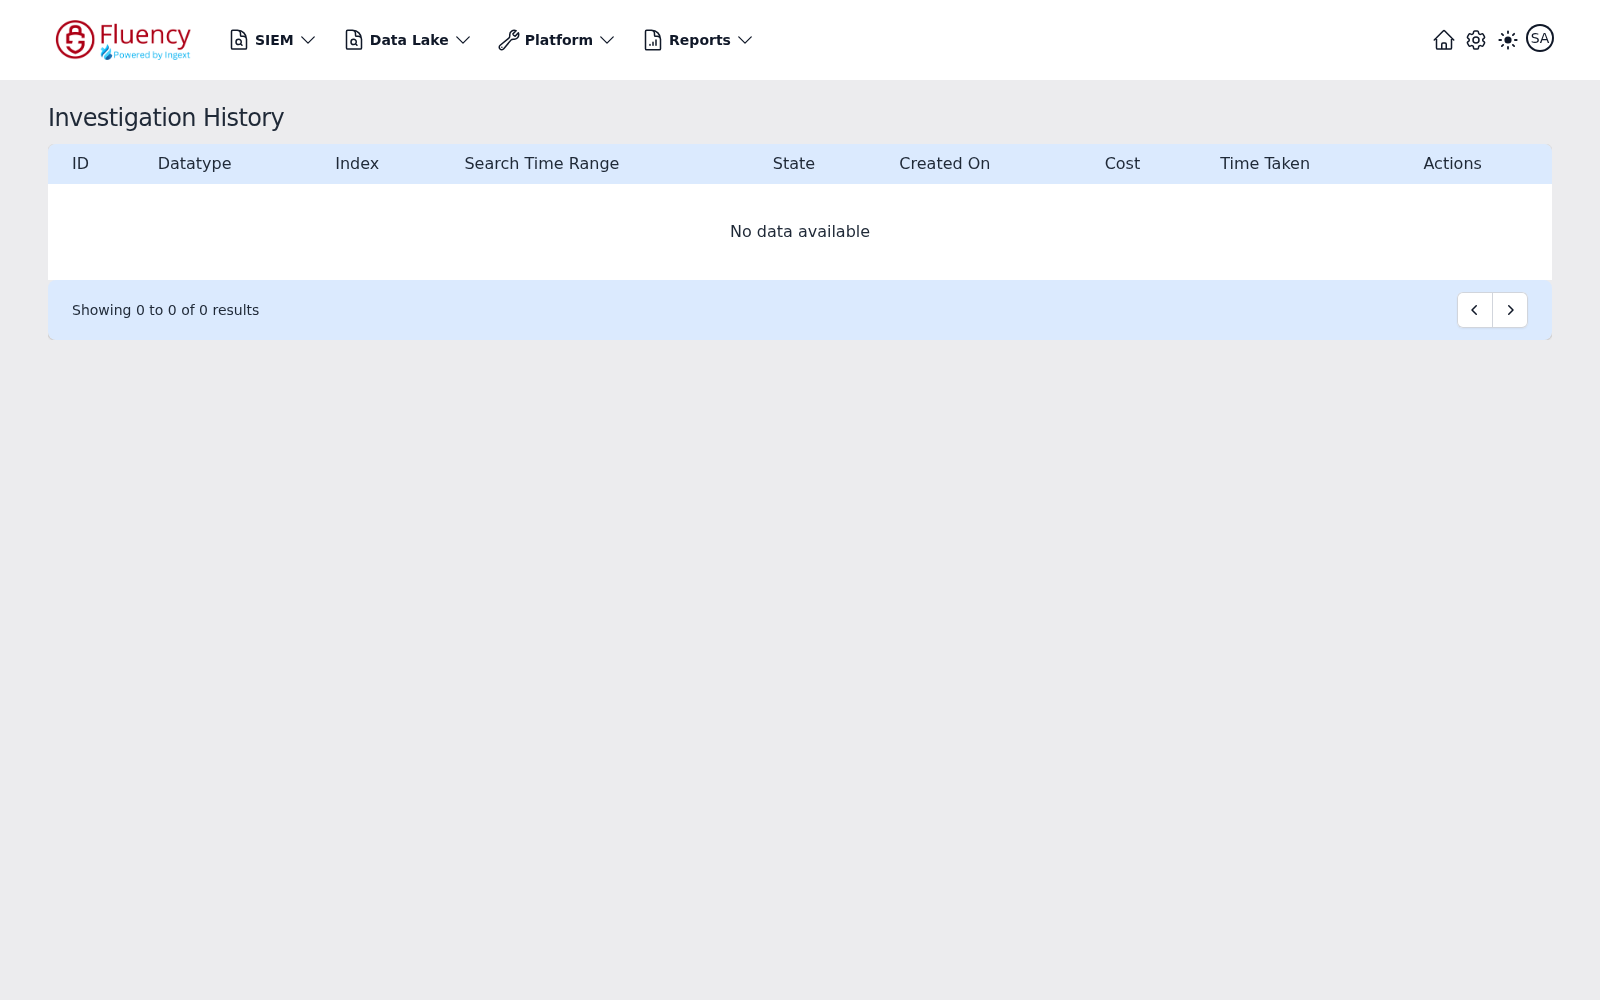
Each row is one investigation run, with the columns ID, Datatype, Index, Search Time Range, State, Created On, Cost, Time Taken, and Actions.
Older captures
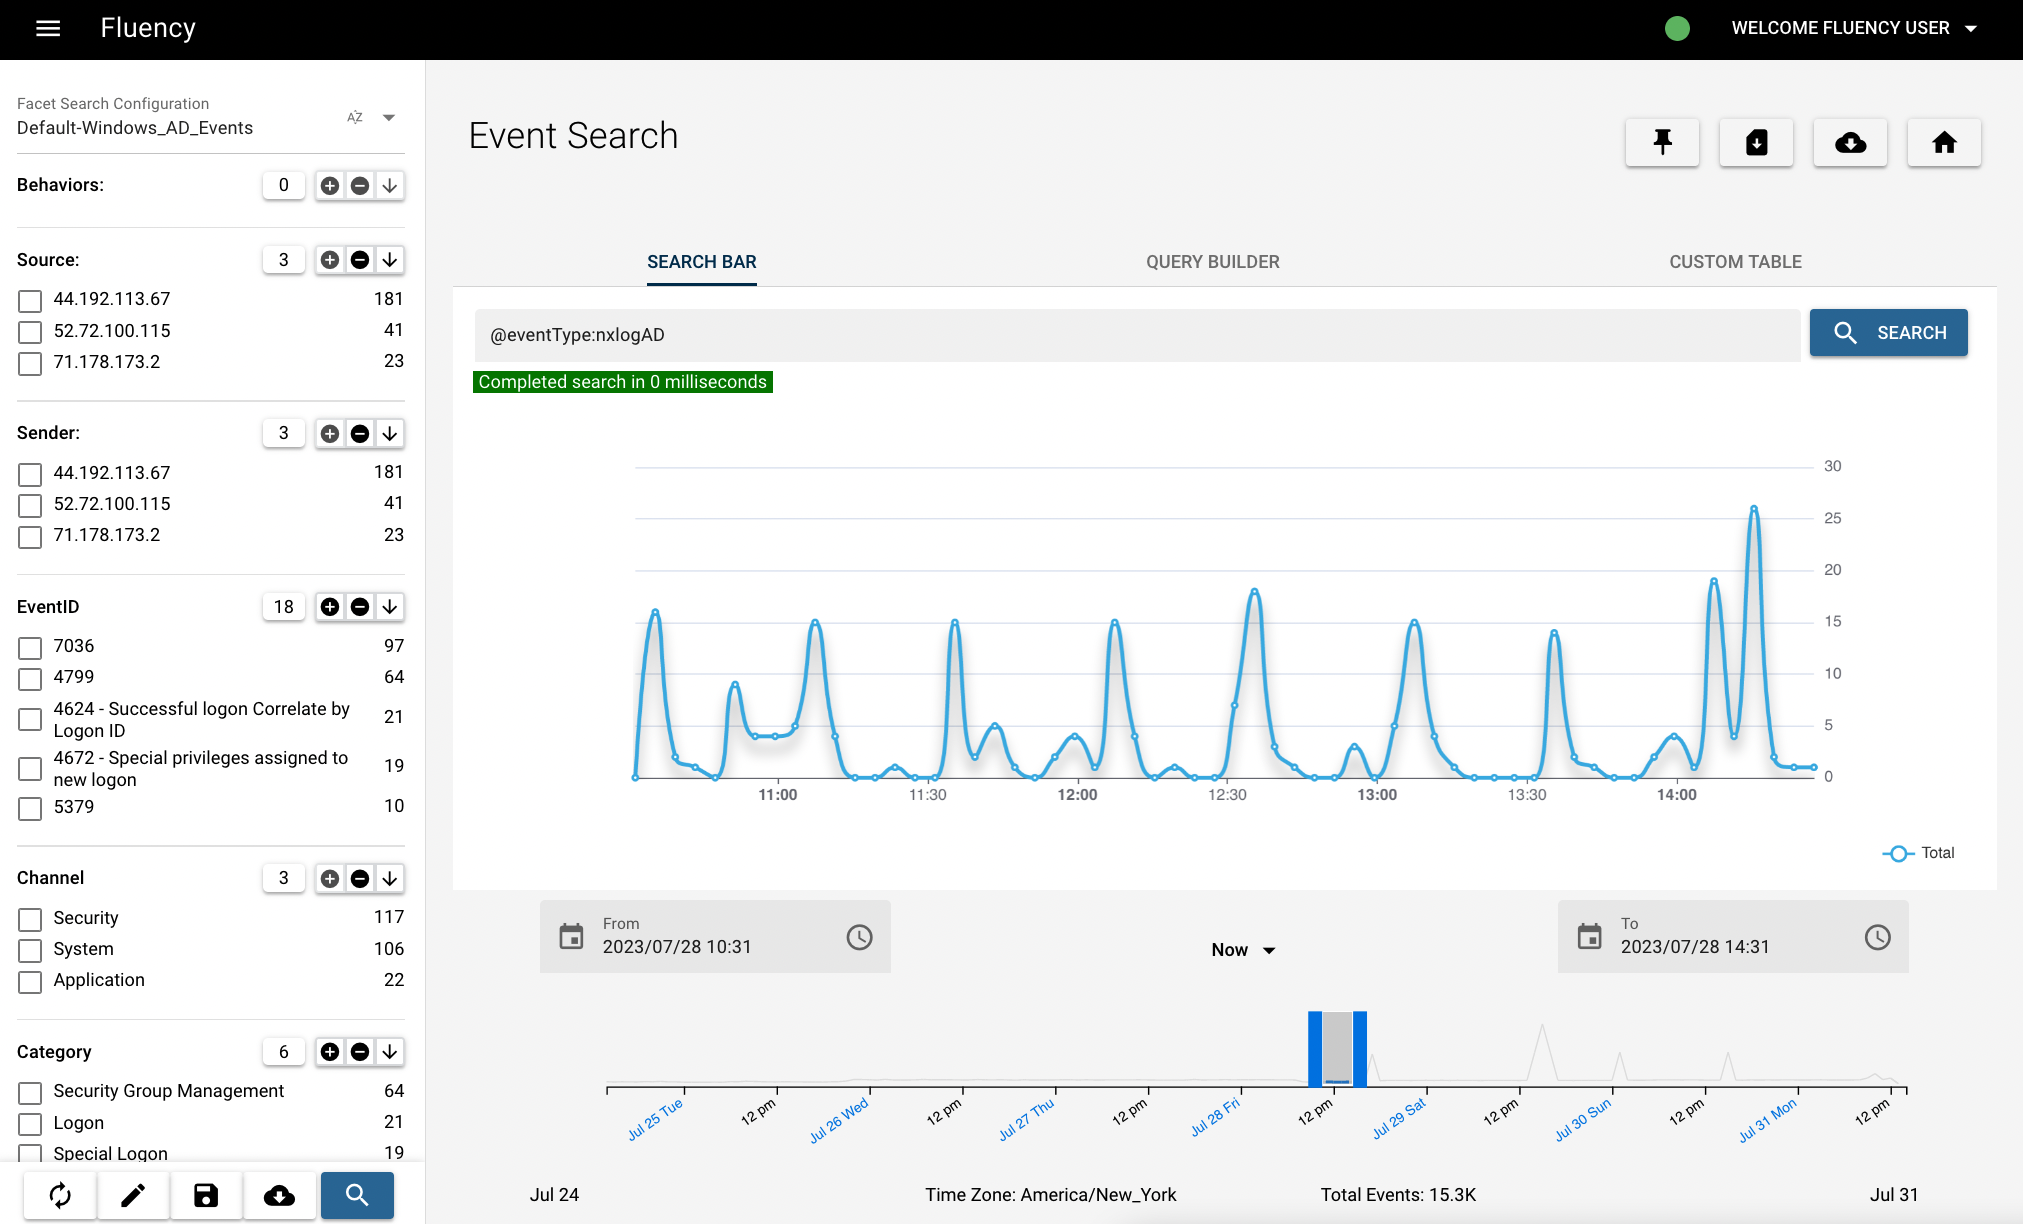
The two screenshots below are from the older Event Search page — its SEARCH BAR / QUERY BUILDER / CUSTOM TABLE tabs, and its results table with the Expand column. They are retained for reference only; the current page is the one shown above.
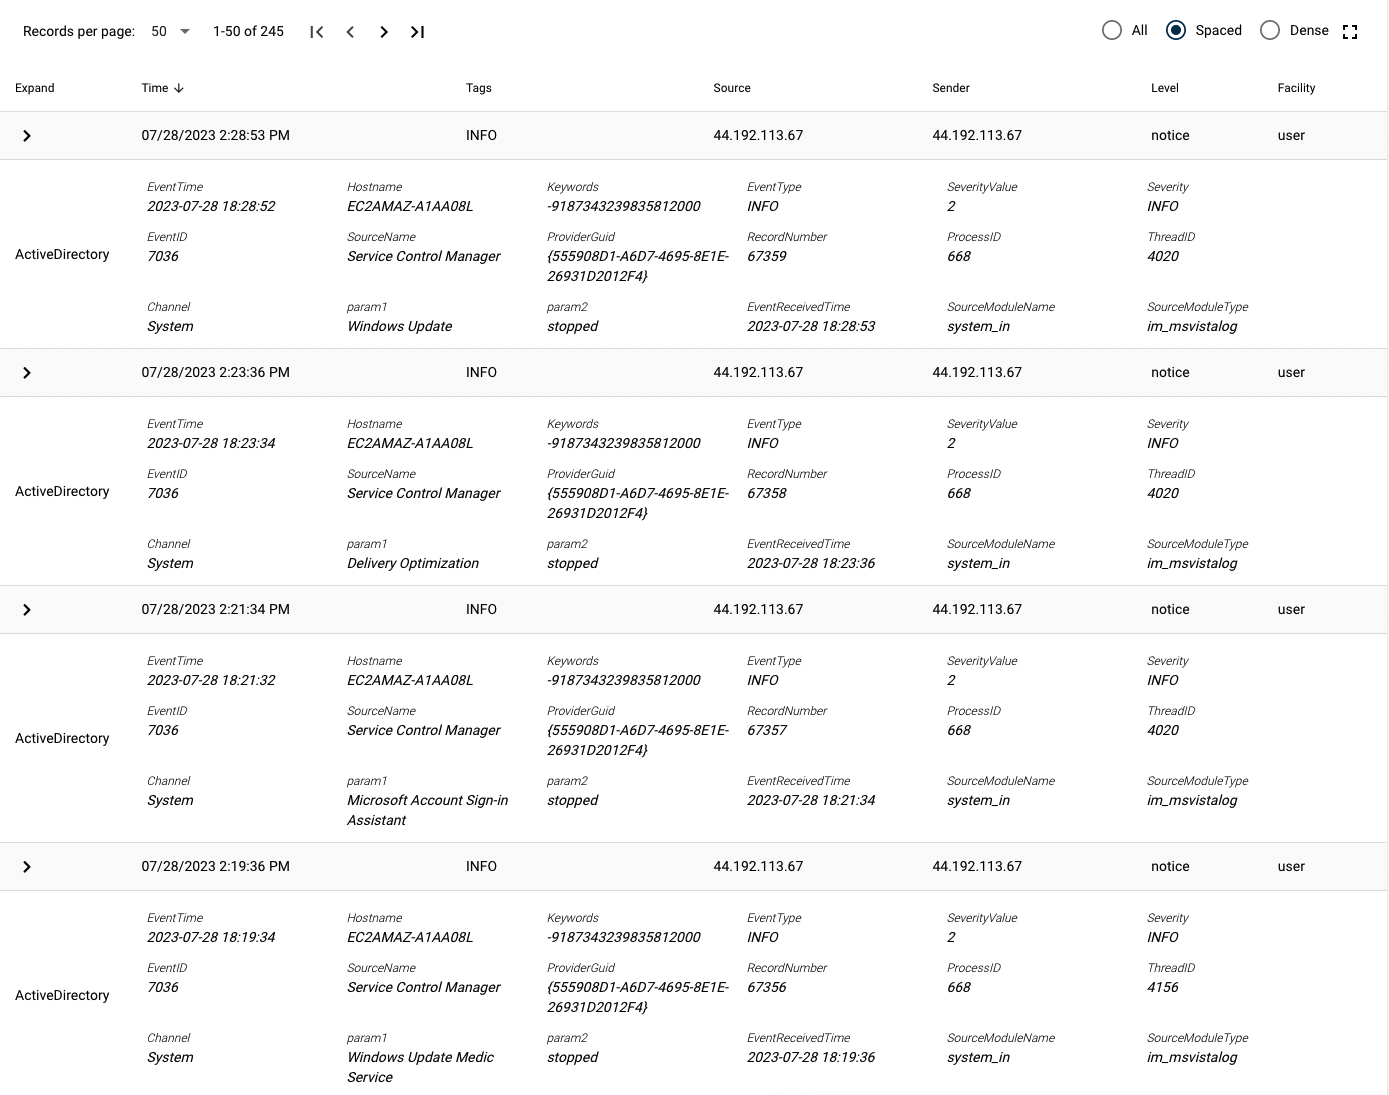
Base Event Record
When data enters the Fluency system, it is assigned metadata to note where and when the message came into the system. This recording of metadata provides a further layer of timing data to ensure addressing PCI DSS (10.4 and 10.3.3) and NIST 800-53 (AU-8).
Messages are sorted by the incoming timestamp. This means that polling message logs, like cloud logs, are often clustered together.
Click the "expand" icon (under the text "expand") on the left of the table to get the content of message more information.
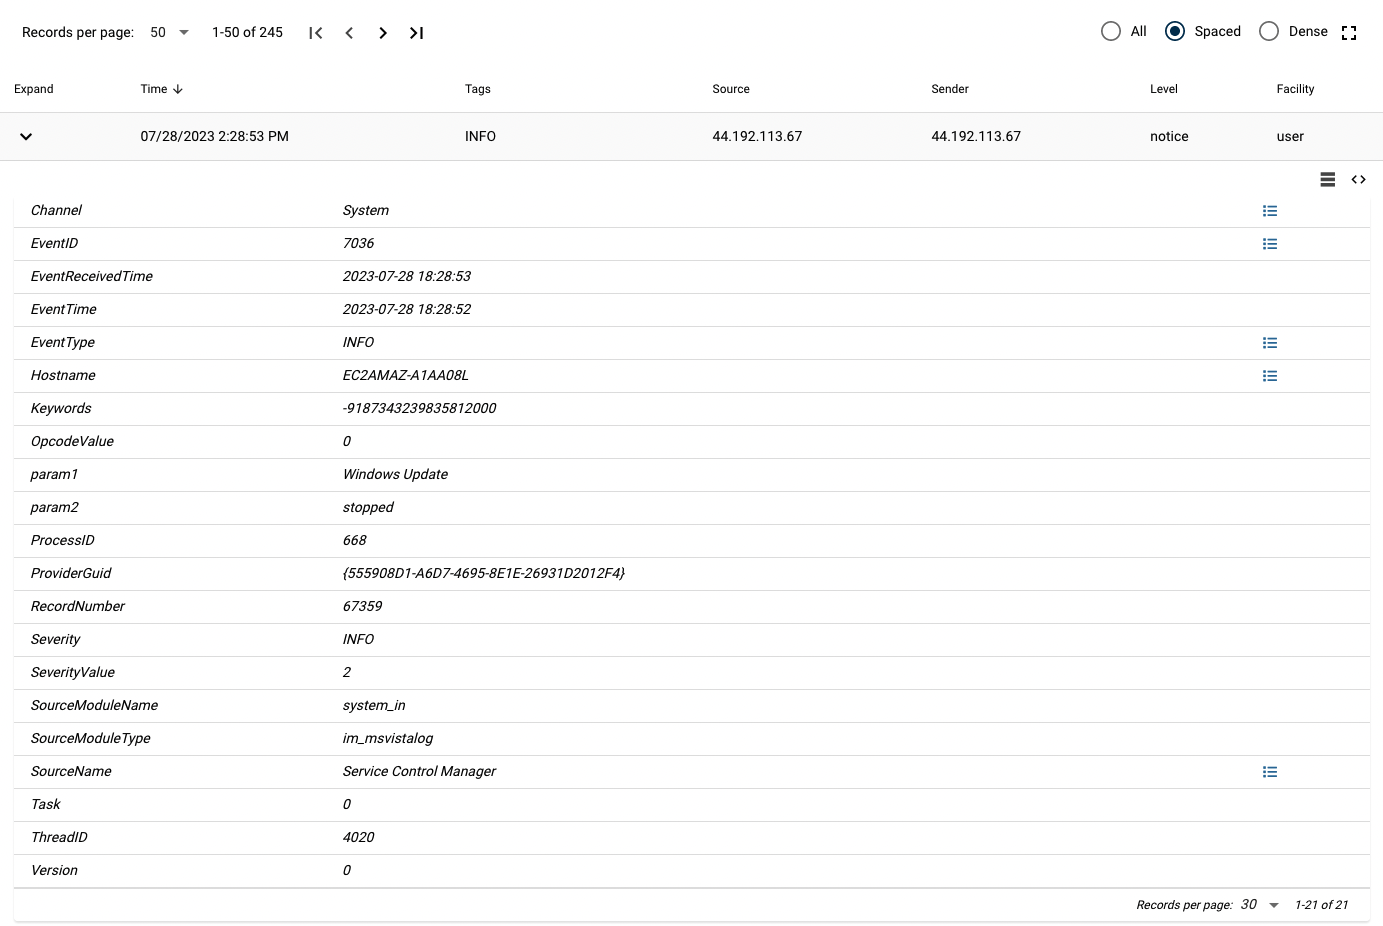
In the expanded window, click < > on the right to see the syslog:
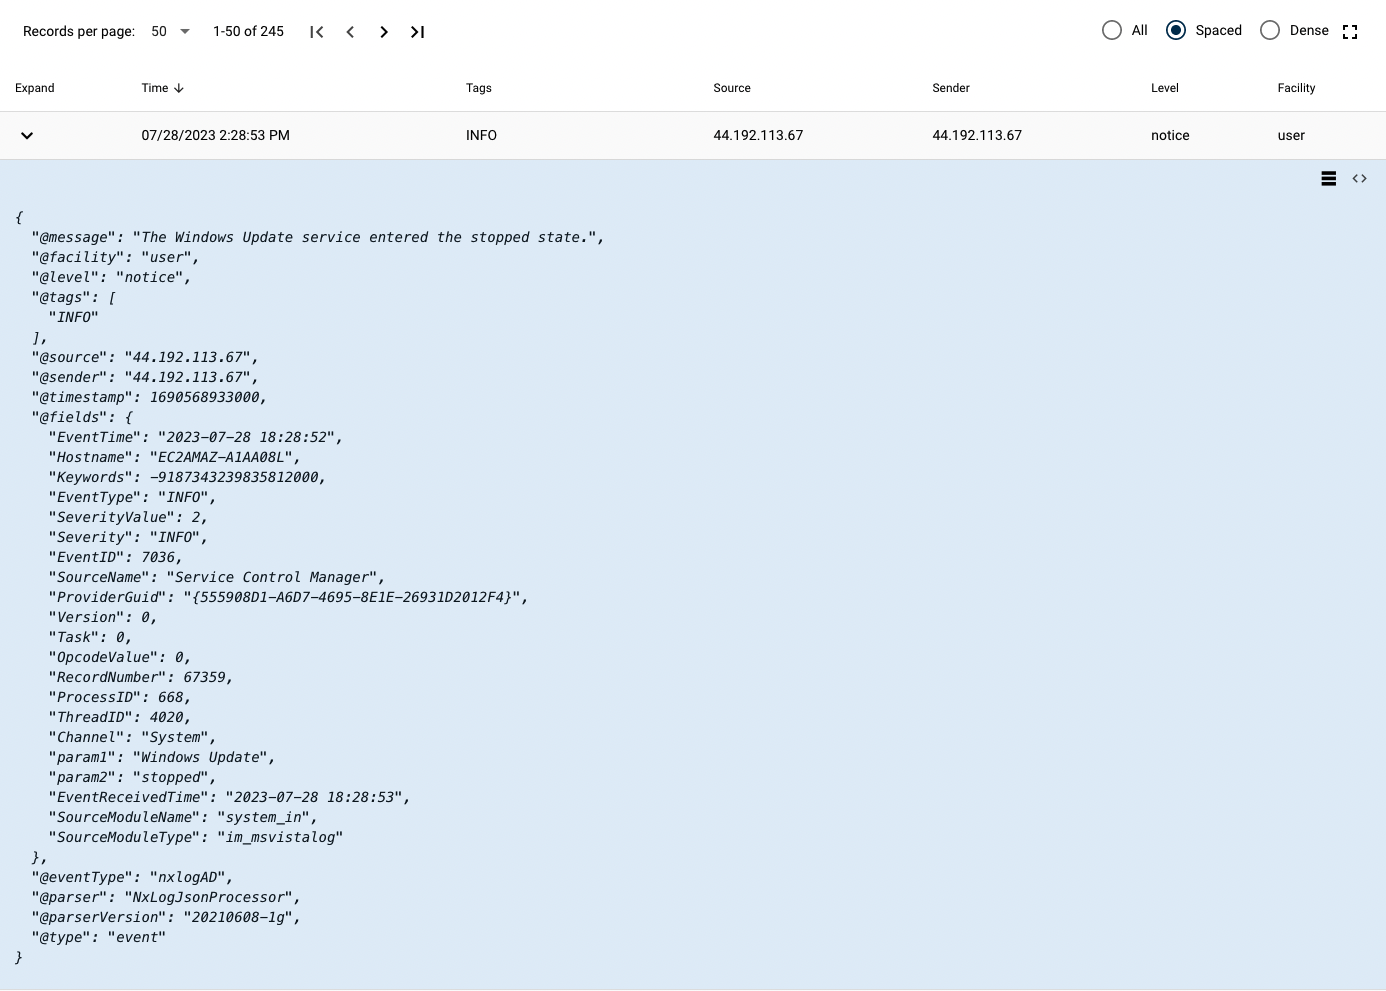
| Field | Description |
|---|---|
| @message | This is a complete record of the incoming message before parsing. |
| @facility | A defined group/facility area. |
| @level | This is the messages priority level. |
| @tags | An array of any tags what had a matching attribute. |
| @source | The module that produced this message. |
| @sender | The capture system that is the source of the message. |
| @fields | This is the resulting parsed data. |
| @timestamp | This is the millisecond epoch time. This provides a central timestamp verification of all incoming message. |
Parsing Process
Messages that come into the system are stored in the "@message" field. Comparing the "@message" field to the "@fields" object allows for parsing verification.
NOTE: After adding or updating a system, the log should be reviewed to ensure that the incoming message is being properly parsed. This is done by filtering to the Event Table to the changed source and then comparing the "@message" to "@fields" attributes.
JSON Sources
Some sources do not contain "@fields" attributes. These are sources that already produce formatted JavaScript Object Notation (JSON) messages. In this special case, the system can leverage the parsed data and add to the associated flow.
Special Views
Certain events receive a different, more readable format, most notably the Office365 formatting. This is done to allow the events database to be used for analysis that does not involve a known flow or asset.
Using the Facet
Facet is a technical term used for groups of attributes; you can think of them as filters. The Facet Section covers this topic in more detail. Facet is an easy way to focus on data and see the most common responses by field.