Search
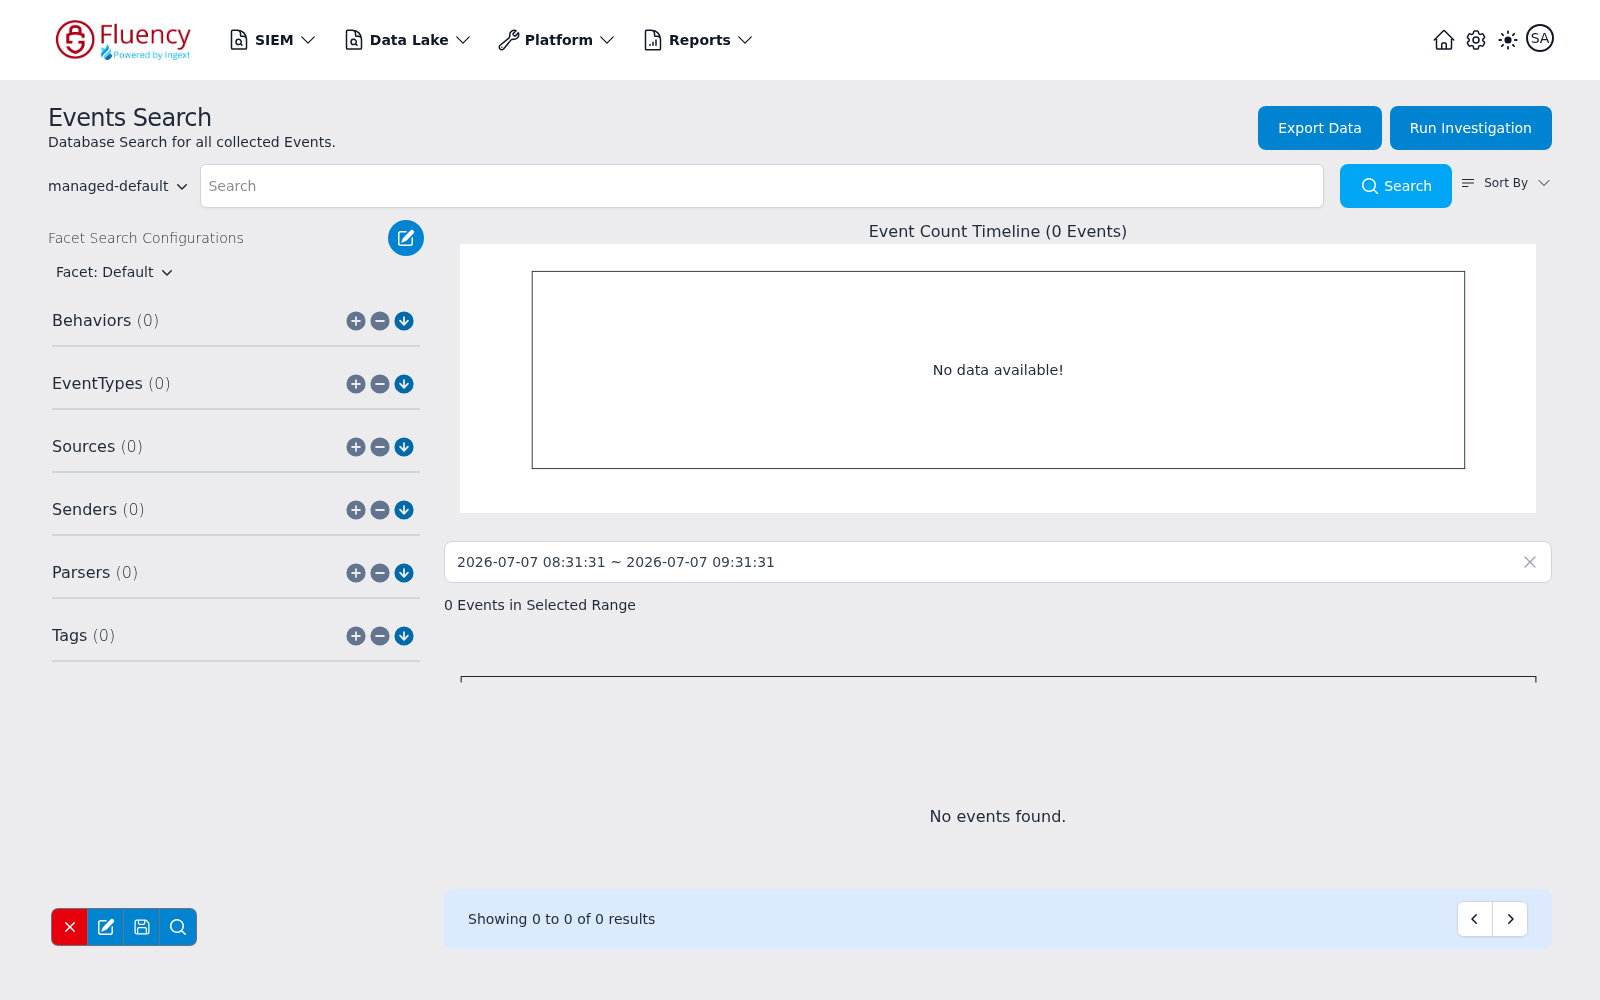
The Search page — headed Events Search on screen, with the tagline "Database Search for all collected Events." — is the database search across everything the data lake has collected. Pick an index, enter a query and time range, then review the matching events with a count timeline and a configurable facet breakdown.
Menu path: Data Lake → Search · URL path: /dataLake/search
Task guide: Events Search — searching stored events as a task.
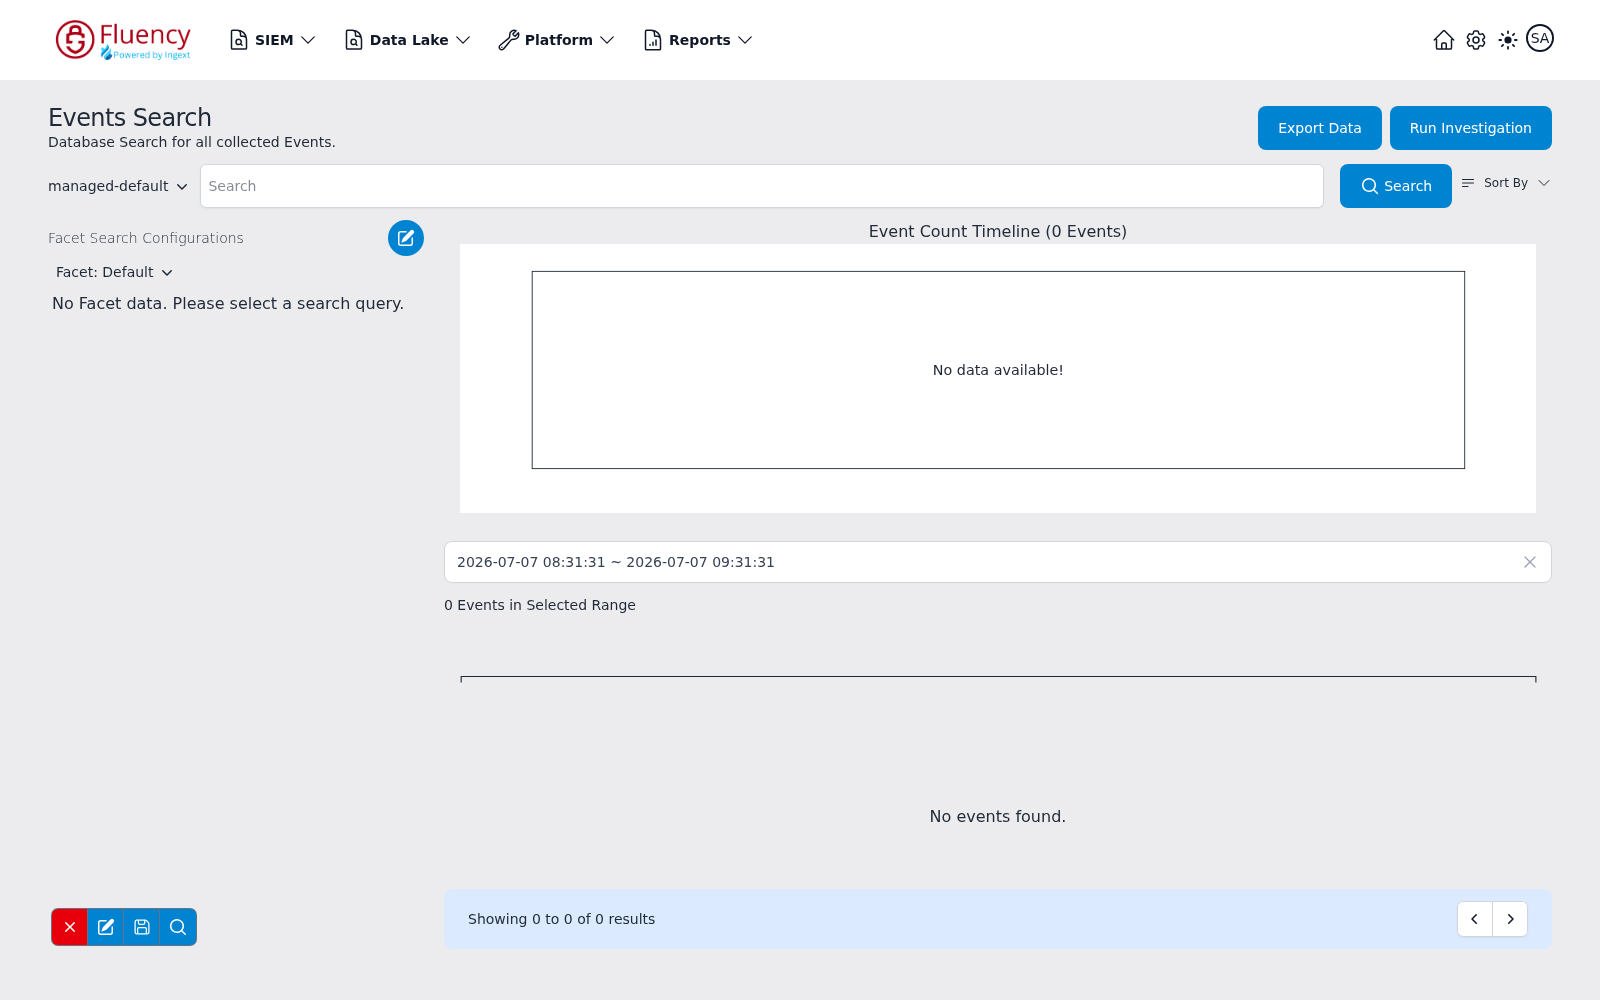
Page Layout
From top to bottom:
- Header — the Events Search title on the left and the Export Data and Run Investigation buttons on the right.
- Search bar — an index selector, the query input, the Search button, and a Sort By menu.
- Facet Search Configurations (left column) — the facet configuration selector, the facet groups computed from the search results, and a small facet toolbar of four icon buttons (red X, edit, save, magnifier) at the bottom left of the panel.
- Event Count Timeline (main column) — a chart of event counts over the searched period, followed by the time-range field and an Events in Selected Range counter.
- Results list — the matching events, with a Showing X to Y of Z results footer and paging arrows.
Header Actions
Export Data
Export Data downloads the events in the current result set. If the search has no results, nothing is exported and a red Export error toast appears reading No events data to download; dismiss it with its x.
Run Investigation
Run Investigation opens the Investigation Search dialog, which previews the scope and cost of running the current search as an investigation before you start it.
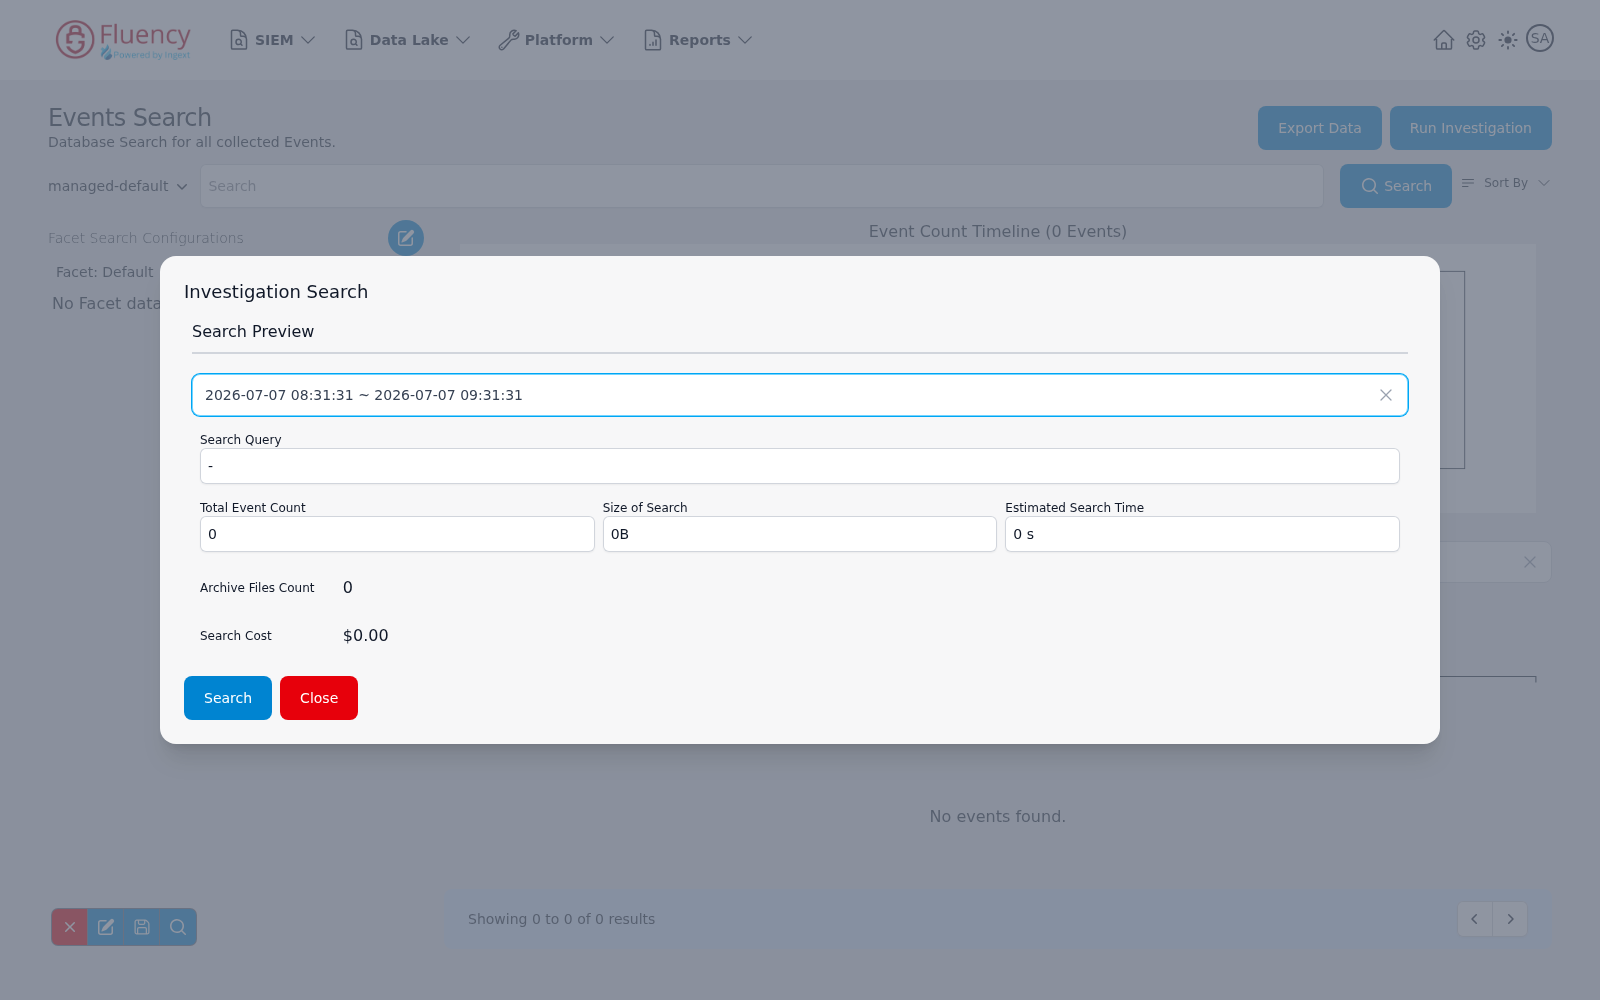
The Search Preview section shows:
- The time range to be searched, with an x to clear it.
- Search Query — the query text the investigation will run.
- Total Event Count, Size of Search, and Estimated Search Time — the projected scope of the run.
- Archive Files Count — the number of archive files the search covers.
- Search Cost — the estimated dollar cost of the run.
Click Search to start the investigation, or Close to dismiss the dialog without running it. Runs are tracked on the Investigations page.
Search Bar
Index selector
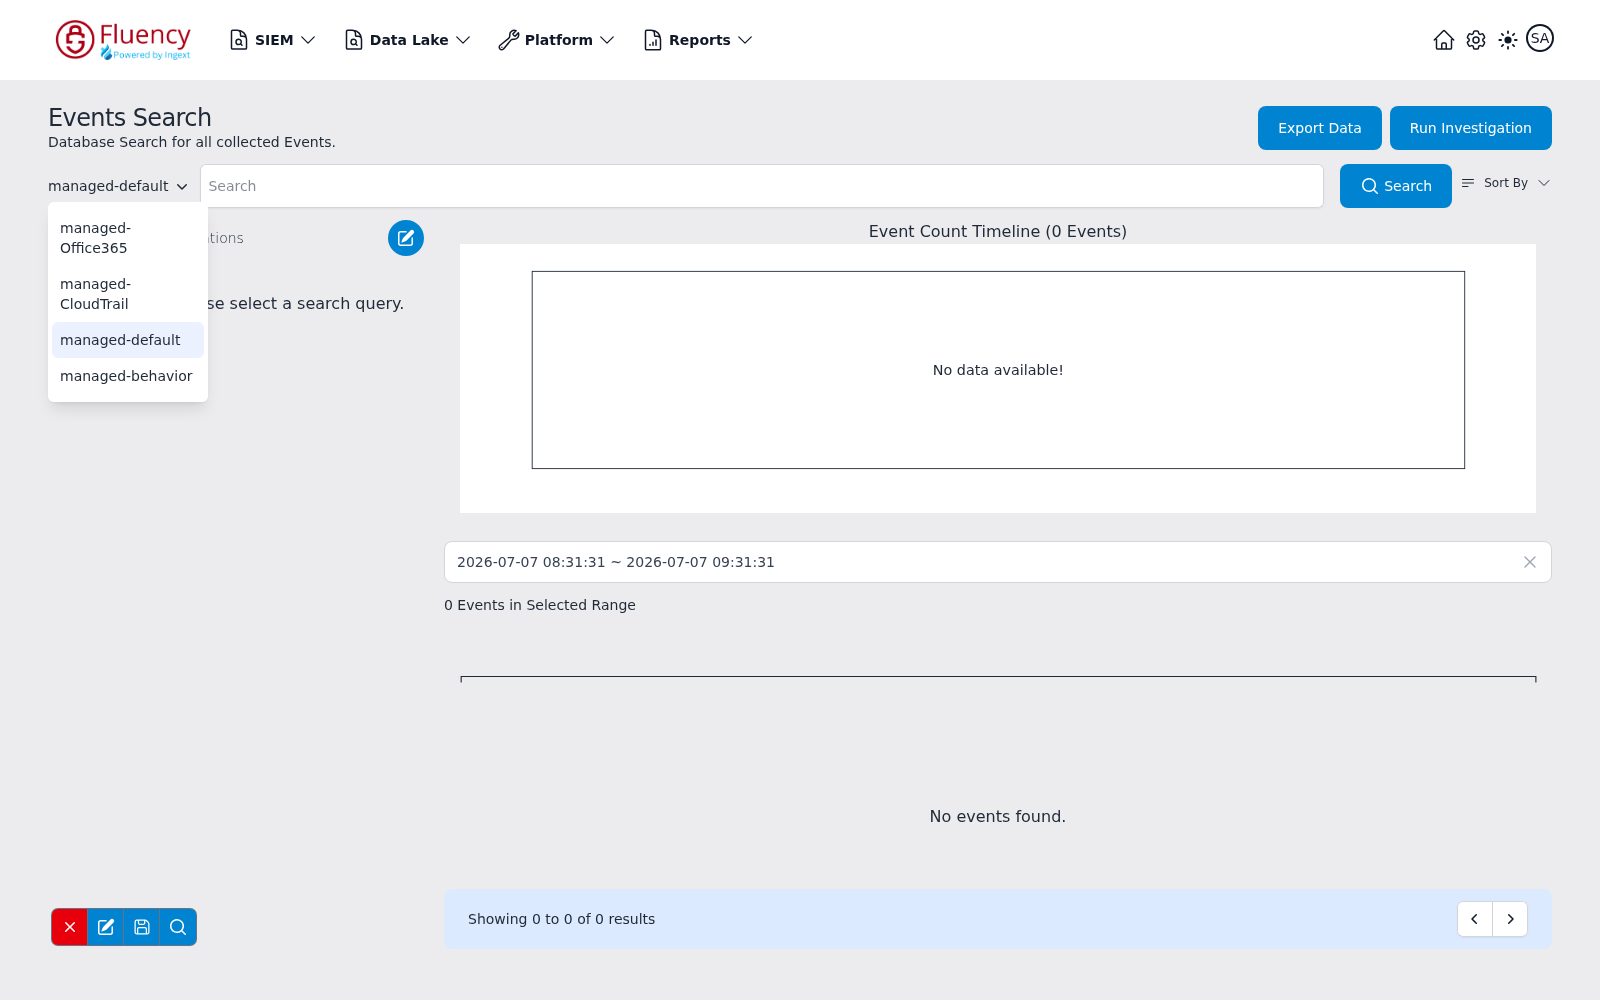
The leftmost control in the search bar shows the index the search runs against. Click it to choose among the managed indexes configured for your organization. In this capture the menu lists:
- managed-Office365
- managed-CloudTrail
- managed-default (highlighted as the current selection)
- managed-behavior
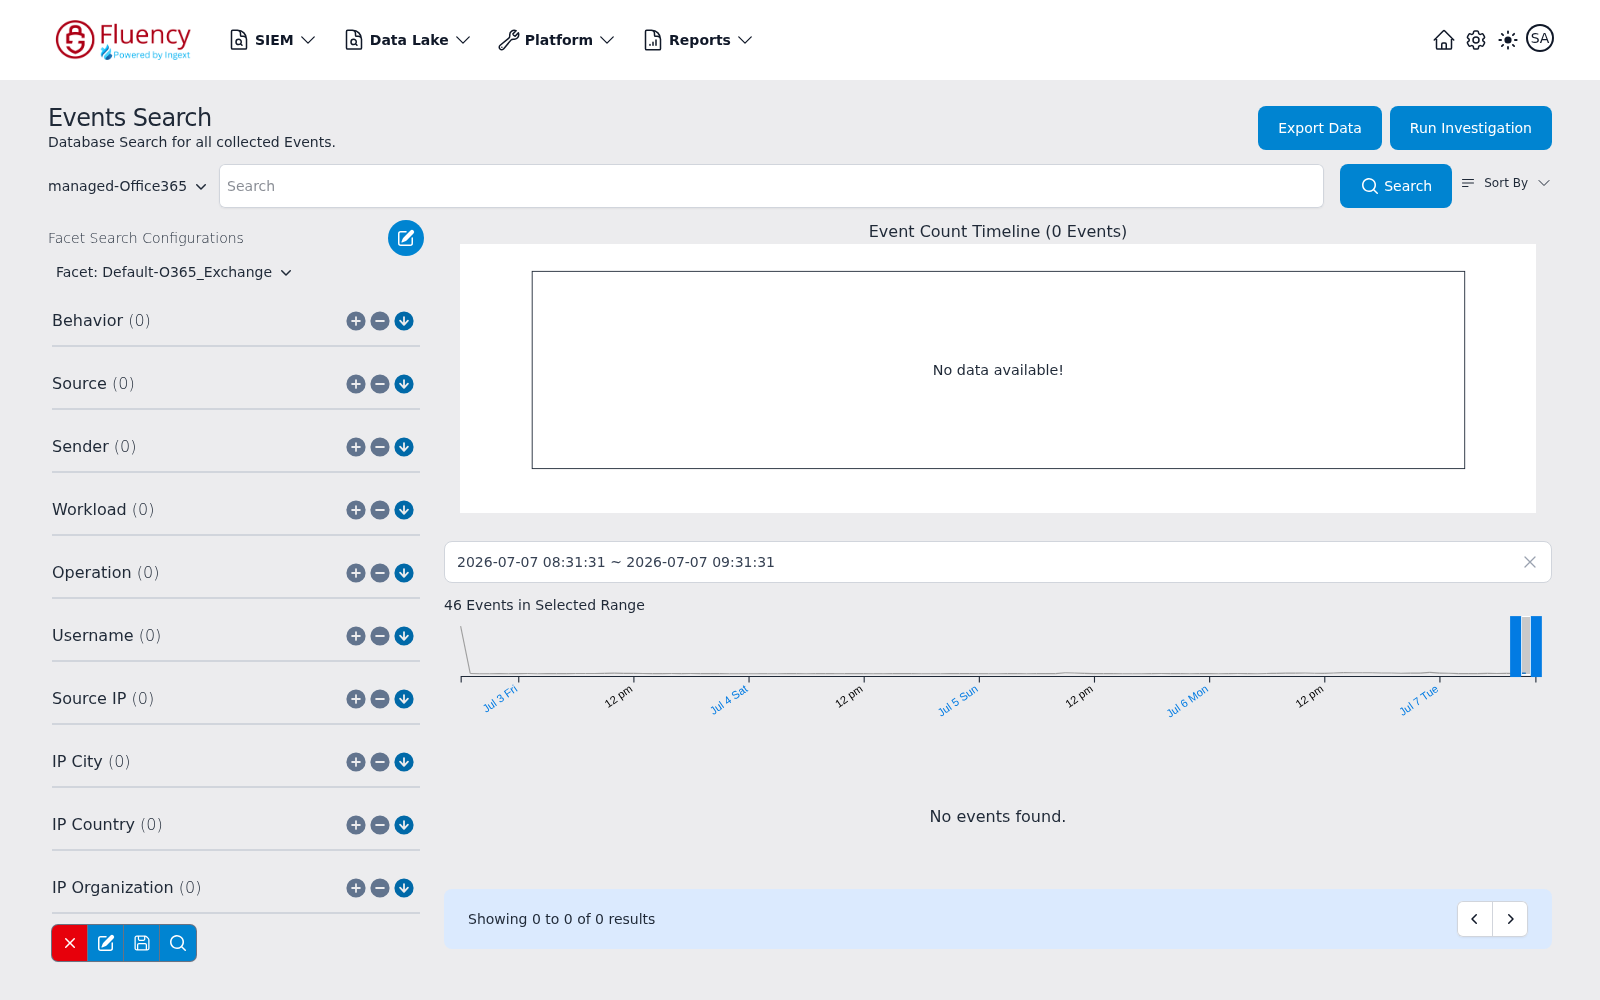
Picking a different index re-runs the search against it immediately: the page navigates to the search URL with index set to the chosen index and a profile parameter naming the matching per-source facet configuration. Choosing managed-Office365, for example, loads the page with index=managed-Office365 and profile=Default-O365_Exchange — the facet selector switches to Facet: Default-O365_Exchange, the panel shows that configuration's groups (Behavior, Source, Sender, Workload, Operation, Username, Source IP, IP City, IP Country, IP Organization), and the range strip and Events in Selected Range counter update to the new index's events.
Query input
Type the query into the Search field. The query, together with the selected index and time range, defines what the search returns.
Search
Click Search (magnifier icon) to run the query. The page navigates to a URL that records the full search — the query (q), the time window (from, to), the filter terms (must, not), and the selected index (index) — so a search can be bookmarked or shared. When the search completes, the facet panel loads the facet groups of the selected facet configuration.
Sort By
Sort By sets the order of the results list:
- Newest
- Oldest
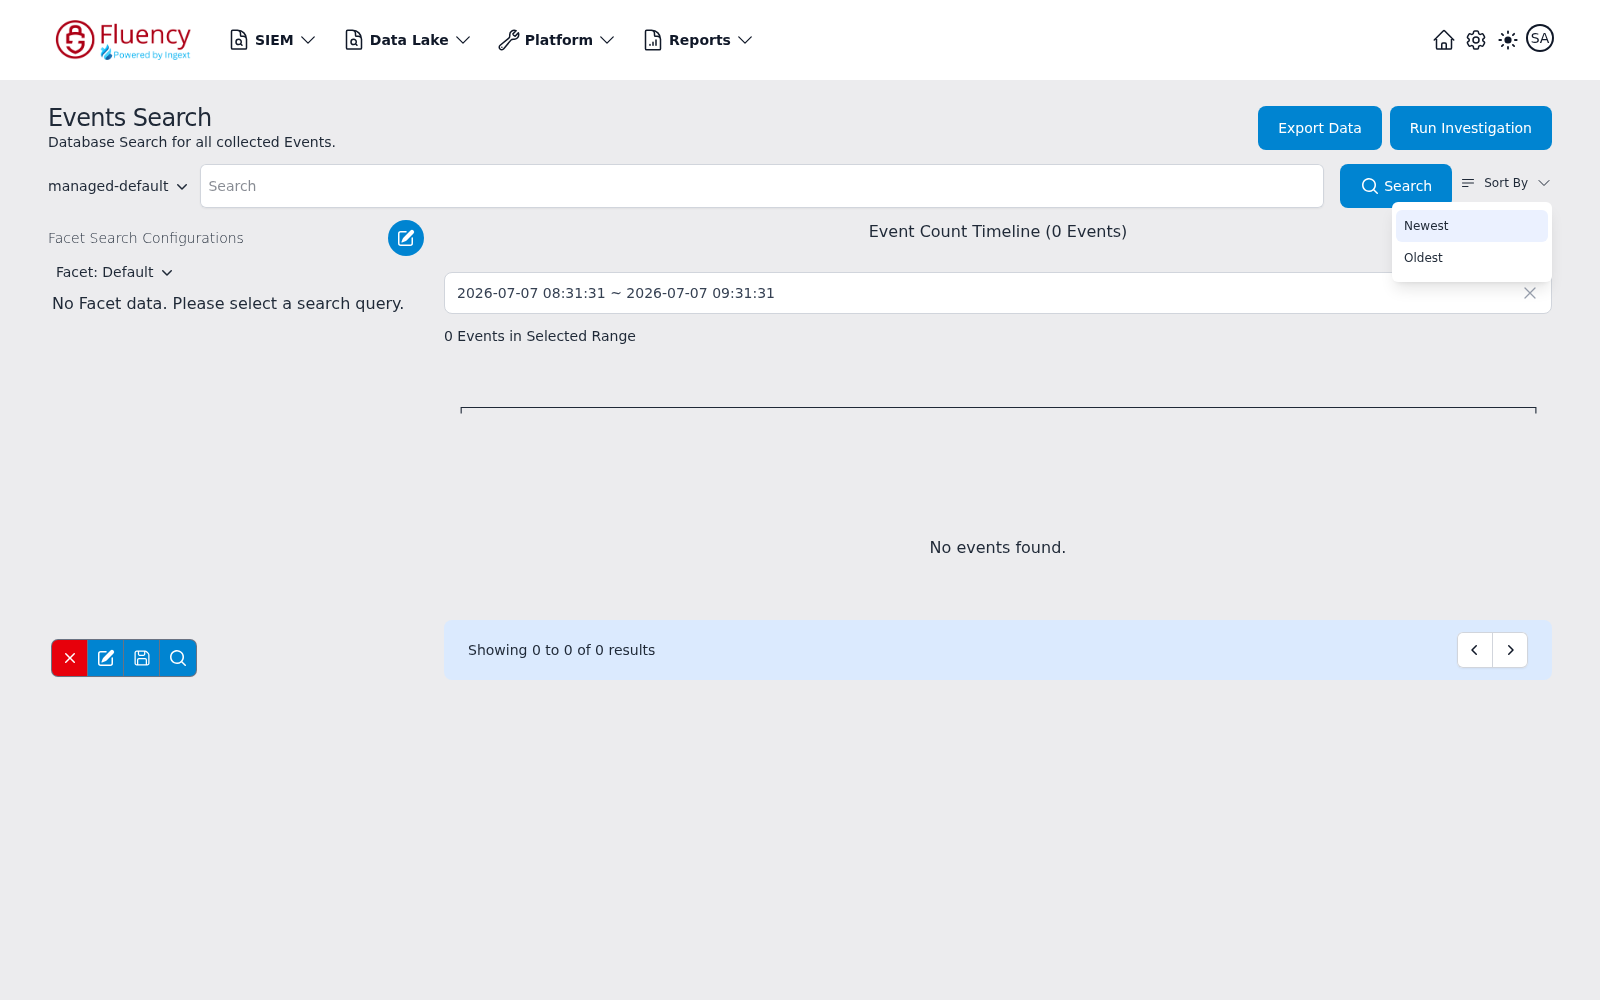
Picking Newest — the highlighted, active order in this capture — applies the order in place without reloading the page. Picking Oldest re-runs the search: the page navigates to the search URL carrying the current parameters, including the selected index, and reloads the results and facet groups in the new order.
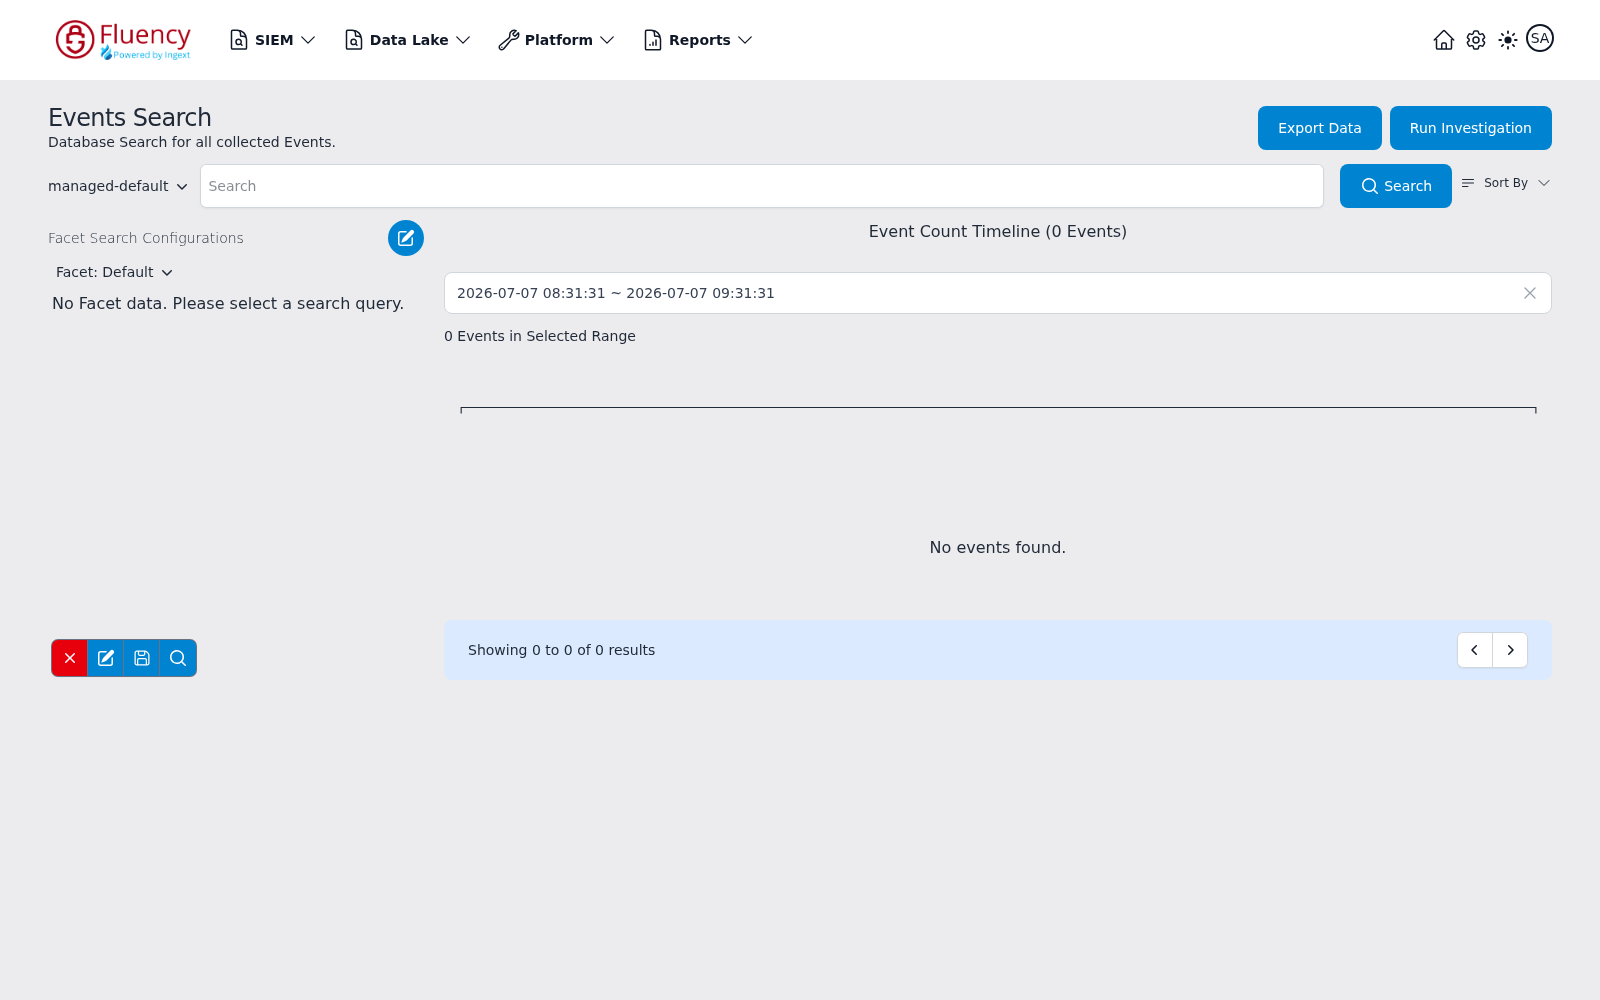
Facet Search Configurations
The left panel breaks the search results down into facet groups defined by a facet configuration. Before a search runs, the panel reads No Facet data. Please select a search query.
Manage facets (blue pencil button)
The round blue pencil button beside the Facet Search Configurations heading opens the Search Facets dialog ("List of all event search facets."), the library of saved facet definitions.
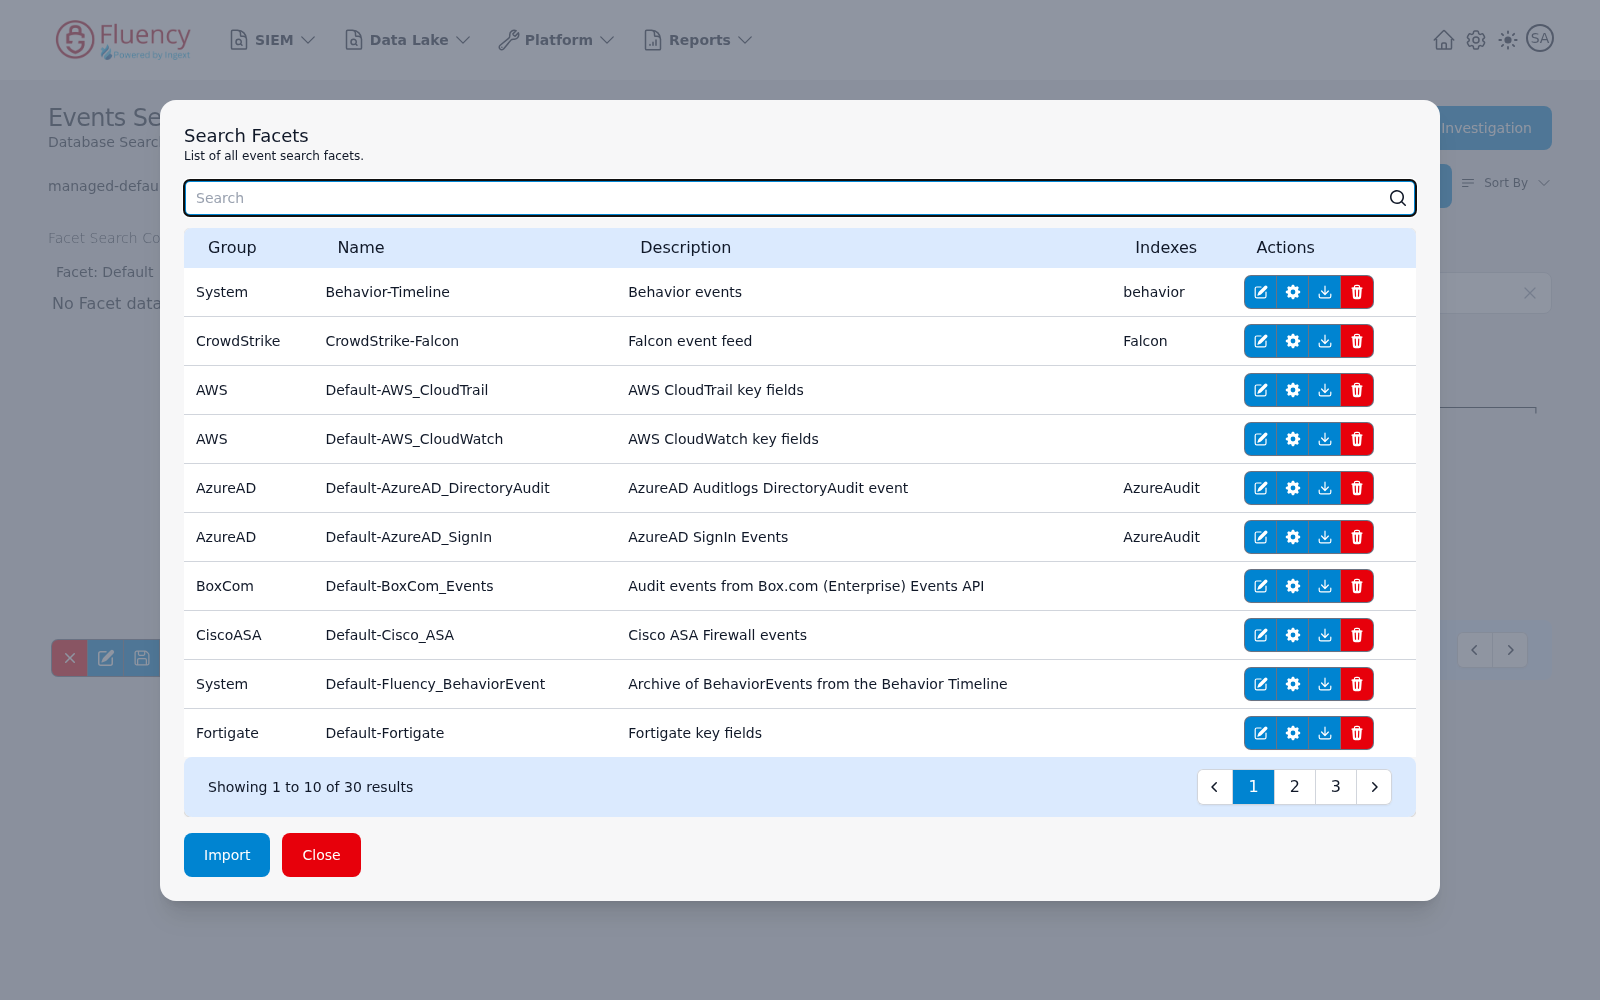
The dialog contains:
- A Search box for filtering the list.
- A table of facet definitions with Group, Name, Description, Indexes, and Actions columns. Each definition belongs to a group (for example a vendor or System), has a name and description, and may list the indexes it applies to.
- Per-row Actions buttons: edit (pencil), settings (gear), download, and a red delete (trash).
- A paging footer with numbered page buttons and arrows.
- Import to bring in a facet definition, and Close to dismiss the dialog.
Facet selector
Facet: Default shows which facet configuration is applied. Click it to switch configurations; the menu lists every saved configuration — the general Default plus a per-source default for each integrated data source. The scrolling menu in this capture spans 26 configurations:
- Default
- Default-AWS_CloudTrail
- Default-AWS_CloudWatch
- Default-BoxCom_Events
- Default-Cisco_ASA
- Default-Fluency_BehaviorEvent
- Default-Fortigate
- Default-Microsoft_Defender_Events
- Default-Mimecast_Attachment_Protect
- Default-Mimecast_Impersonation_Protect
- Default-Mimecast_MTA_Receipt
- Default-Mimecast_URL_Protect
- Default-O365_Azure_AD
- Default-O365_Exchange
- Default-O365_OneDrive
- Default-O365_Security_Compliance_Center
- Default-Okta_Login
- Default-Palo Alto Firewall
- Default-Proofpoint_TAP_Events
- Default-SentinelOne_Device_Alerts
- Default-Windows_AD_Events
- Default: PA GlobalProtect VPN
- Default: SentinelOne Alerts
- Default: SentinelOne CloudFunnel
- Default: Sophos EDR
- Fortigate-Attacks
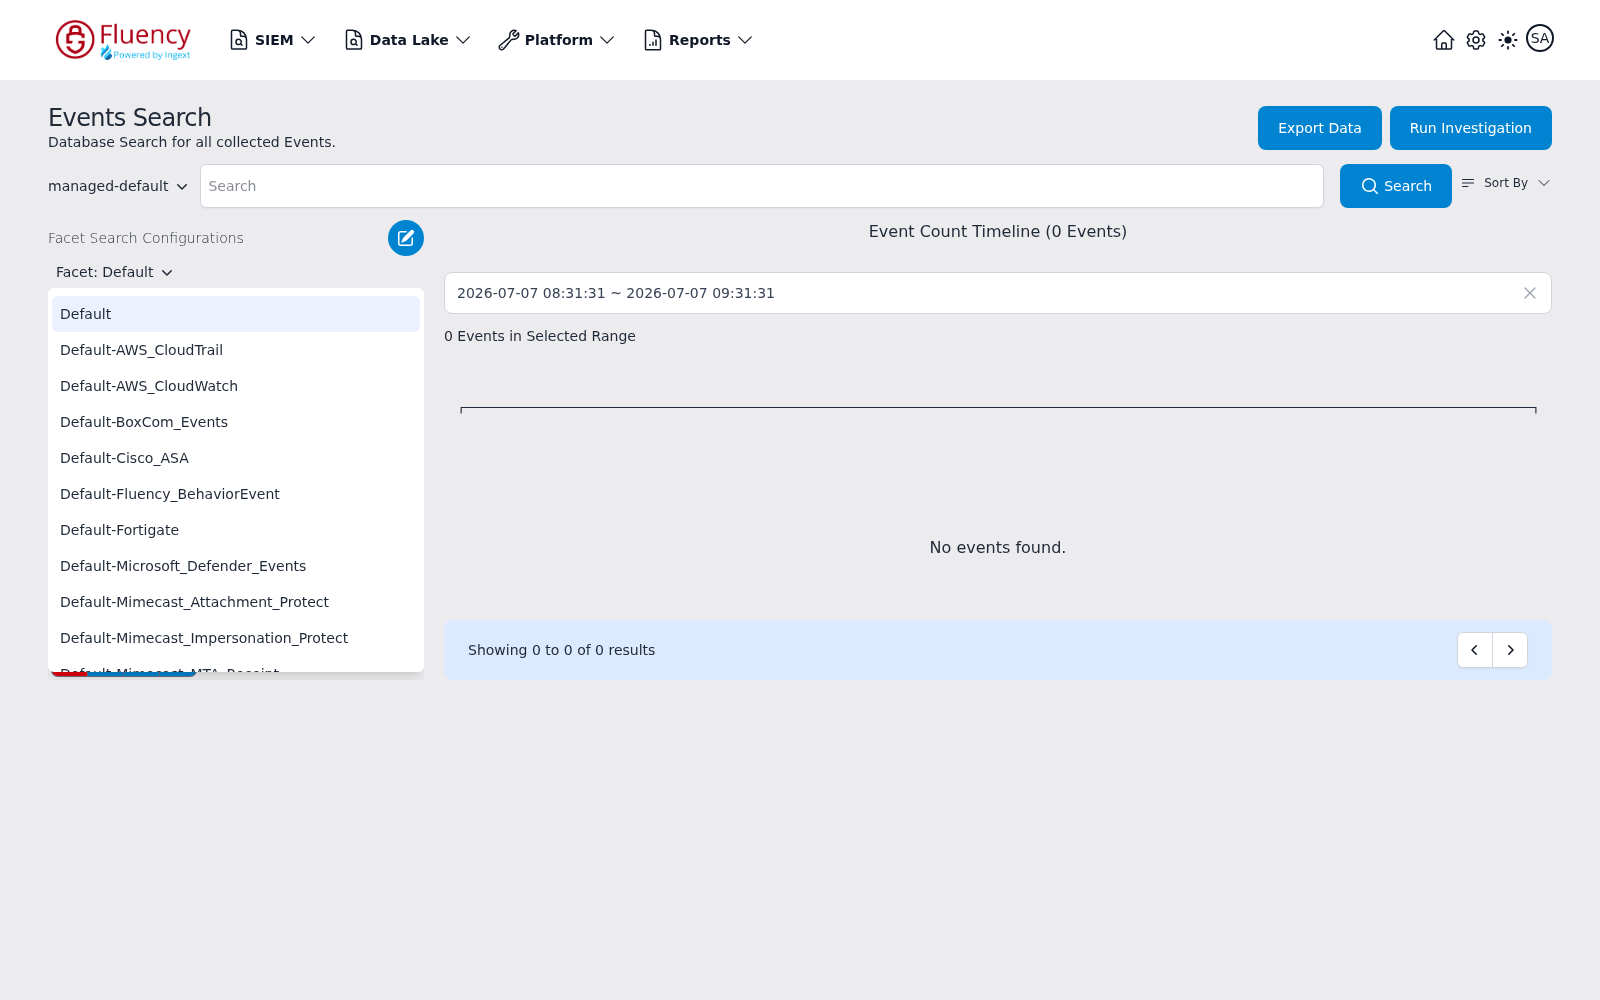
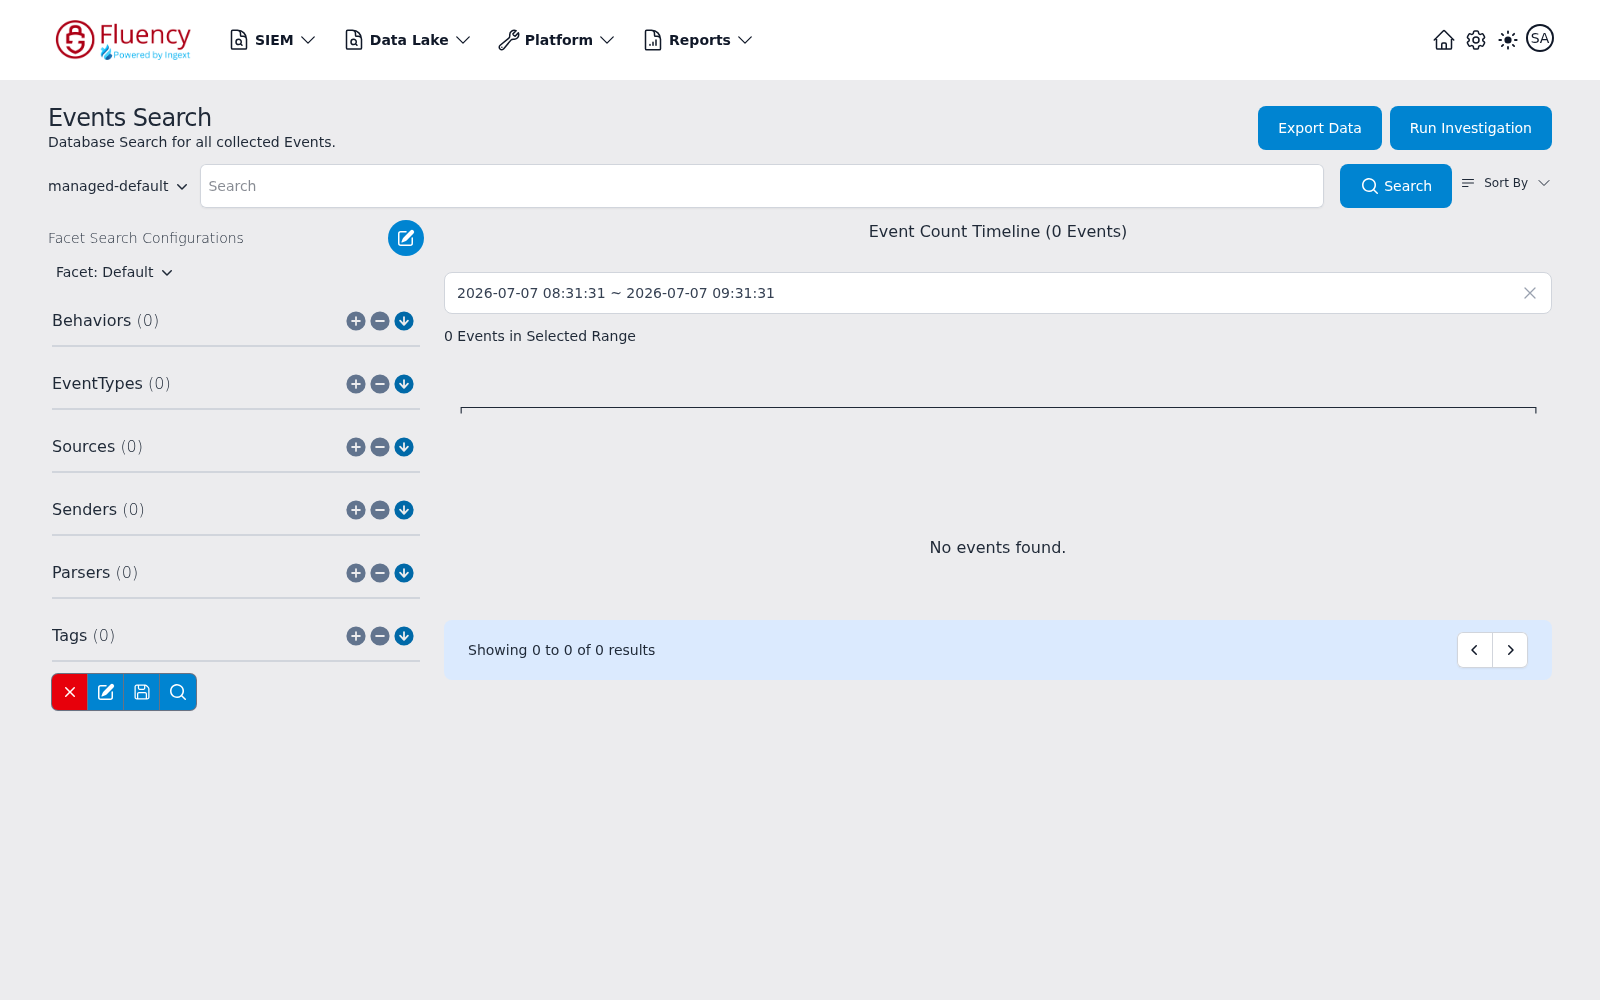
Selecting Default applies it directly: the panel loads the Default facet groups with no further prompt.
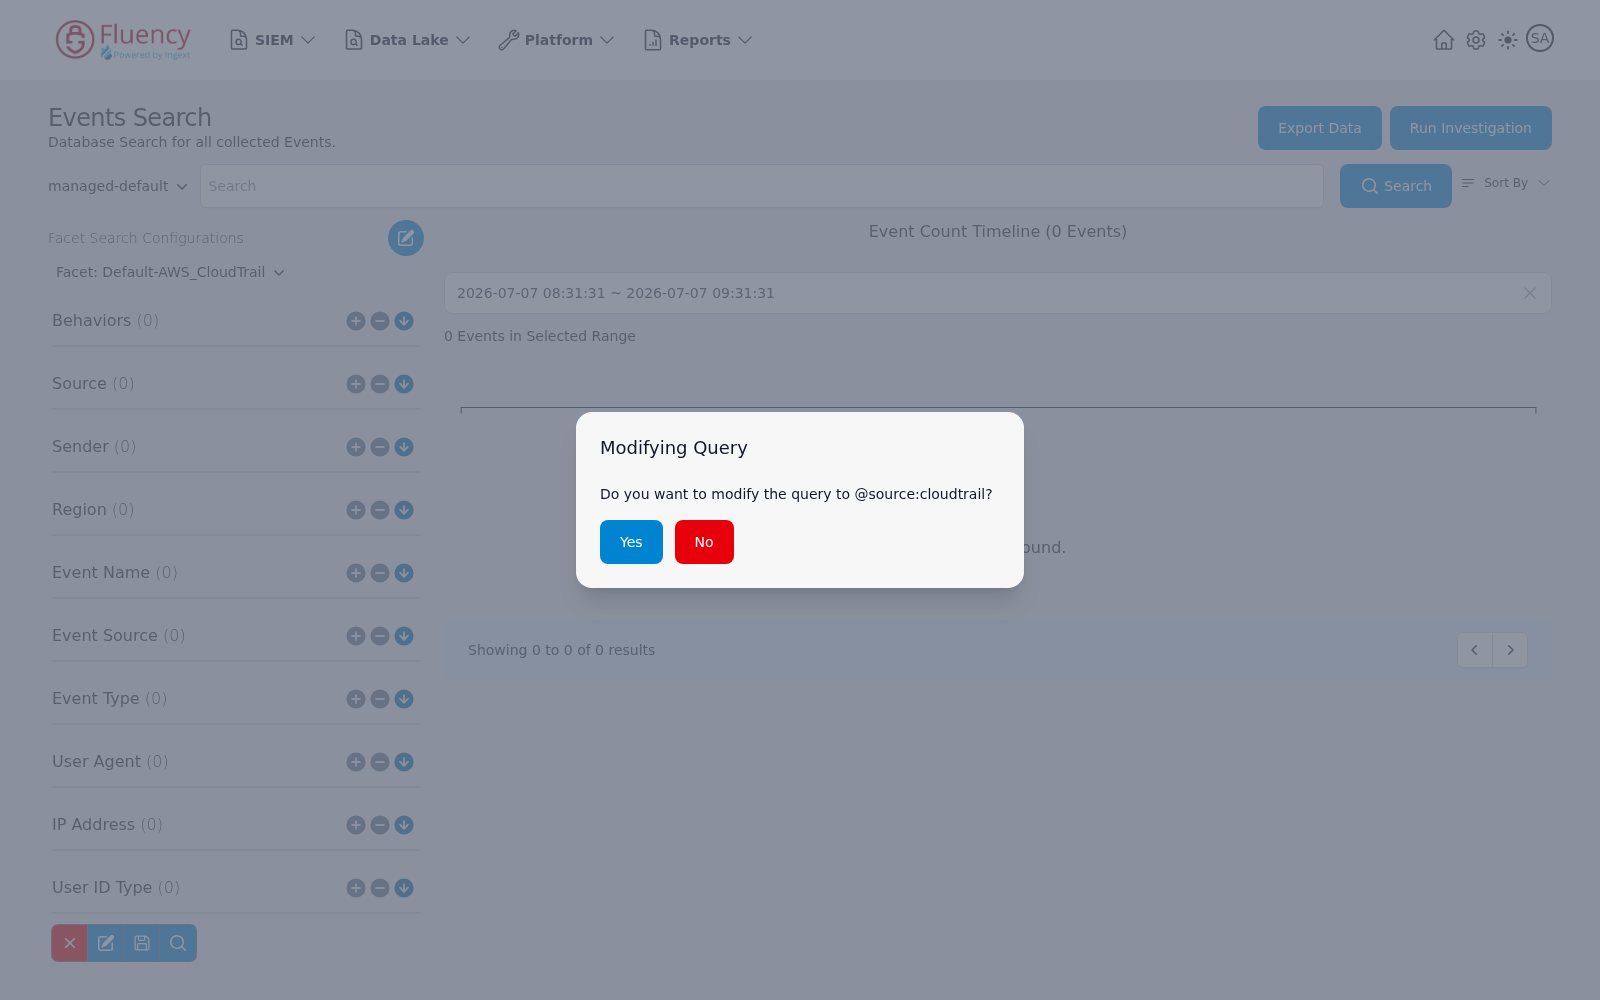
Selecting any other configuration switches the panel to that configuration's facet groups and opens a Modifying Query confirmation offering to rewrite the search query to match that source — for Default-AWS_CloudTrail it asks "Do you want to modify the query to @source:cloudtrail?" The suggested filter varies with the configuration: Default-O365_Azure_AD proposes @source:Audit.AzureActiveDirectory, and Fortigate-Attacks proposes @event_type:"@fortigate" AND @fortigate.attack:*. Click Yes to replace the query with the suggested filter, or No to keep the current query.
Facet groups
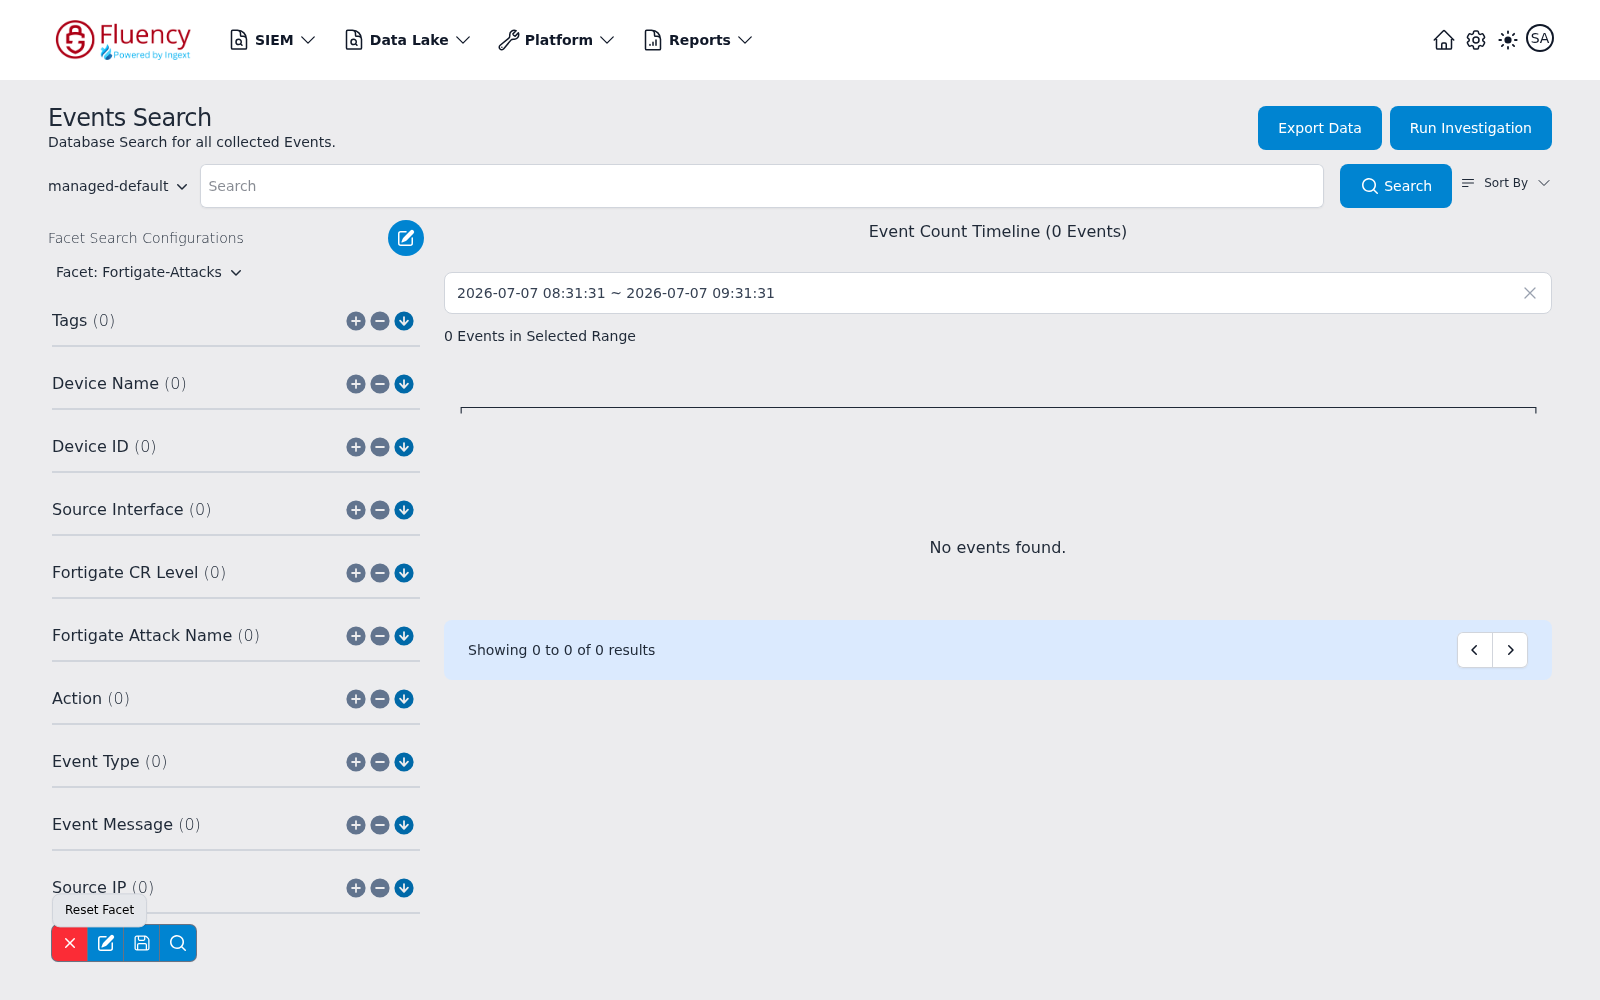
Once a search has run, the panel shows one group per field in the selected configuration — with the Default configuration: Behaviors, EventTypes, Sources, Senders, Parsers, and Tags. Each configuration defines its own set of groups — Fortigate-Attacks, for example, breaks results into Tags, Device Name, Device ID, Source Interface, Fortigate CR Level, Fortigate Attack Name, Action, Event Type, Event Message, and Source IP — so switching the configuration (or the index) swaps the panel to the new configuration's groups. Each group is labeled with a value count in parentheses (zero throughout this capture, as the demo search returned no events) and carries three small round icon buttons: a plus, a minus, and a down arrow.
Facet toolbar
The cluster of four icon buttons at the bottom left of the panel acts on the current facet setup.
Reset Facet (red X)
The red X button — tooltip Reset Facet — resets the facet panel: loaded facet data and selections are discarded, and the panel returns to the currently selected configuration's facet groups with zero counts (the Fortigate-Attacks groups in this capture, that configuration being selected at the time).
Edit fields (pencil)
The pencil button opens a Search Facets dialog for editing the fields of the current facet configuration.
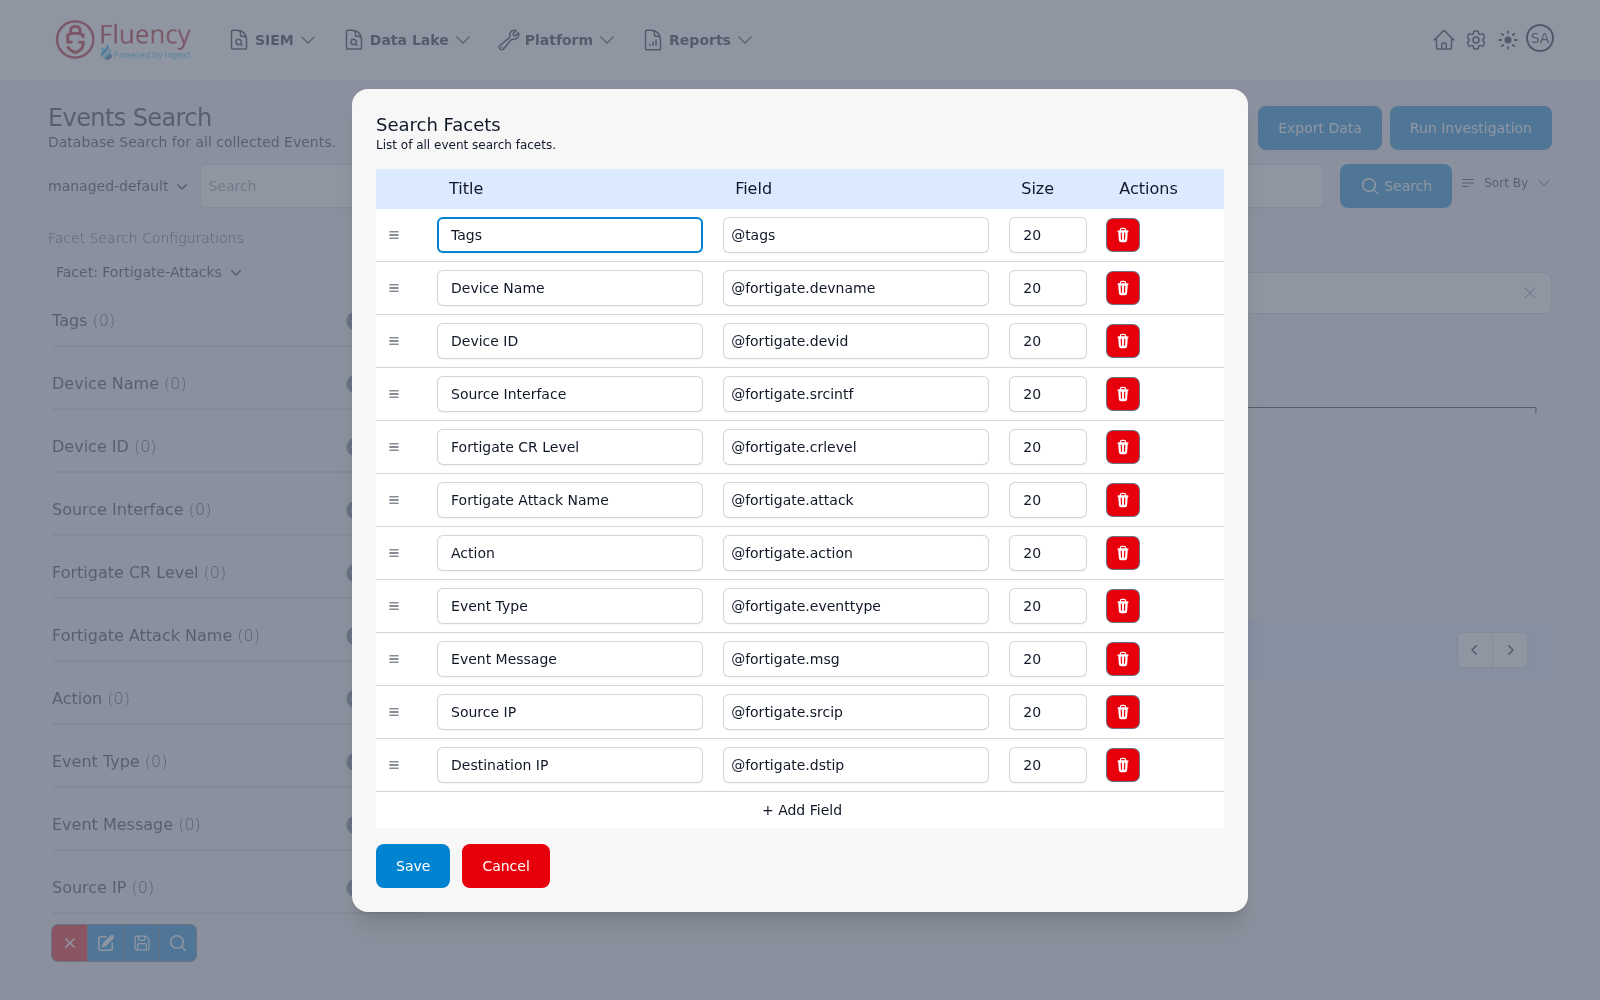
Each row defines one facet group:
- Title — the group label shown in the panel (for example Tags or Device Name).
- Field — the event field the group aggregates (in the Fortigate-Attacks configuration captured here:
@tags, then@fortigate.devname,@fortigate.devid,@fortigate.srcintf,@fortigate.crlevel,@fortigate.attack,@fortigate.action,@fortigate.eventtype,@fortigate.msg,@fortigate.srcip, and@fortigate.dstip). - Size — the number of values the group returns (20 for every row in this capture).
- Actions — a red trash button that removes the row; a handle icon sits at the start of each row.
Click + Add Field to append a new row, then Save to keep the changes or Cancel to discard them.
Save configuration (floppy disk)
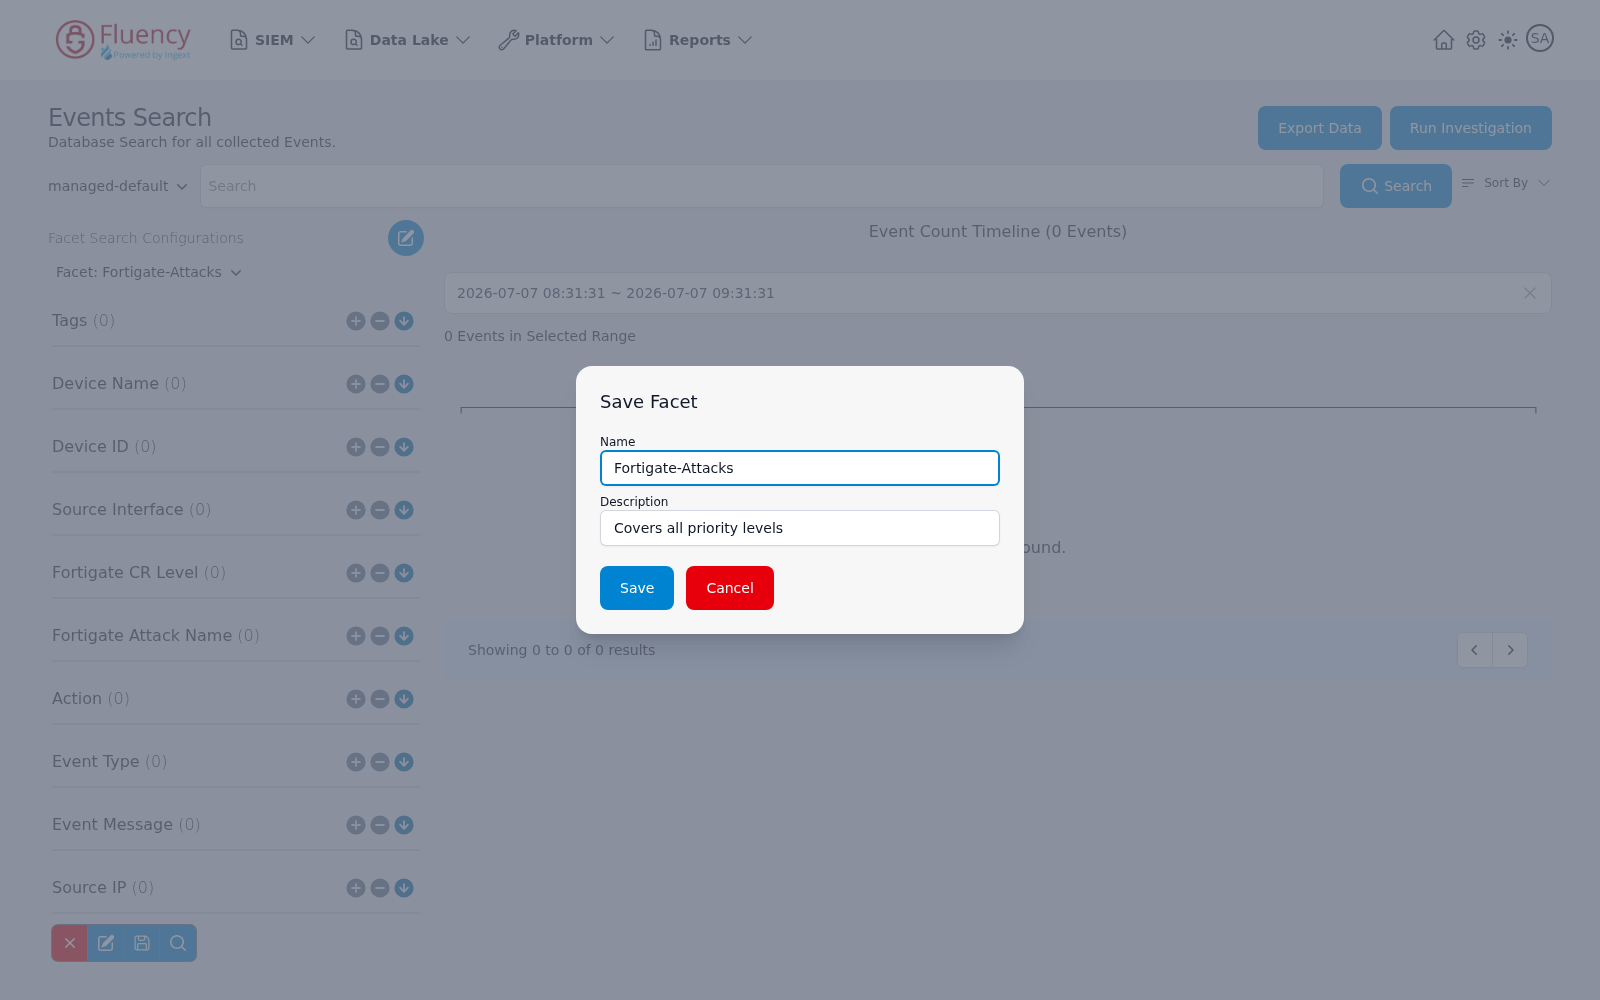
The save button opens the Save Facet dialog, which stores the current facet setup as a named configuration:
- Name — the configuration name, pre-filled with the currently selected configuration (Fortigate-Attacks in this capture).
- Description — an optional description, pre-filled with the configuration's existing description when it has one.
Click Save to store the configuration or Cancel to close without saving.
Run facet search (magnifier)
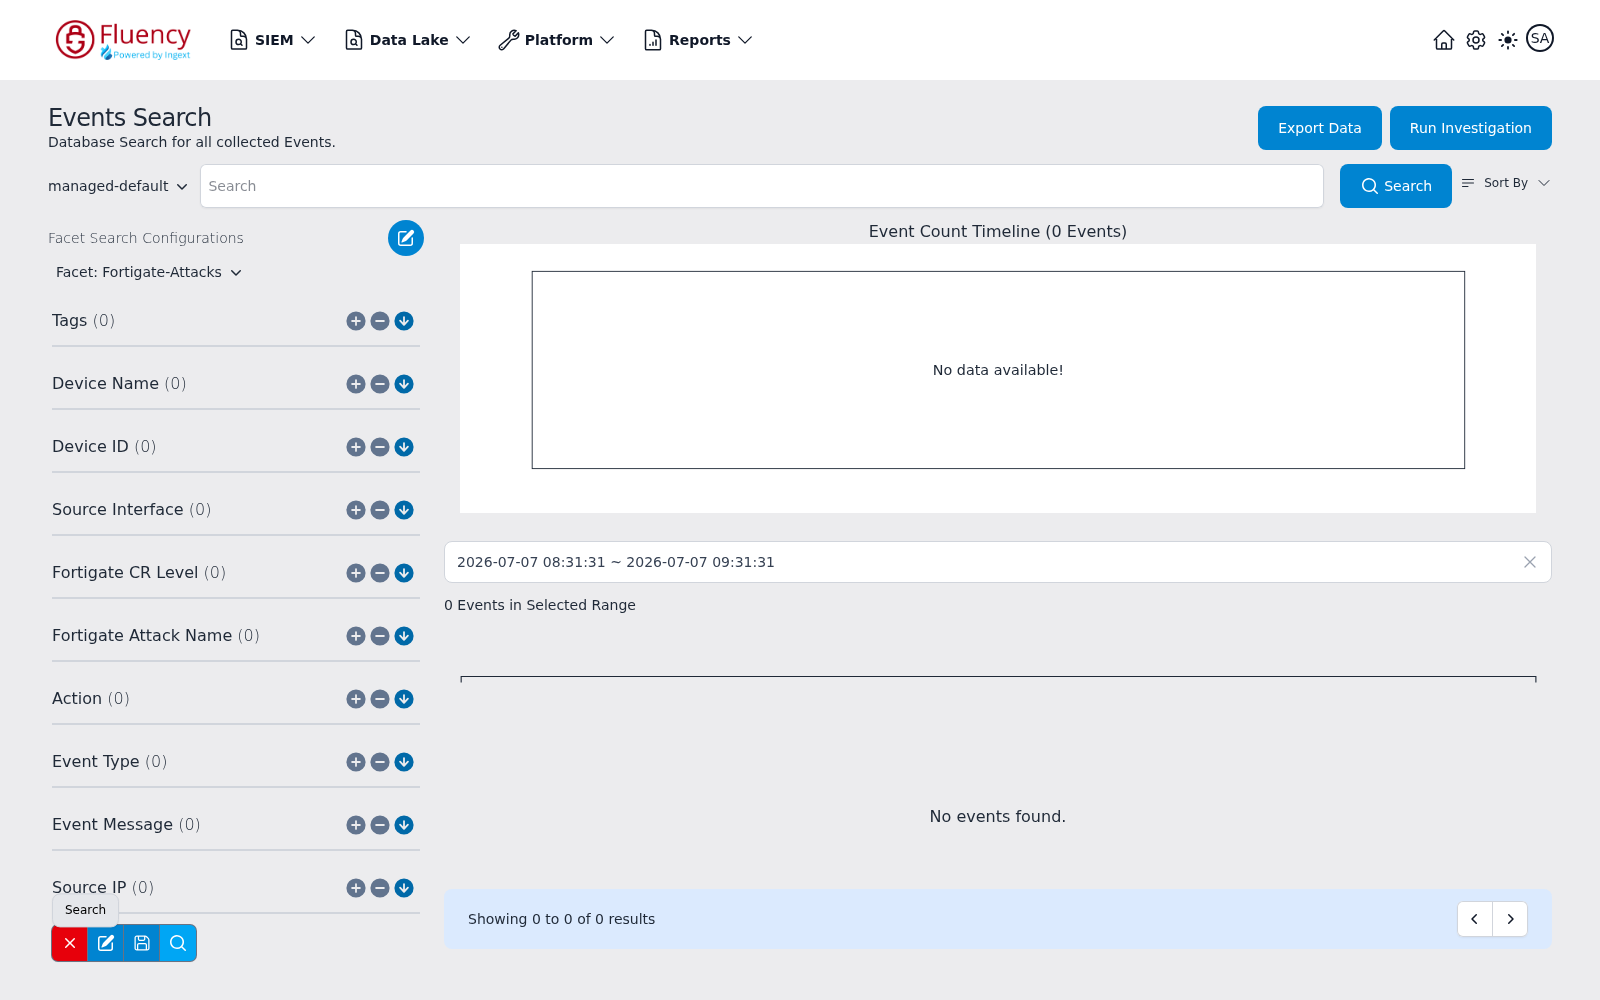
The magnifier button — tooltip Search — re-runs the search with the current facet setup. Like the Search button, it navigates to the search URL carrying the q, from, to, must, not, and index parameters — plus a profile parameter naming the applied facet configuration — refreshing both the results and the facet groups.
Event Count Timeline
The main column charts how many events the search matched over time. The heading shows the total for the search — Event Count Timeline (0 Events) in this capture — and with no matching events the chart area reads No data available!
Below the chart:
- A time-range field displays the current search window as start and end timestamps; click its x to clear the range.
- The Events in Selected Range line counts the events that fall inside the currently selected portion of the timeline.
Results
Matching events are listed beneath the timeline, ordered according to the Sort By setting. When nothing matches, the list reads No events found.
The footer bar reports the visible slice of the result set (Showing 0 to 0 of 0 results in this empty capture), with left and right arrow buttons to page through the results.