Creating a Report
A report is an FPL processor: code that queries stored data, shapes it, and emits the tables and widgets that become the report's output. This page walks through authoring one — opening the editor, writing the processor, declaring the arguments that make it reusable, running it and reading the trace and error logs, and saving it so it can be scheduled. If you would rather start from working code than from an empty editor, jump to the Report Cookbook.
Opening the Editor
Add Report
From Reports → Processors, the Add Report button leaves the list and opens the report editor at /platform/processors/report with a new, empty report.
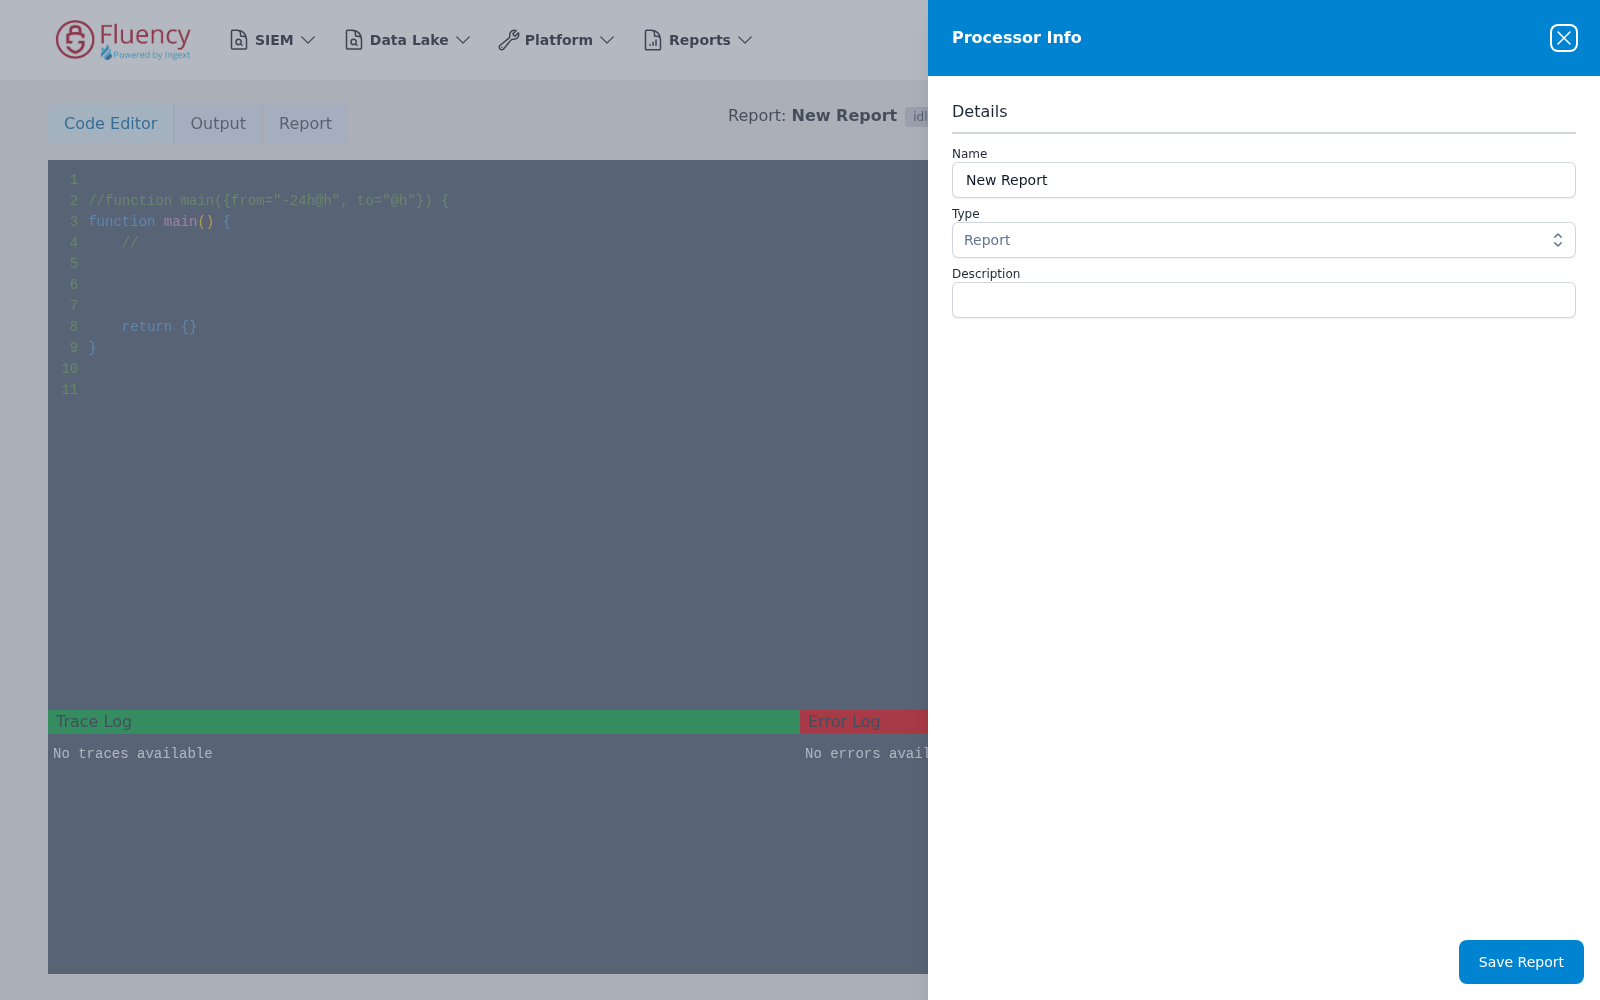
What the author lands on: the Code Editor, Output, and Report tabs, with the report name (New Report) and its run status in the toolbar. The Code Editor tab holds an FPL skeleton (function main()) plus Trace Log and Error Log panes, which read No traces available and No errors available for a new report. A Processor Info panel opens on the right with a Details form — a Name field prefilled with New Report, a Type dropdown set to Report, and a Description field — and Save Report at the bottom of the panel.
Cloning an Existing Report
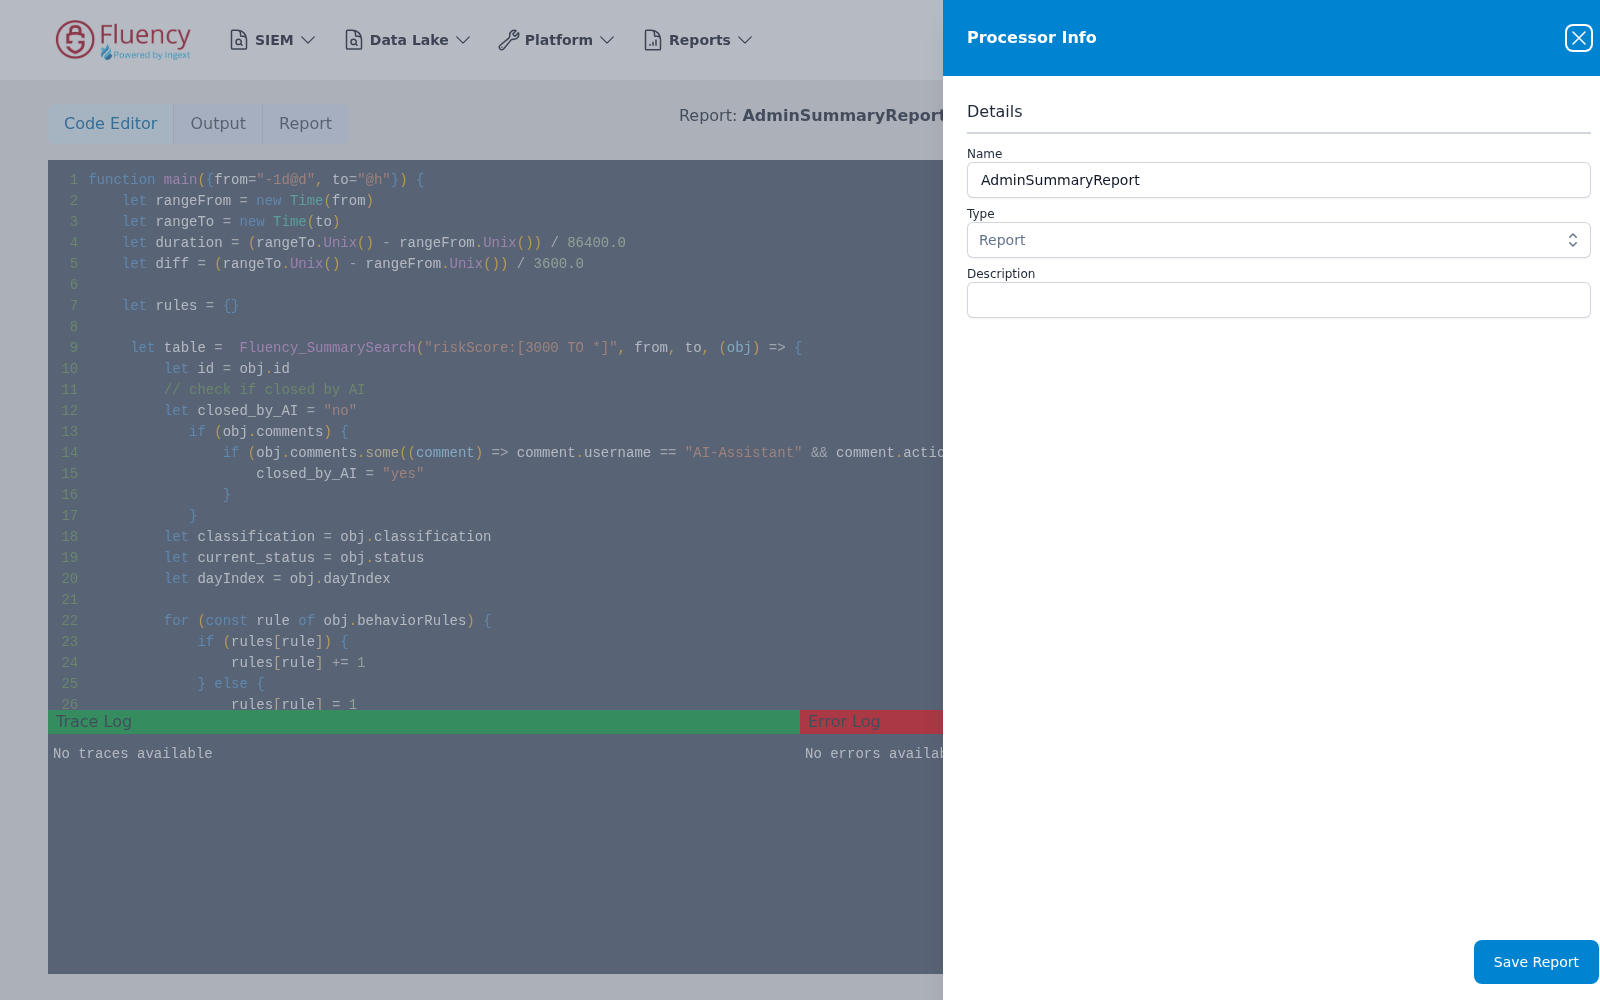
Clone — the only entry in a processor card's ... menu — opens the editor preloaded with the source processor's FPL. It is the fastest path to a first report; the clone opens with the source's name prefilled and an empty description.
Importing a Definition
Import Report on the Processors page opens the Import FPL Report as Processor dialog, which loads report definitions from a .json file and lets you select which to import.
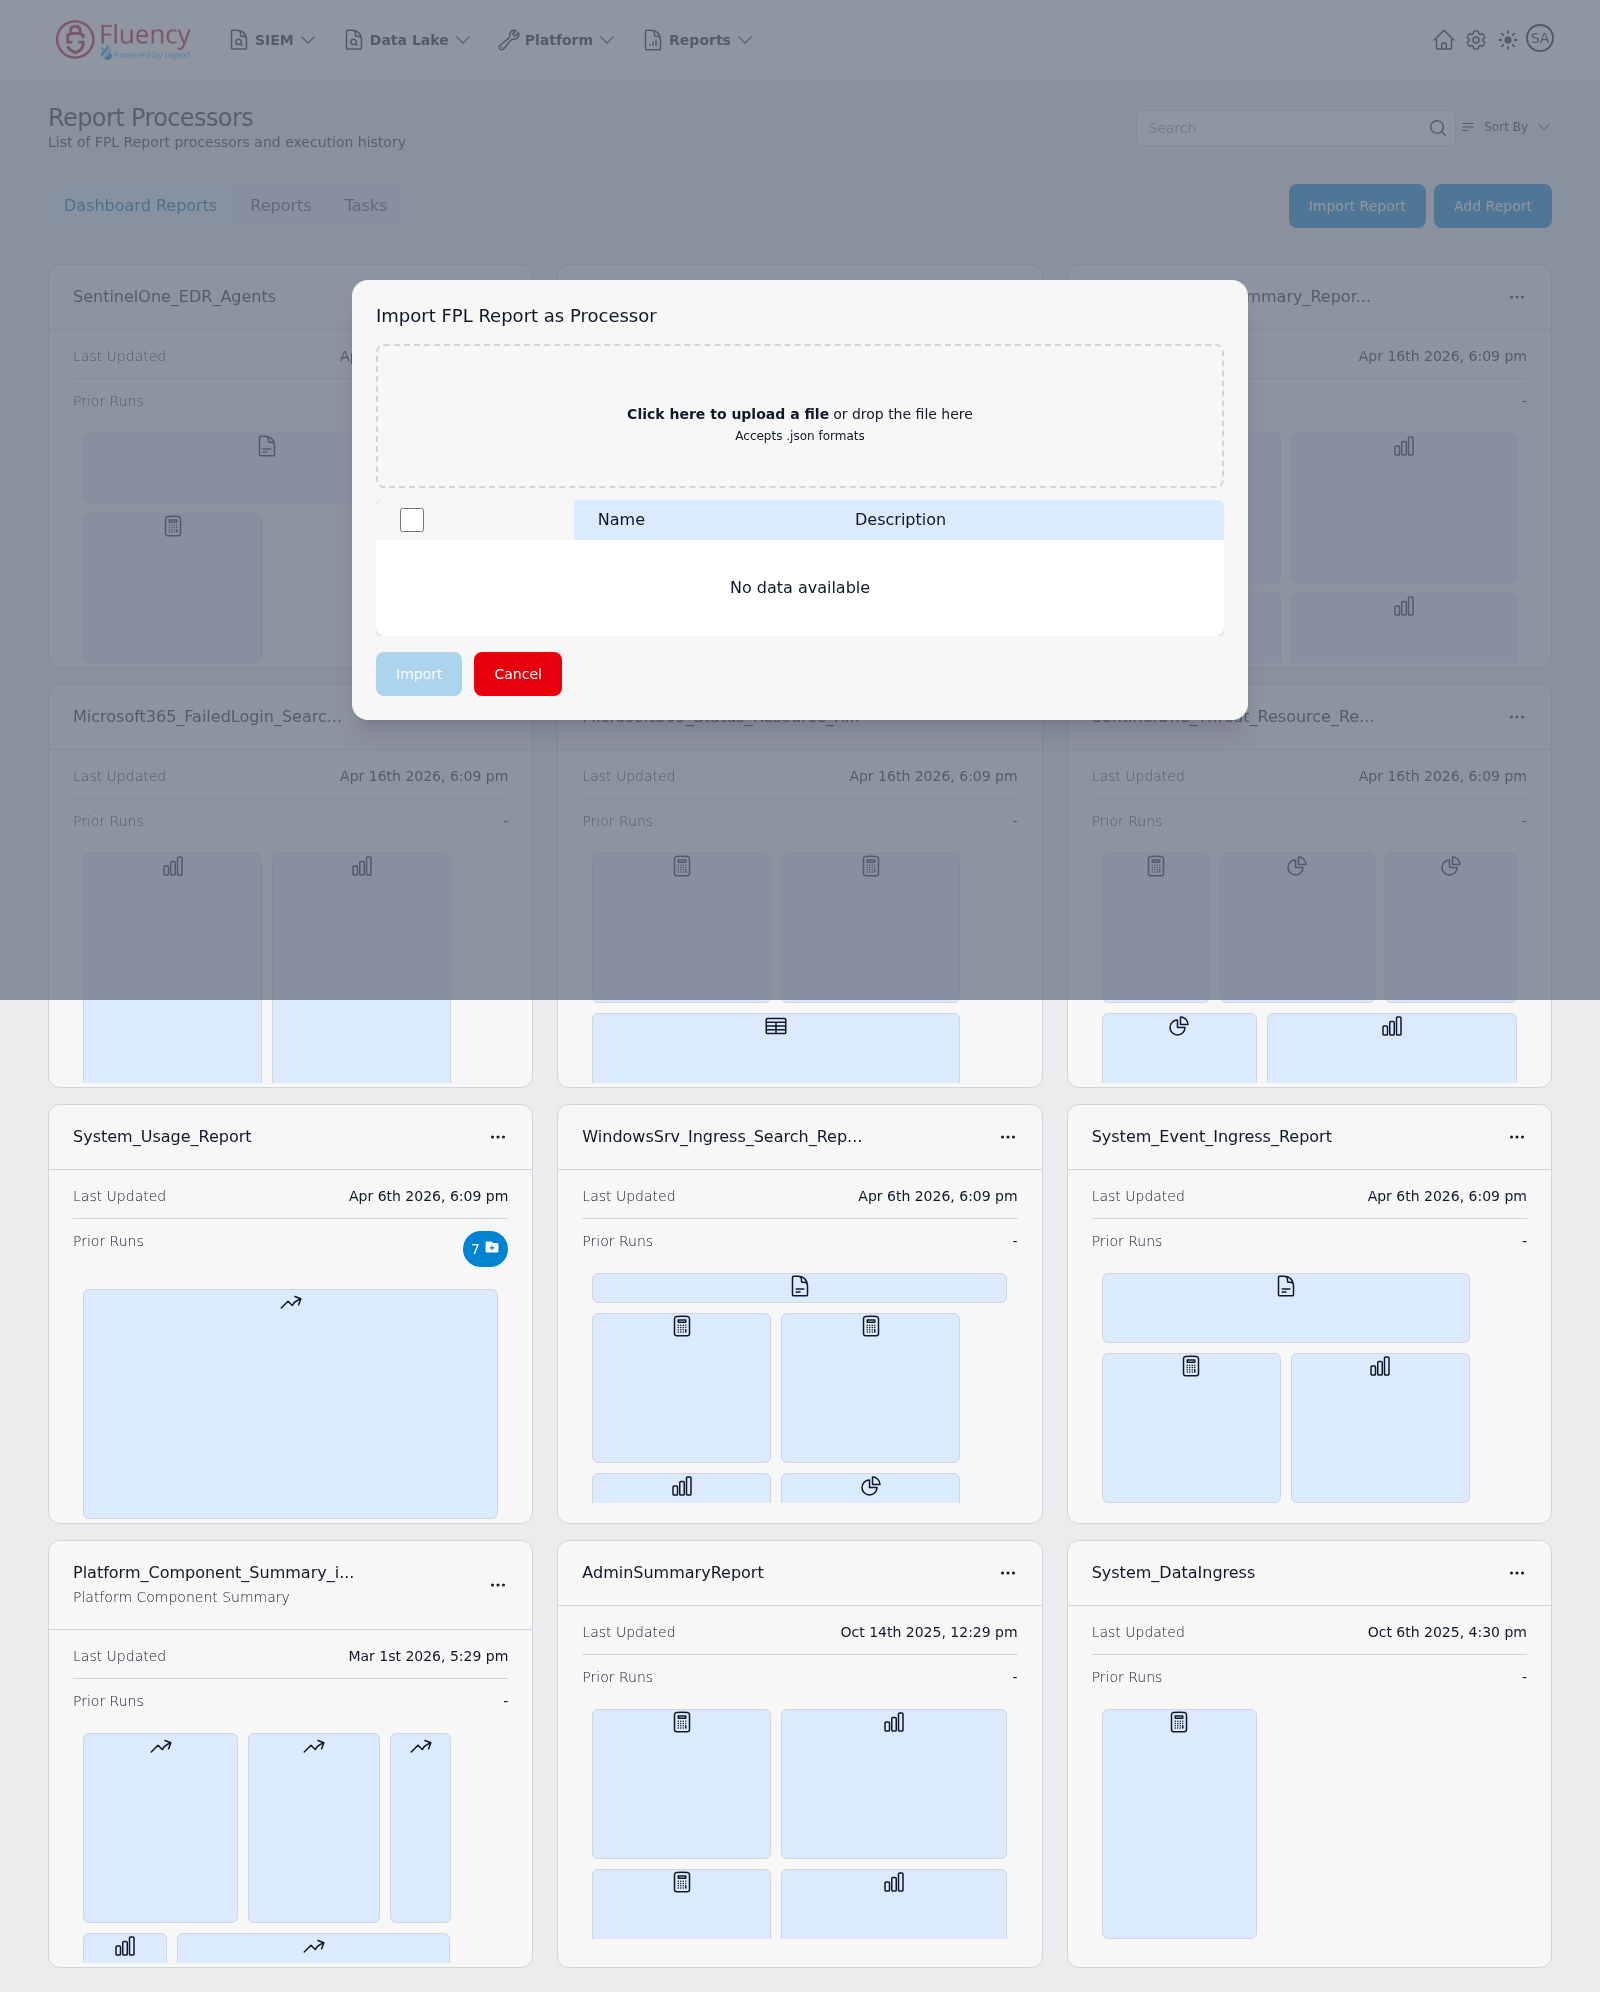
The dialog has an upload area labeled Click here to upload a file (or drop the file on it), a selection table with a checkbox column and Name and Description columns that reads No data available until a file is loaded, and Import and Cancel buttons — Import stays disabled until a file is loaded and a row is selected. This is also how reports move between accounts; the export side is in Scheduling and Delivery.
The Report Editor
Code Editor Tab
The FPL source. A new report opens with a function main() skeleton.
Output Tab
The raw result of the last run — what the processor actually emitted, before rendering. This is where an author checks field names and row counts.
Report Tab
The rendered view of the result: the widgets as a reader will see them.
Trace Log
The processor's trace output, reading No traces available until the report has run. Trace lines emitted by the processor are the primary debugging surface.
Error Log
Runtime errors from the last run, reading No errors available for a new report.
Processor Info Panel
The Details form on the right — Name, Type (set to Report), and Description — plus Save Report. The description is what appears on the processor card and in the Scheduler table.
Worked Examples
Point at the existing report scripts rather than duplicating them: complete, working report processors already live in Appendix → Cookbooks → Reports, covering Azure AD logins, behavior summary, event ingress, an Active Directory resource-loading task, and an Office 365 user-activity investigation. The Report Cookbook page routes to each one and says what it demonstrates.
Related
- Reports — how reporting works end to end
- Report Cookbook — worked report scripts
- Dashboards — rendering the result
- Scheduling and Delivery — running it on a schedule
- Programming Language — FPL reference
- Page Functionality → Processors — the editor and list, control by control
- Appendix → Cookbooks → Reports — existing report scripts