Behavior Timeline
The screenshots and several interactions on this page — the magnifying-glass pivot to Events Search, the expandable risks table, and the Actions / FPL Actions buttons — are from an older version of the interface and are not covered by the current SIEM → Behavior Timeline reference. On the current page each event is a card with a View JSON row menu and Alerts / Attributes toggle buttons. The interactions below need to be re-verified against the current product.
Sign in to your Fluency portal at https://<companyname>.app.ingext.io — see Fluency Web Interface for the URL formats.
Choose the Behavior Timeline option under the SIEM menu in the navigation bar.
The Behavior Timeline page (/SIEM/behaviorTimeline) displays instances where behavior models were triggered. When creating a behavior model, there is a checkbox to indicate whether an event should appear on the behavior timeline when triggered by the rule. The chart at the top of the page plots each event's risk score over the search window.
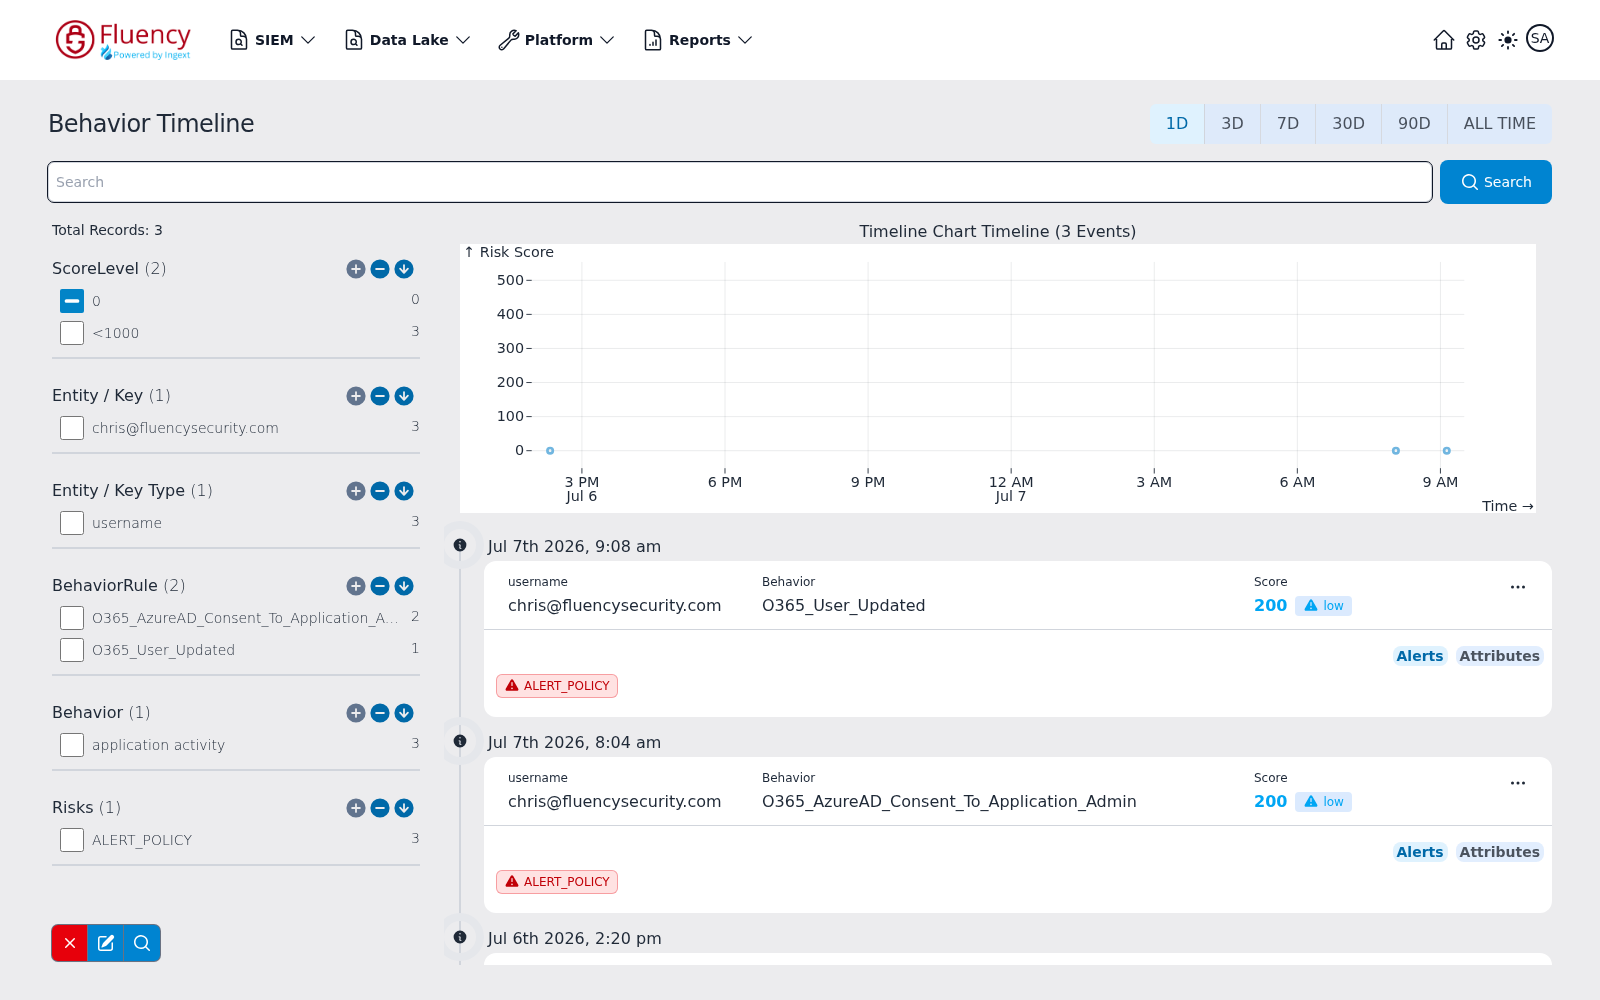
The header row carries the page title on the left and the time-range presets on the right — 1D (the default), 3D, 7D, 30D, 90D, and ALL TIME — followed by a full-width Search field with a Search button. Searches are combined with the selected time range and any facet selections.
The chart is headed Timeline Chart Timeline with the number of plotted events in parentheses. It plots one dot per event, with Risk Score on the vertical axis and time of day on the horizontal axis (labeled Time).
The facet on the left side can be used to filter events. There are six fields associated with a behavior rule that can be used for search filters: key, key type, behavior rule, behavior, score level and risks. The sidebar starts with a Total Records count, and each facet lists its values with the matching event count on the right; a checkbox in the minus state excludes the value, and by default the 0 score bucket is excluded so zero-score events stay hidden. The Facet Section covers the sidebar and its toolbar in detail.
Below the chart, events are listed newest first along a vertical timeline, grouped by timestamp — a group can hold more than one card when several events share a timestamp. Each card shows the entity involved (username), the Behavior rule the event matched, the Score with a severity chip such as low, and an ellipsis (...) menu button in its upper-right corner.
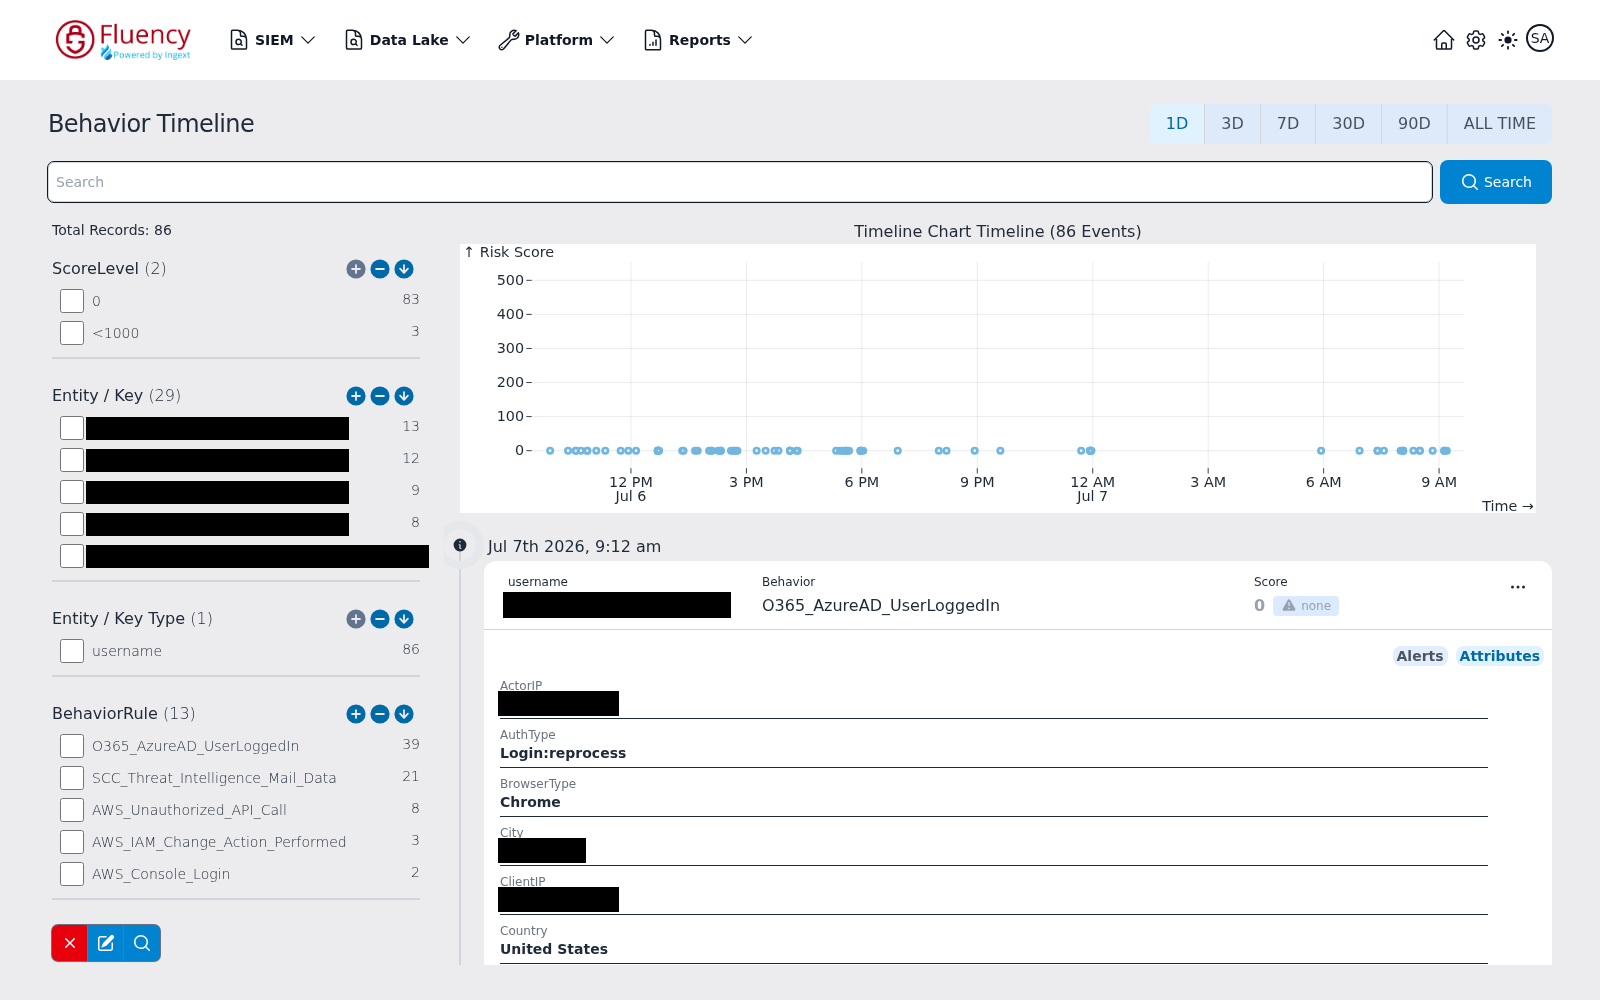
Every entry has a pair of toggle buttons on the right edge of its lower panel. Alerts — the default view — shows tag chips for the alerts and risk tags the event raised (for example a red ALERT_POLICY chip). Attributes replaces the tags with the event's attribute fields as labeled rows; the fields depend on the event source, an Azure AD sign-in event showing ActorIP, AuthType, BrowserType, City, ClientIP, Country, and the like.
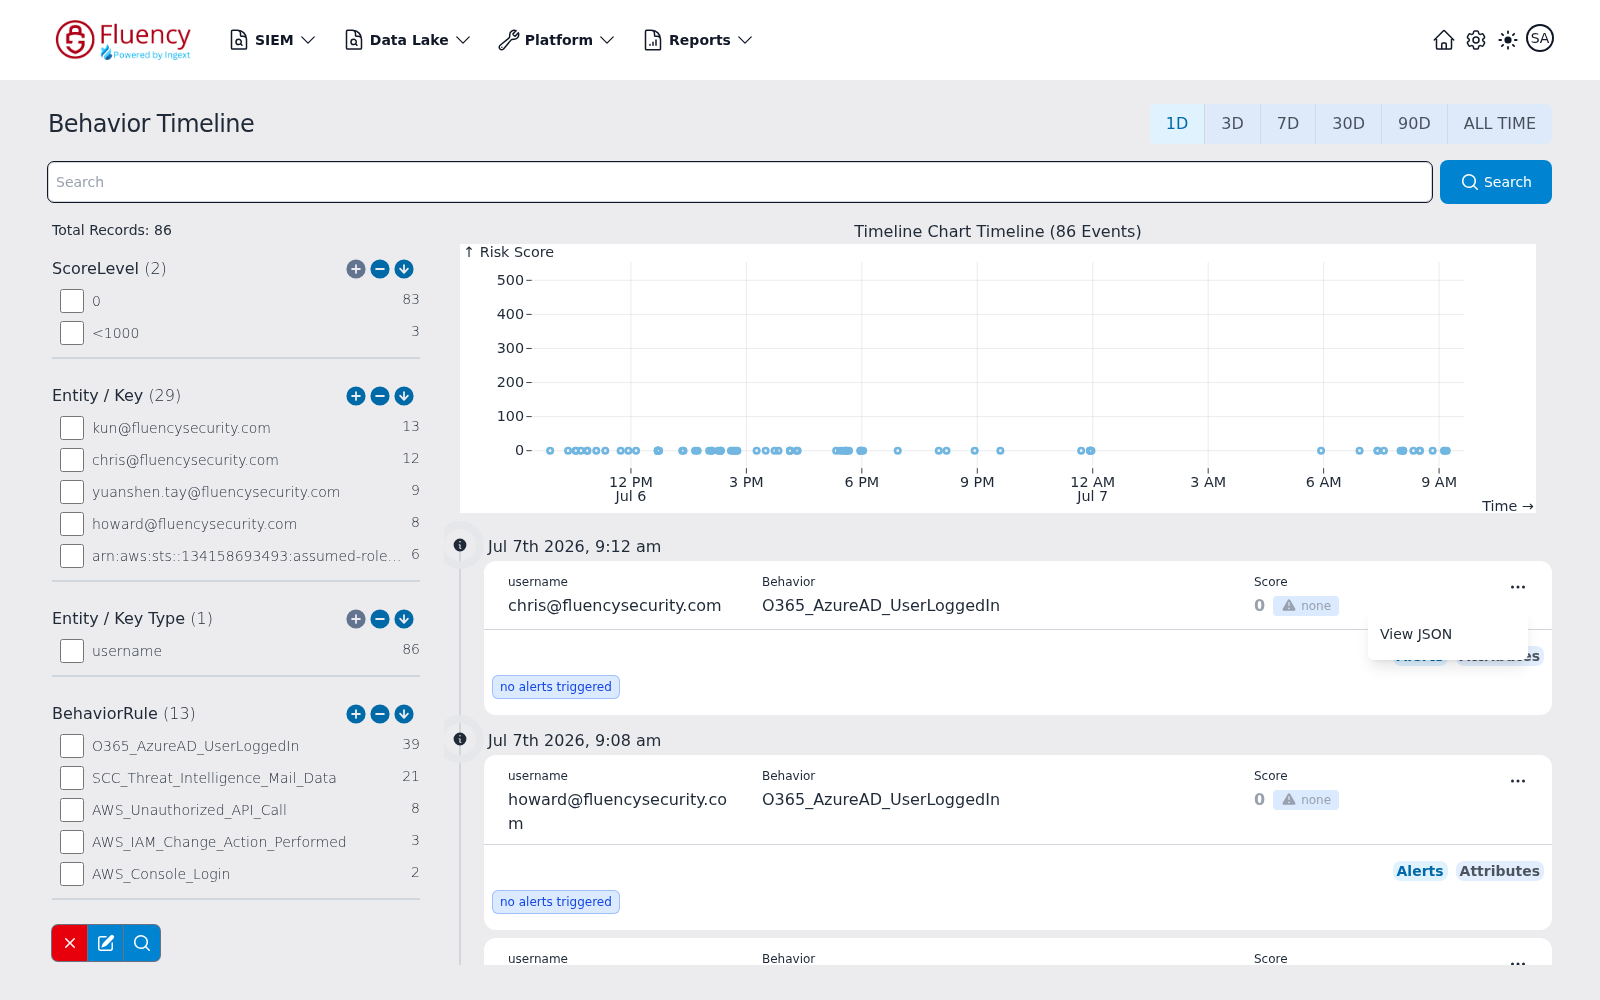
The ... menu on a card holds one option, View JSON.
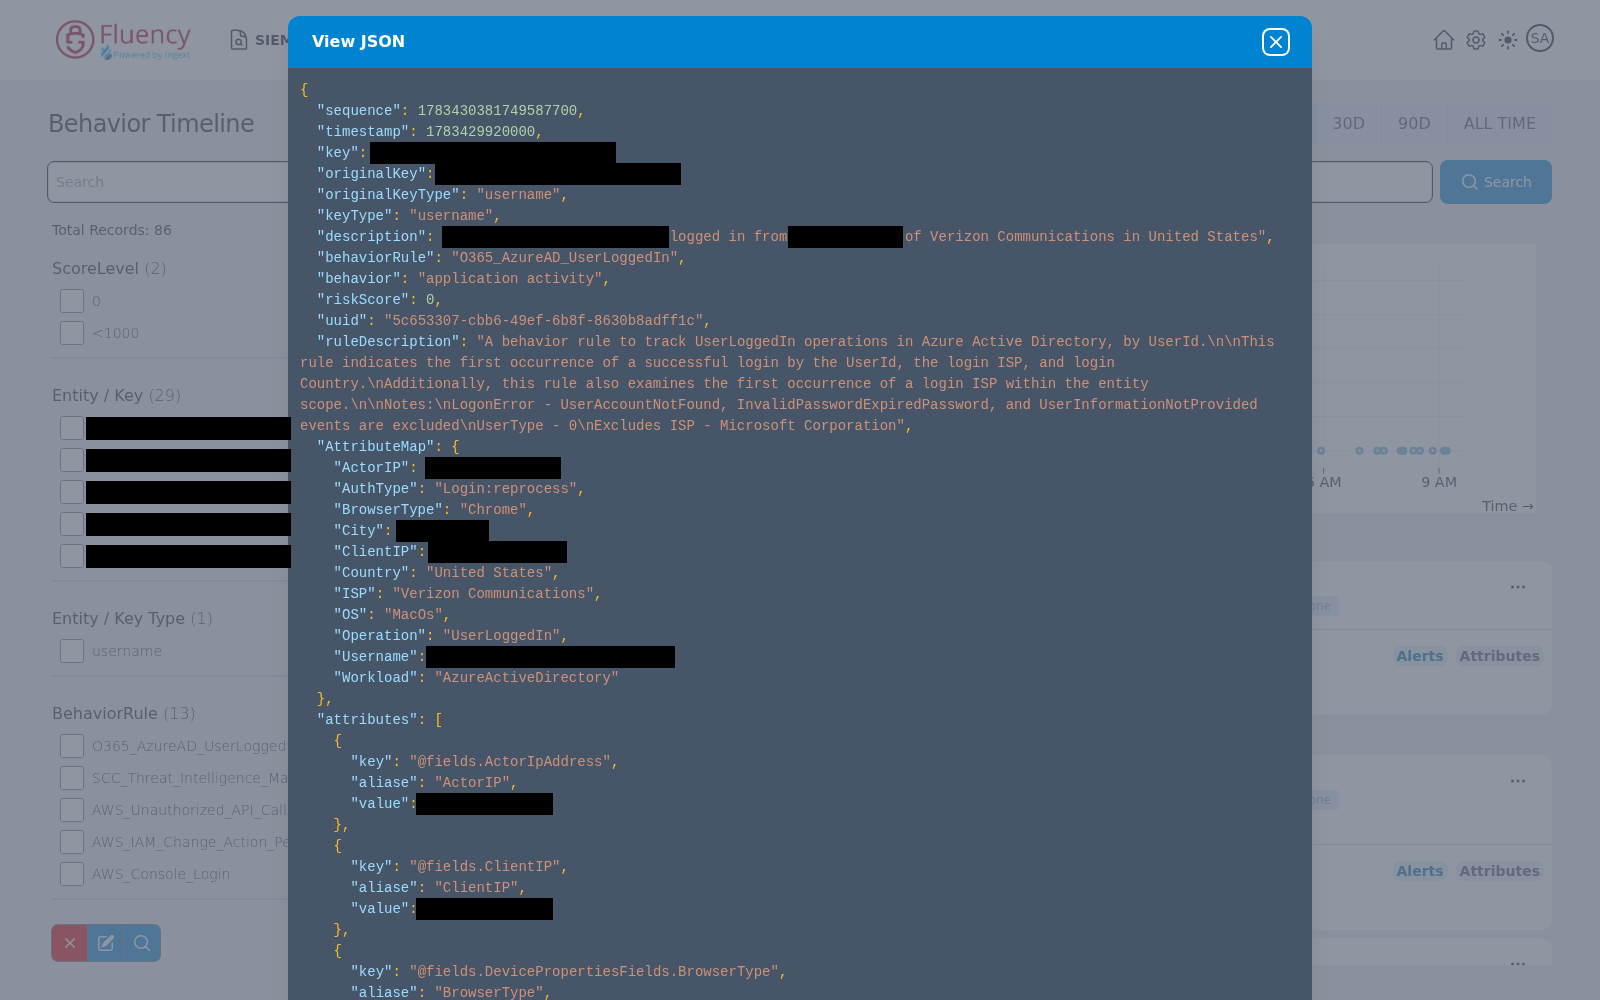
View JSON opens a dialog of the same name showing the full event record as color-coded JSON: event fields such as sequence, timestamp, key, keyType, description, behaviorRule, behavior, riskScore, uuid, and ruleDescription; an AttributeMap object holding the same attribute fields the Attributes panel lists; and an attributes array pairing each raw source field with its alias and value. The X at the right end of the title bar closes the dialog.
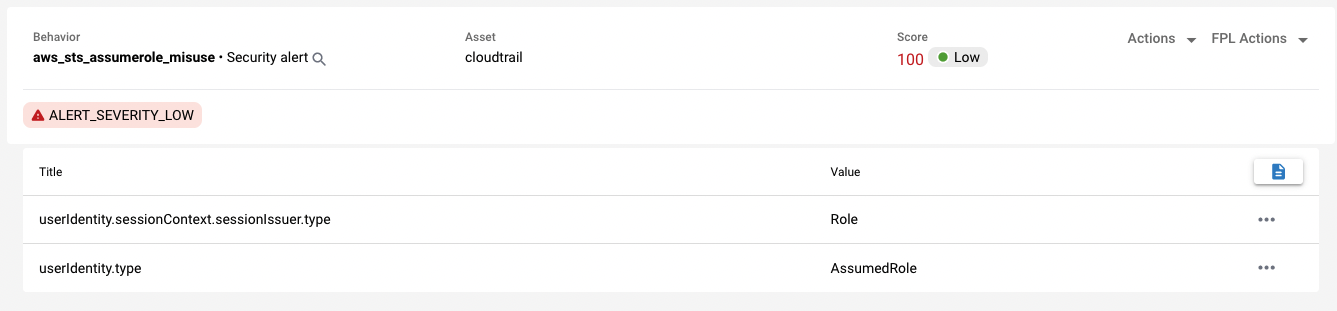
Clicking on the magnifying glass icon of each record redirects you to the Events Search page (Data Lake → Search) and conducts a search using the name of the behavior alert and the alert's key as the search parameters. Refer to Investigating a Behavior Alert to see what you can do on the Events Search page.
In the figure below, the first value in the header is the name of the behavior model that triggered the alert. Beside this is the behavior type. In the middle of the header, the key is displayed (in this case, it's "asset"), followed by the score associated with the alert. Below this are the risks that were triggered, in addition to their descriptions and values (click the table to expand). Clicking the blue icon in the corner of the table opens the JSON data associated with the event.
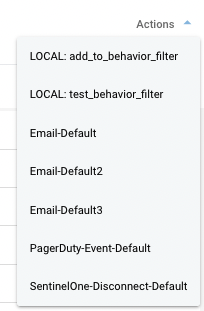
Click the "Actions" button to open a menu with options for configuring different actions for this alert. Actions allow a user to set up a method of notification when certain alerts or behaviors are triggered. Clicking one of these options will redirect you to a configuration page for the indicated action option.
To the right of the "Actions" button, there's also a "FPL Actions". At present, there's only one action named "SentinelOneClassify".