Investigating a Behavior Alert
This walkthrough was written against an older version of the interface. Its screenshots, and the pivot controls it relies on (clicking a record to open Behavior Summary, the magnifying-glass icons, the pencil edit icon), are not covered by the current Page Functionality reference and need to be re-verified. The pages themselves still exist under the current menus: SIEM → Overview Summary, SIEM → Behavior Summary, SIEM → Behavior Timeline, SIEM → Behavior Rules, and Data Lake → Search.
When a behavior alert is triggered, more information is often needed in order to determine whether the alert is a real hit or a false positive. This is easy to do using the Fluency interface, as you are able to easily pivot between places to dig deep into an alert.
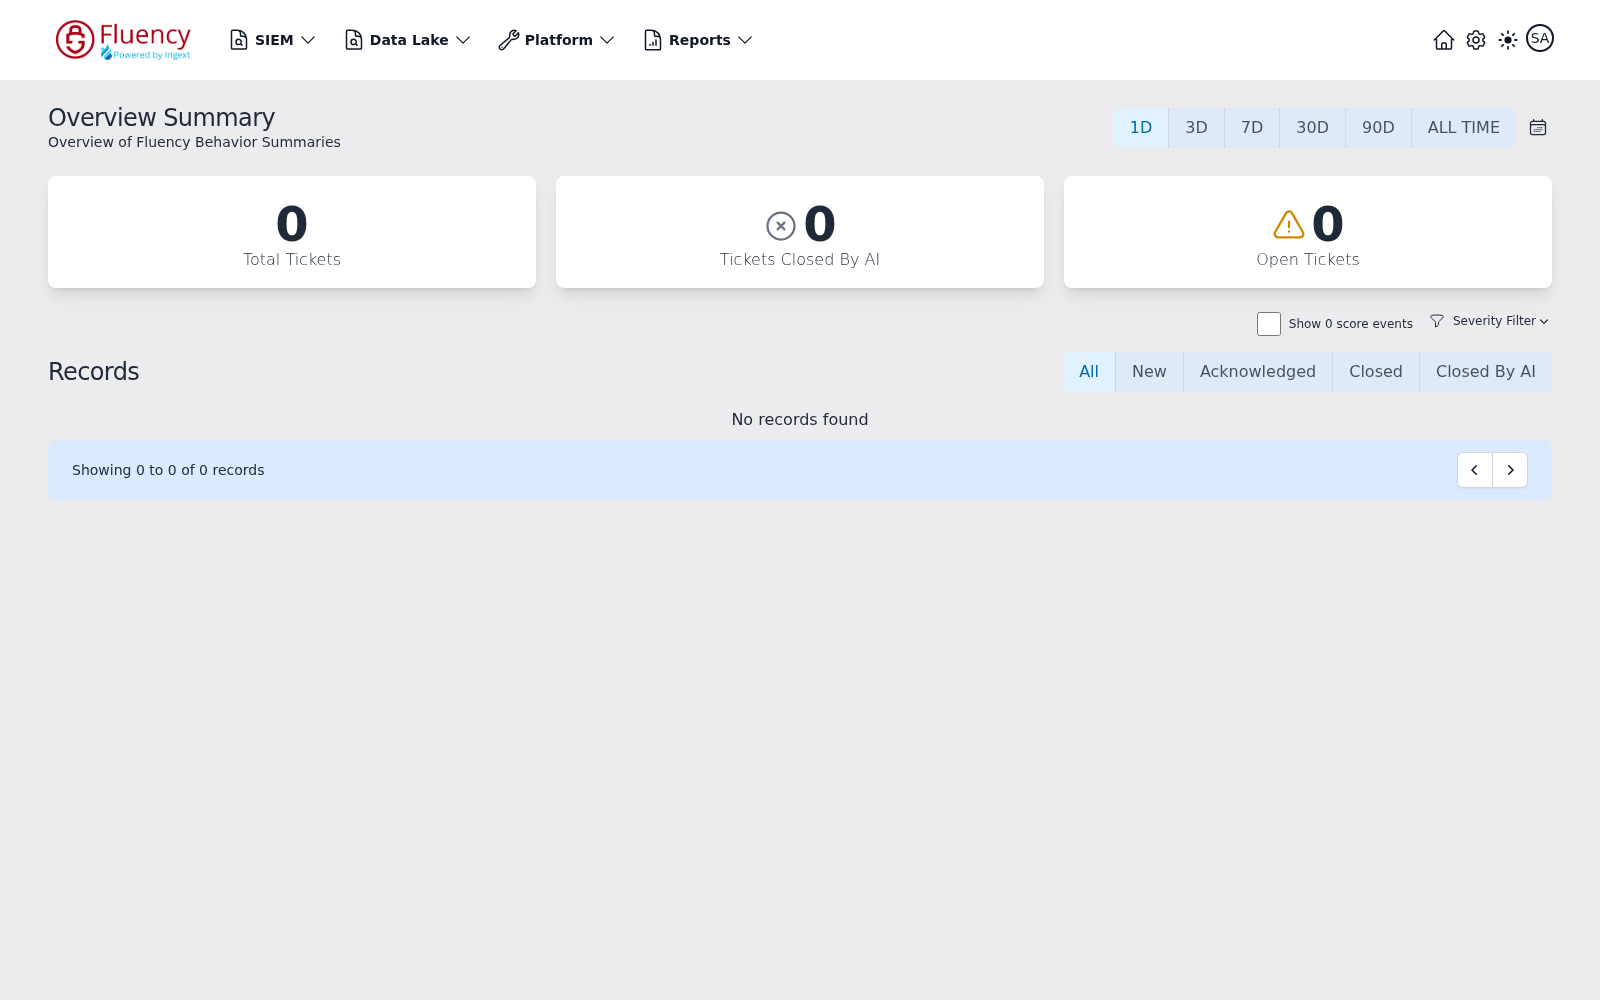
First of all, behavior alerts can be viewed from the Overview Summary option under the SIEM menu.
In the current interface that page looks like this:
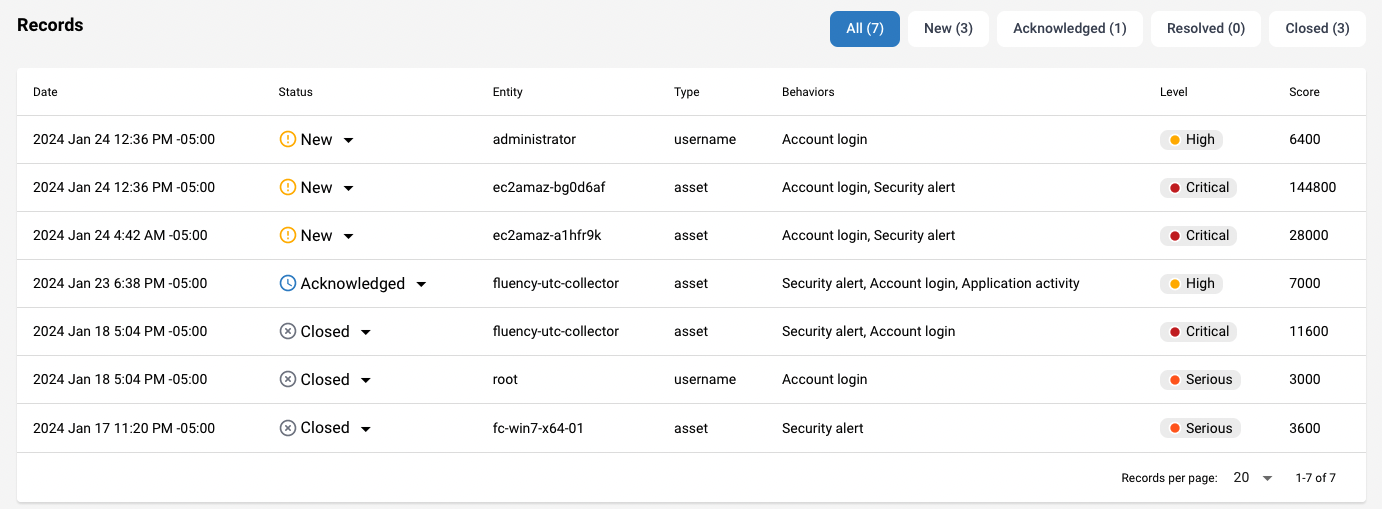
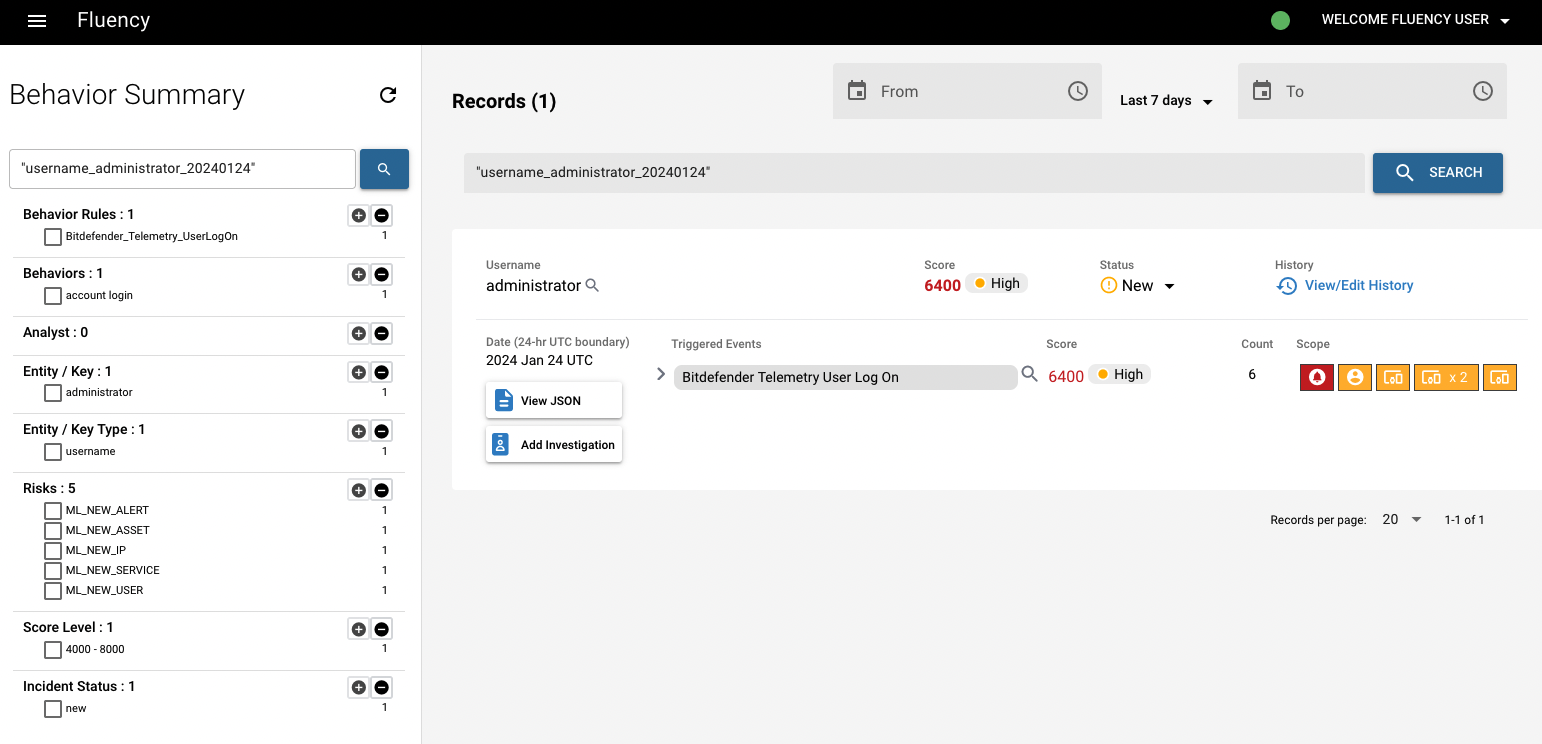
From here, you will be able to see key information, including date, status, entity, key, behavior type, level and risk score.
Taking the first record as an example with a high risk score and a risk level of "Critical" assigned, click this record and it will navigate to Behavior Summary page.
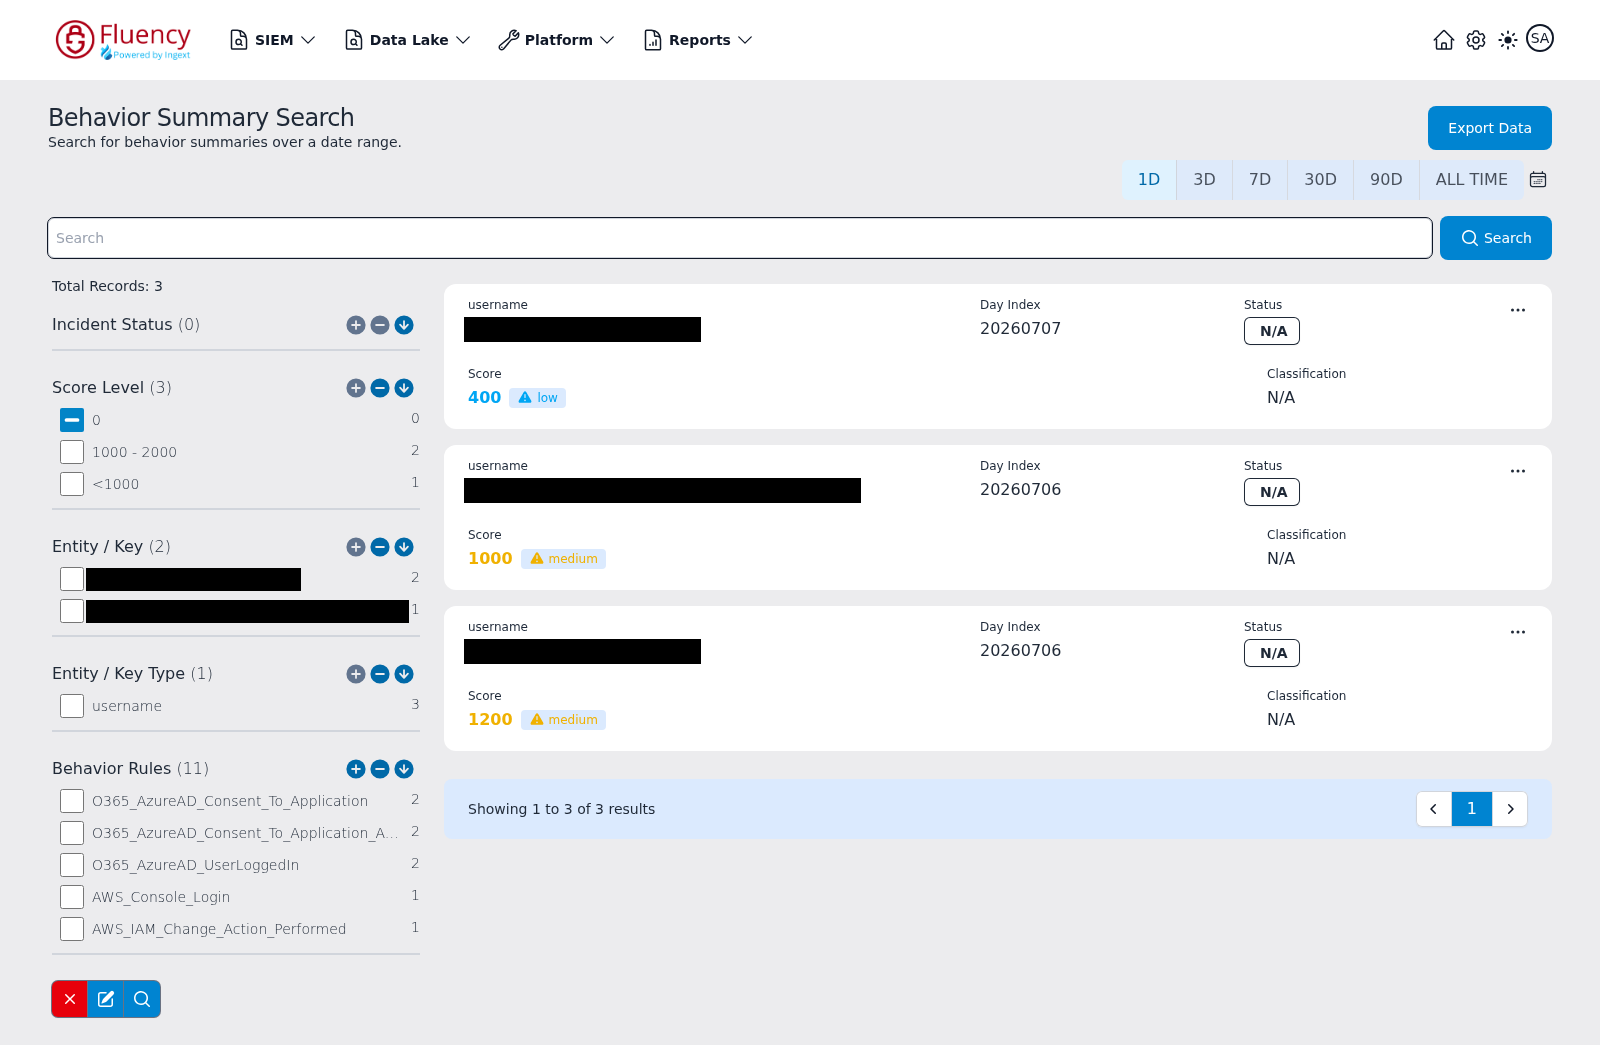
In the current interface the Behavior Summary page presents one card per summary, each carrying the entity (username), the Day Index, the Status badge, the Score with its severity chip, and the Classification:
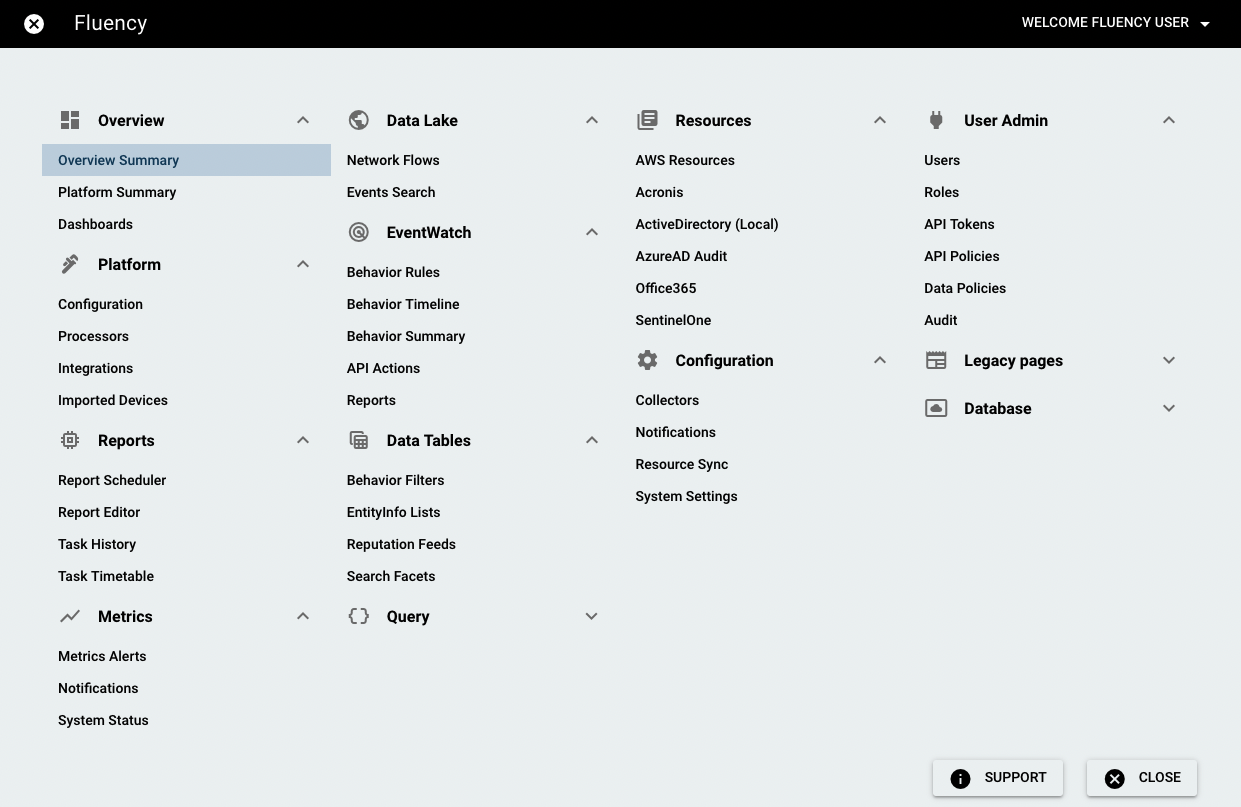
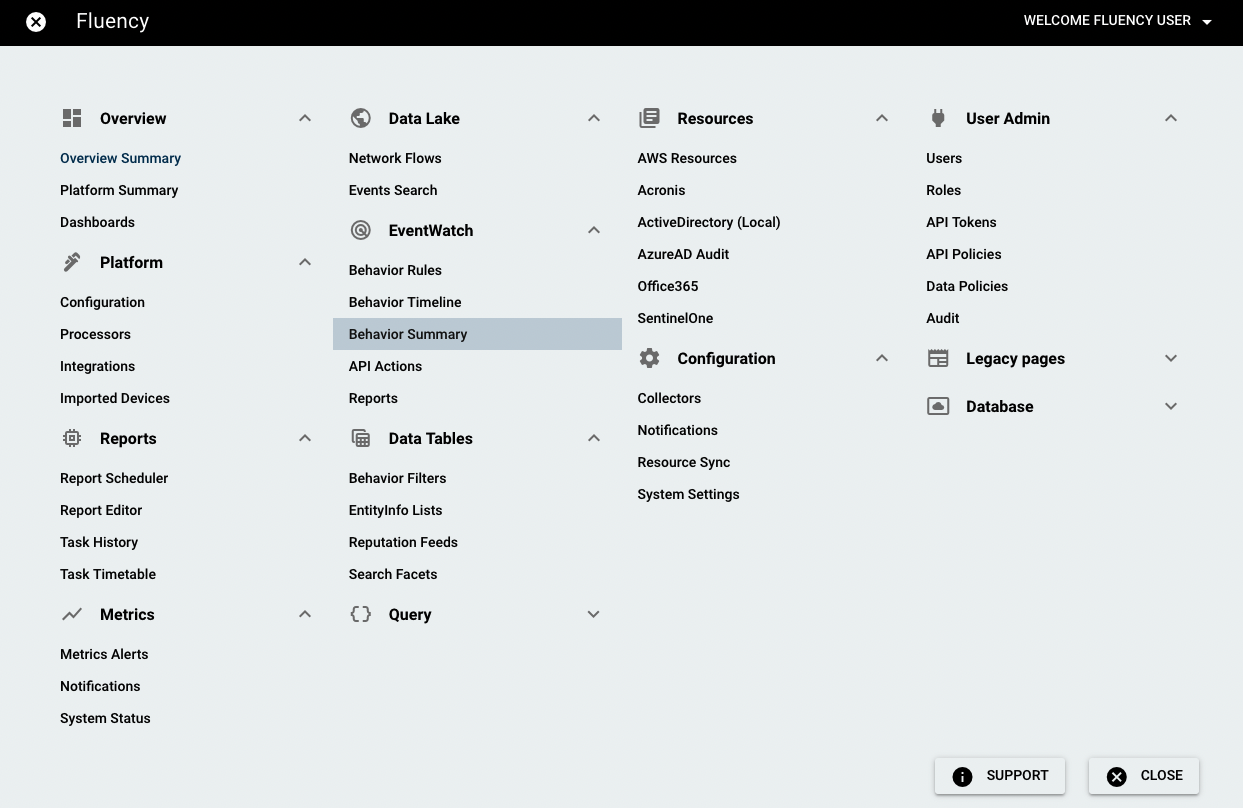
Note: You can also get to this page through the main menu like below, but it will show you all the behaviors.
On the Behavior Summary page, you can see all the triggered events from this entity. To the right of that are the corresponding risk scores, in addition to the number of events that triggered them.
You are going click the magnifying glass icon next to the name of "asset" (Or you can also click the icon next to each "triggered events", to see the specific triggered event under this asset). The magnifying glass icons allow you to pivot to the Behavior Timeline page and dig deeper into the occurrences associated with the behavior alert.
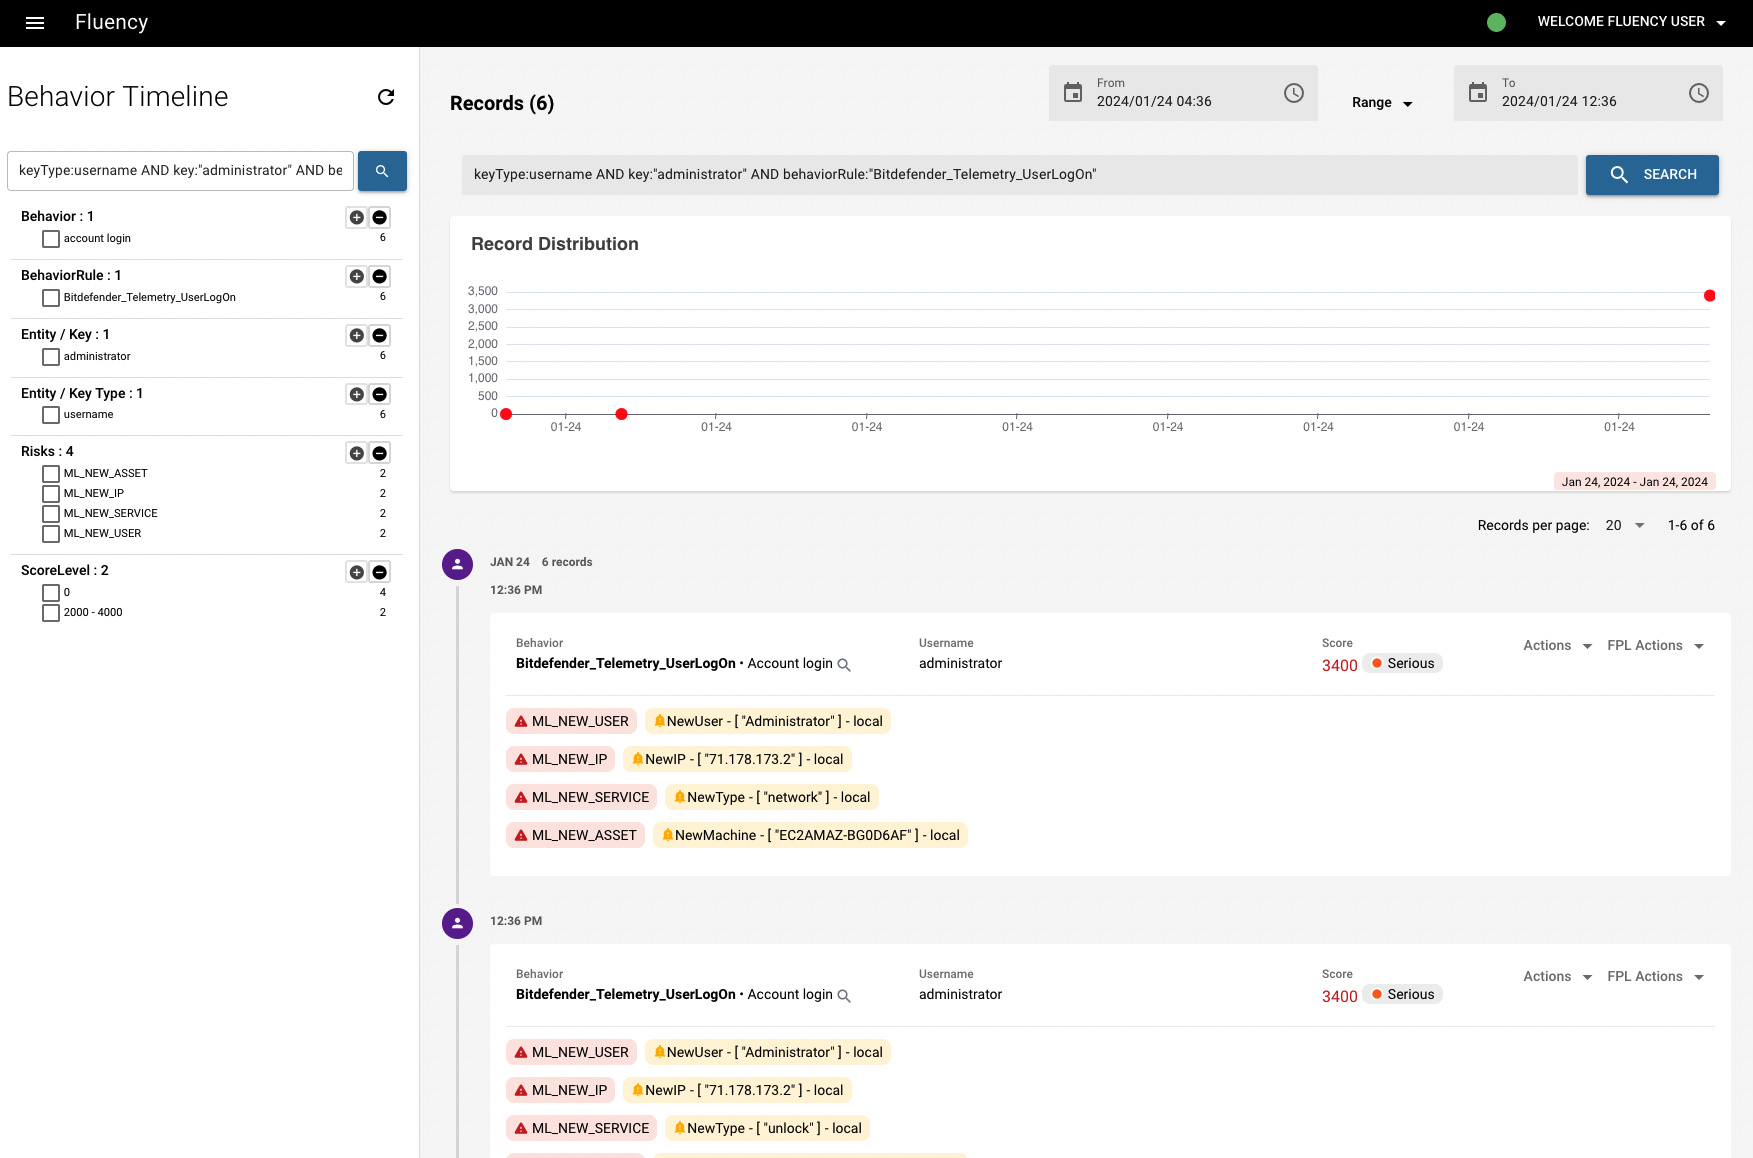
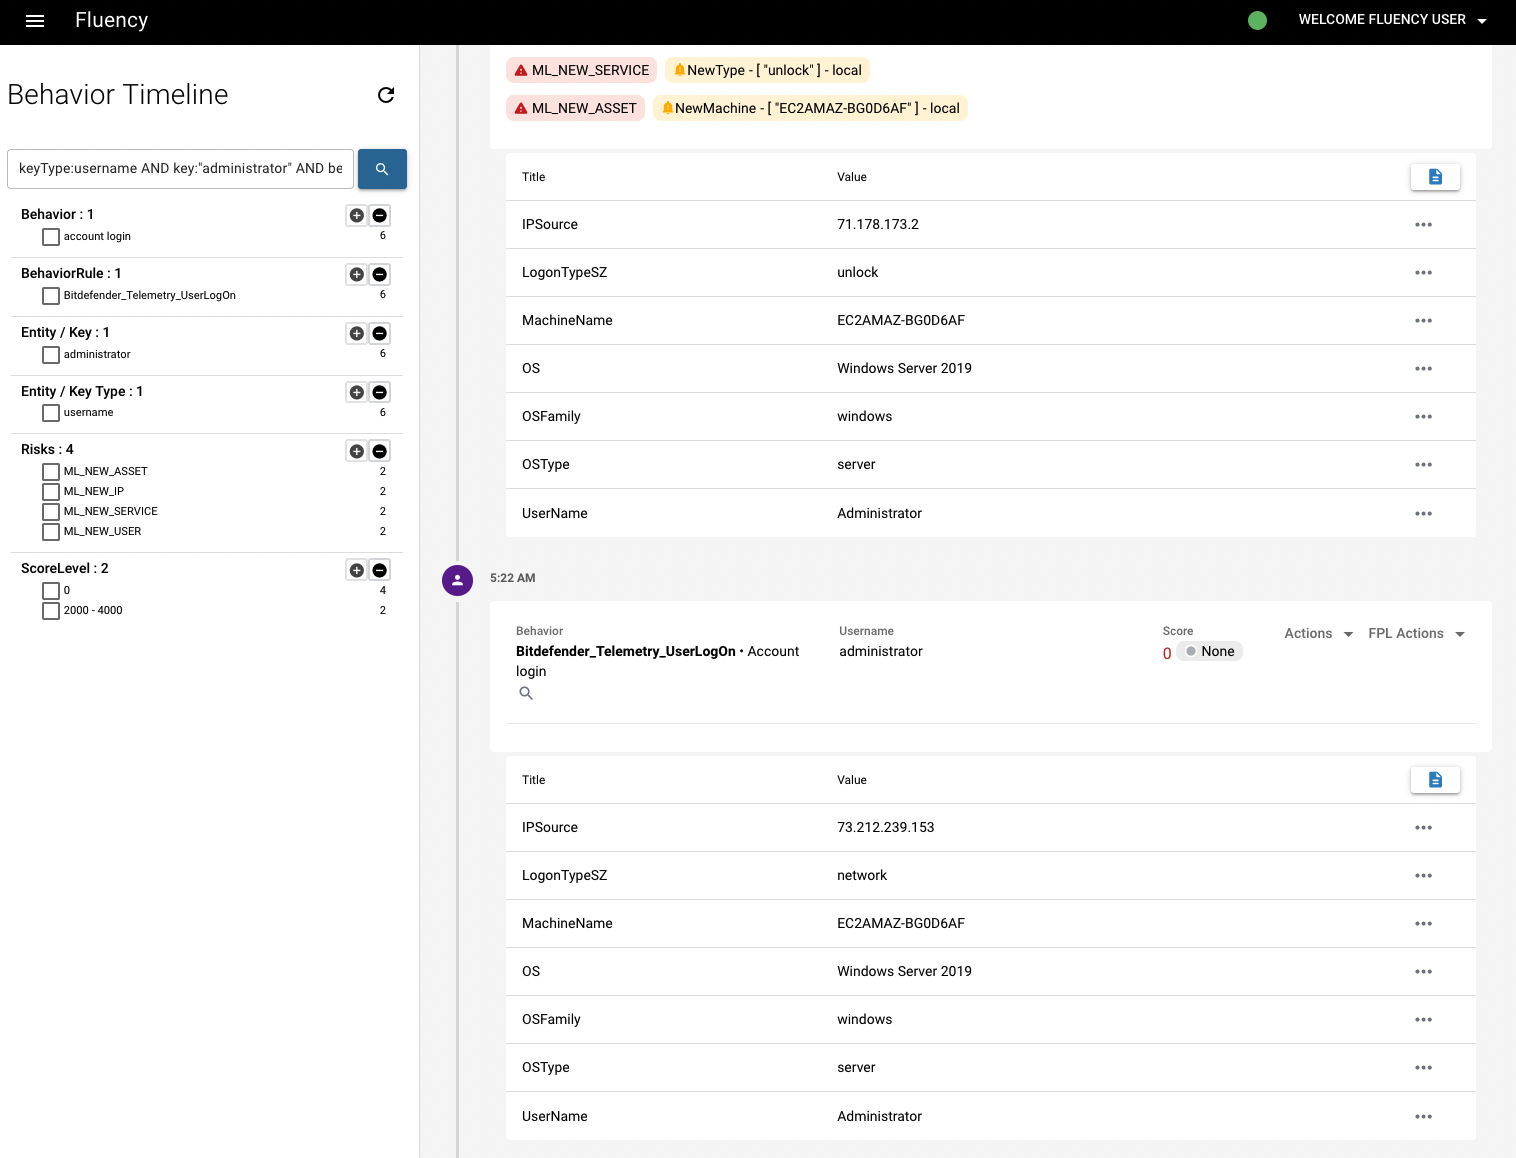
In the current interface the Behavior Timeline page plots the events on a risk-score chart and lists them newest first, each card carrying the entity, the Behavior rule it matched, its Score, and Alerts / Attributes toggle buttons:
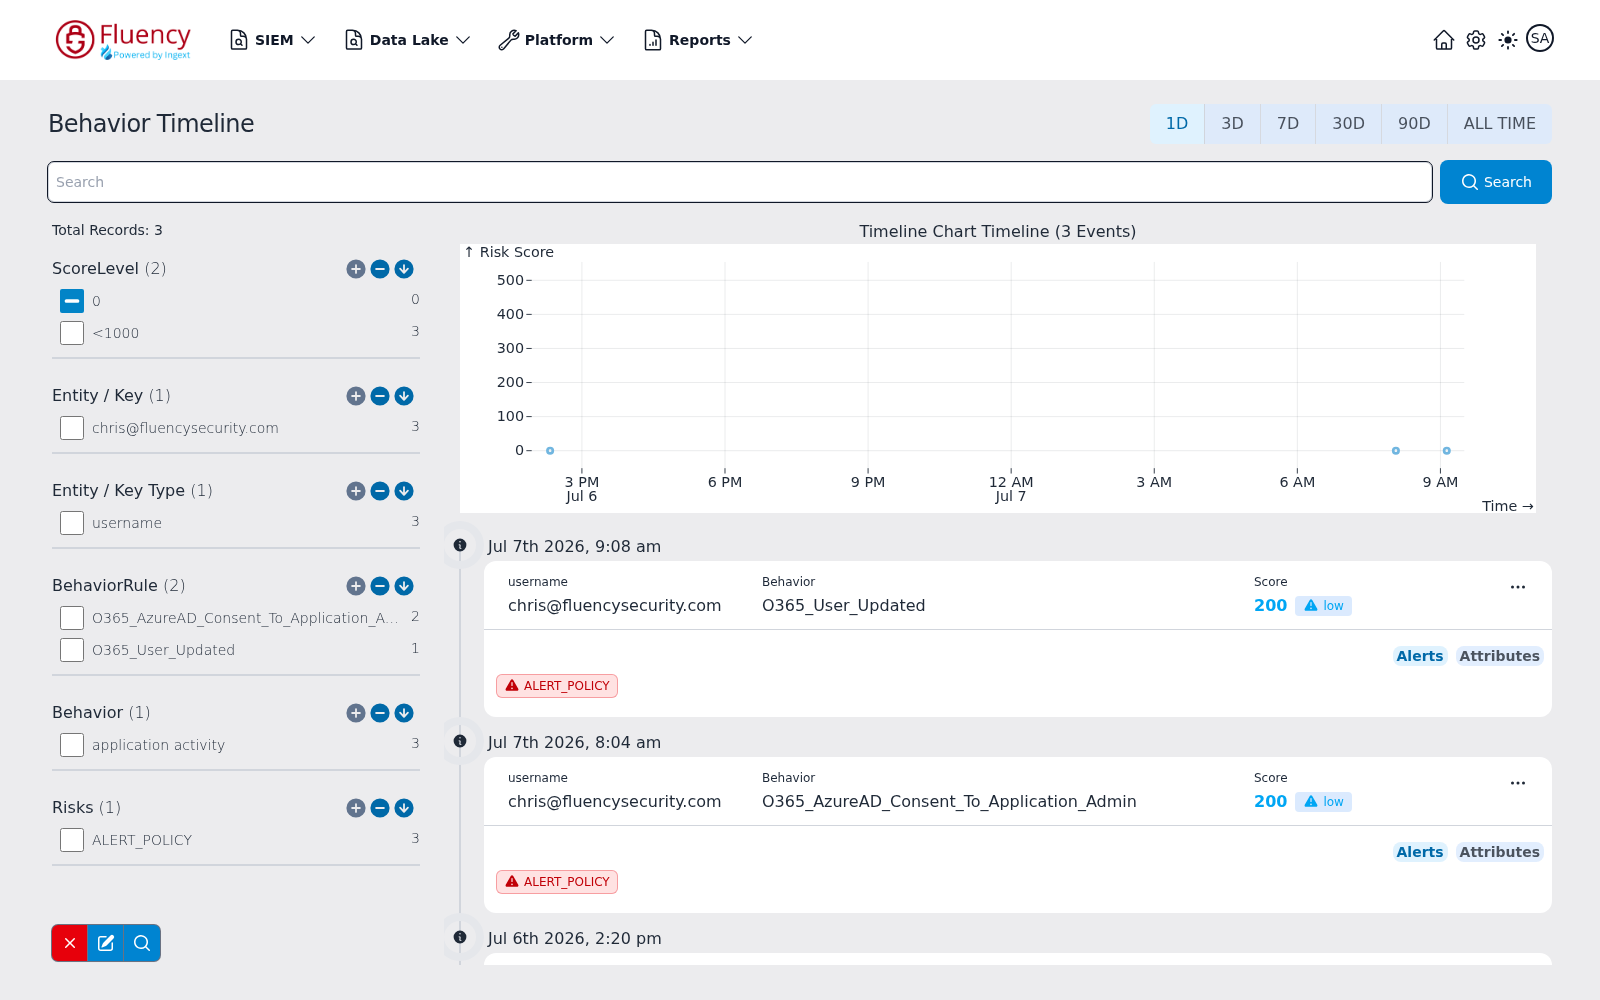
Pivoting to the Behavior Timeline page allows you to view all the behavior model hits that occurred in relation to the key type, depending on which record did you chose from the Summary page and which magnifying glass icon did you click from the Behavior Summary page. In this case, you can see the query is filled in with both the "keyType" (asset) and the "key" (the name of asset) in the search bar. Each of these summary hits can be expanded to view all the field data associated with it.
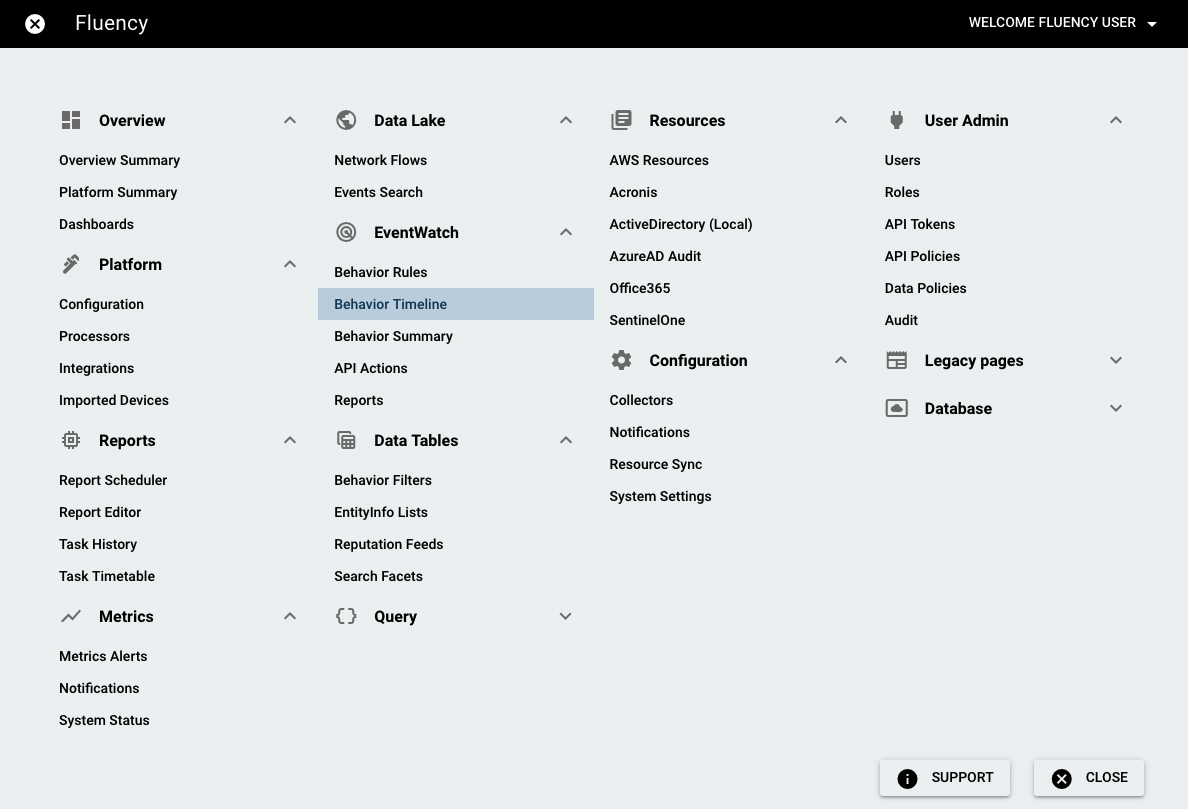
Note: You can also get to this page through the main menu as below. This will show you all the behaviors, not limited to the specific key type mentioned above.
Expanding all the records on the Behavior Timeline page, you can see that there are still limited information given, such as EventID, Hostname, etc.. Some crucial information that you want to know are missing, such as IP address.
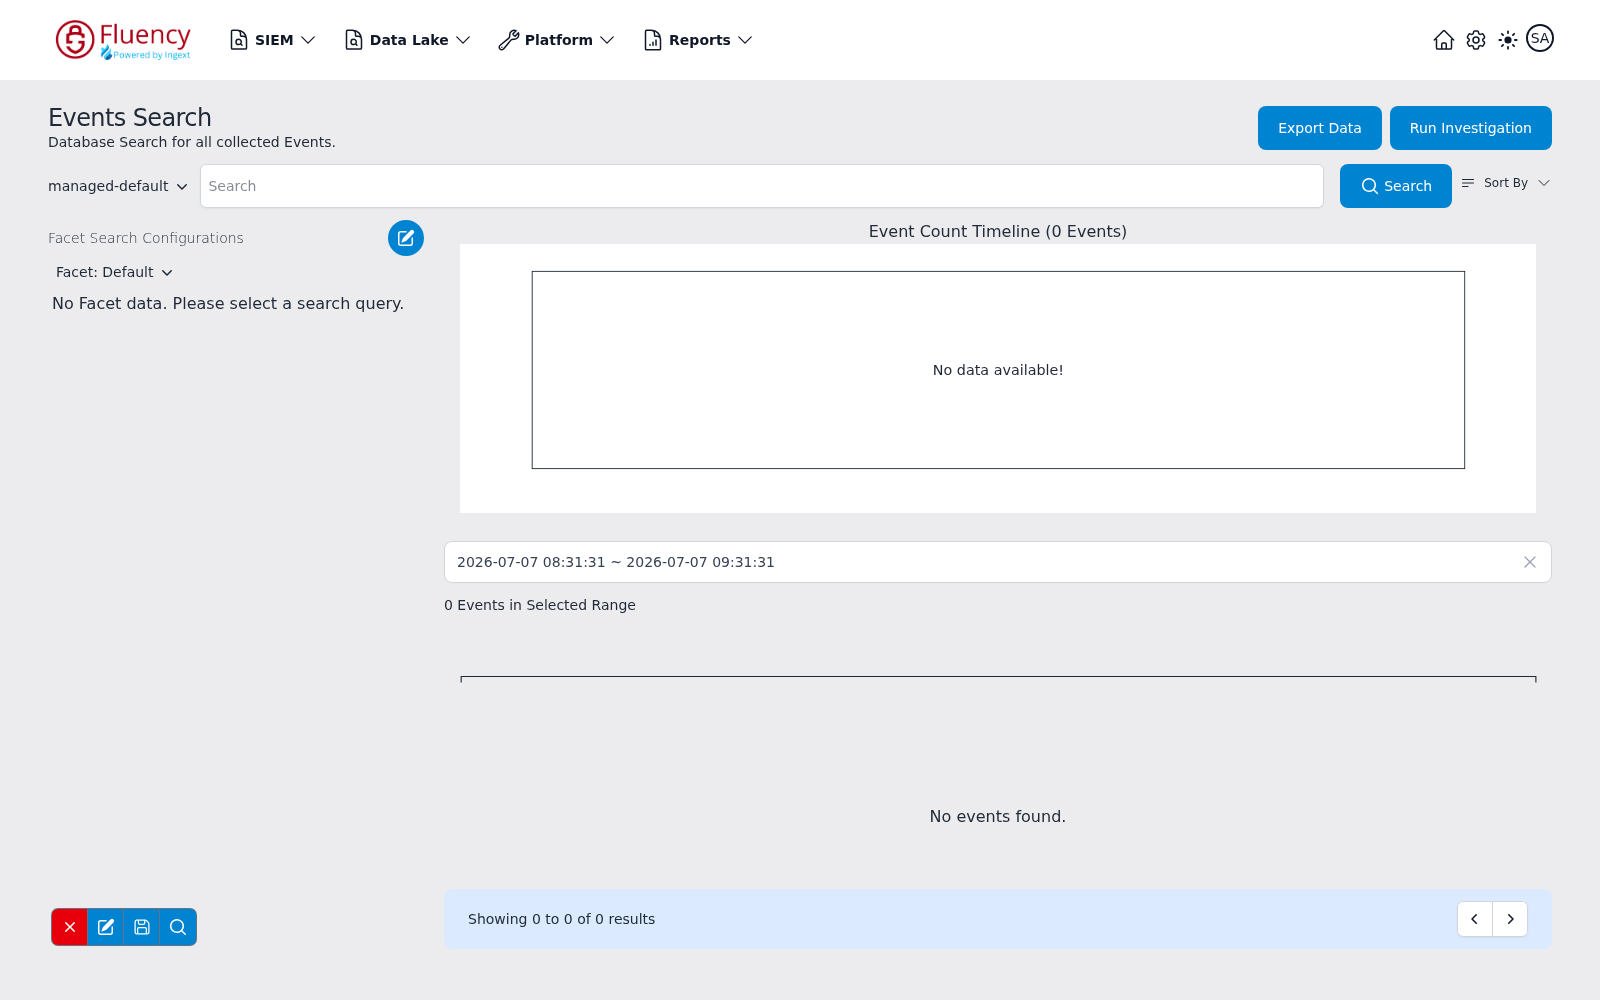
To get the initial syslogs of this bahavior model, you are going to pivot to the Events Search page (Data Lake → Search) using the magnifying glass by the behavior name. On the Events Search page, you'll see "@behaviors:"Bitdefender_Telemetry_UserLogOn" AND @bst.user_name:"Administrator"" are already filled in as the criterias of event search.
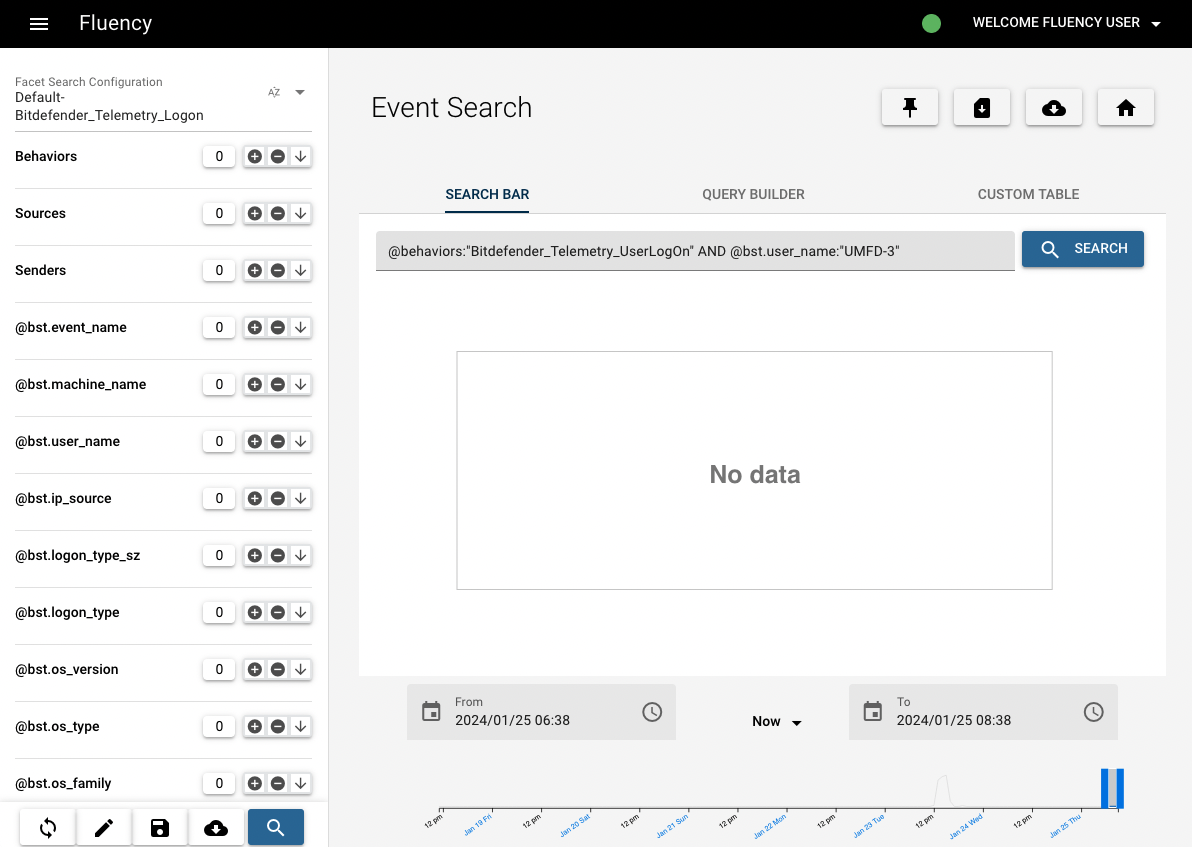
Click "search" botton to see the results.
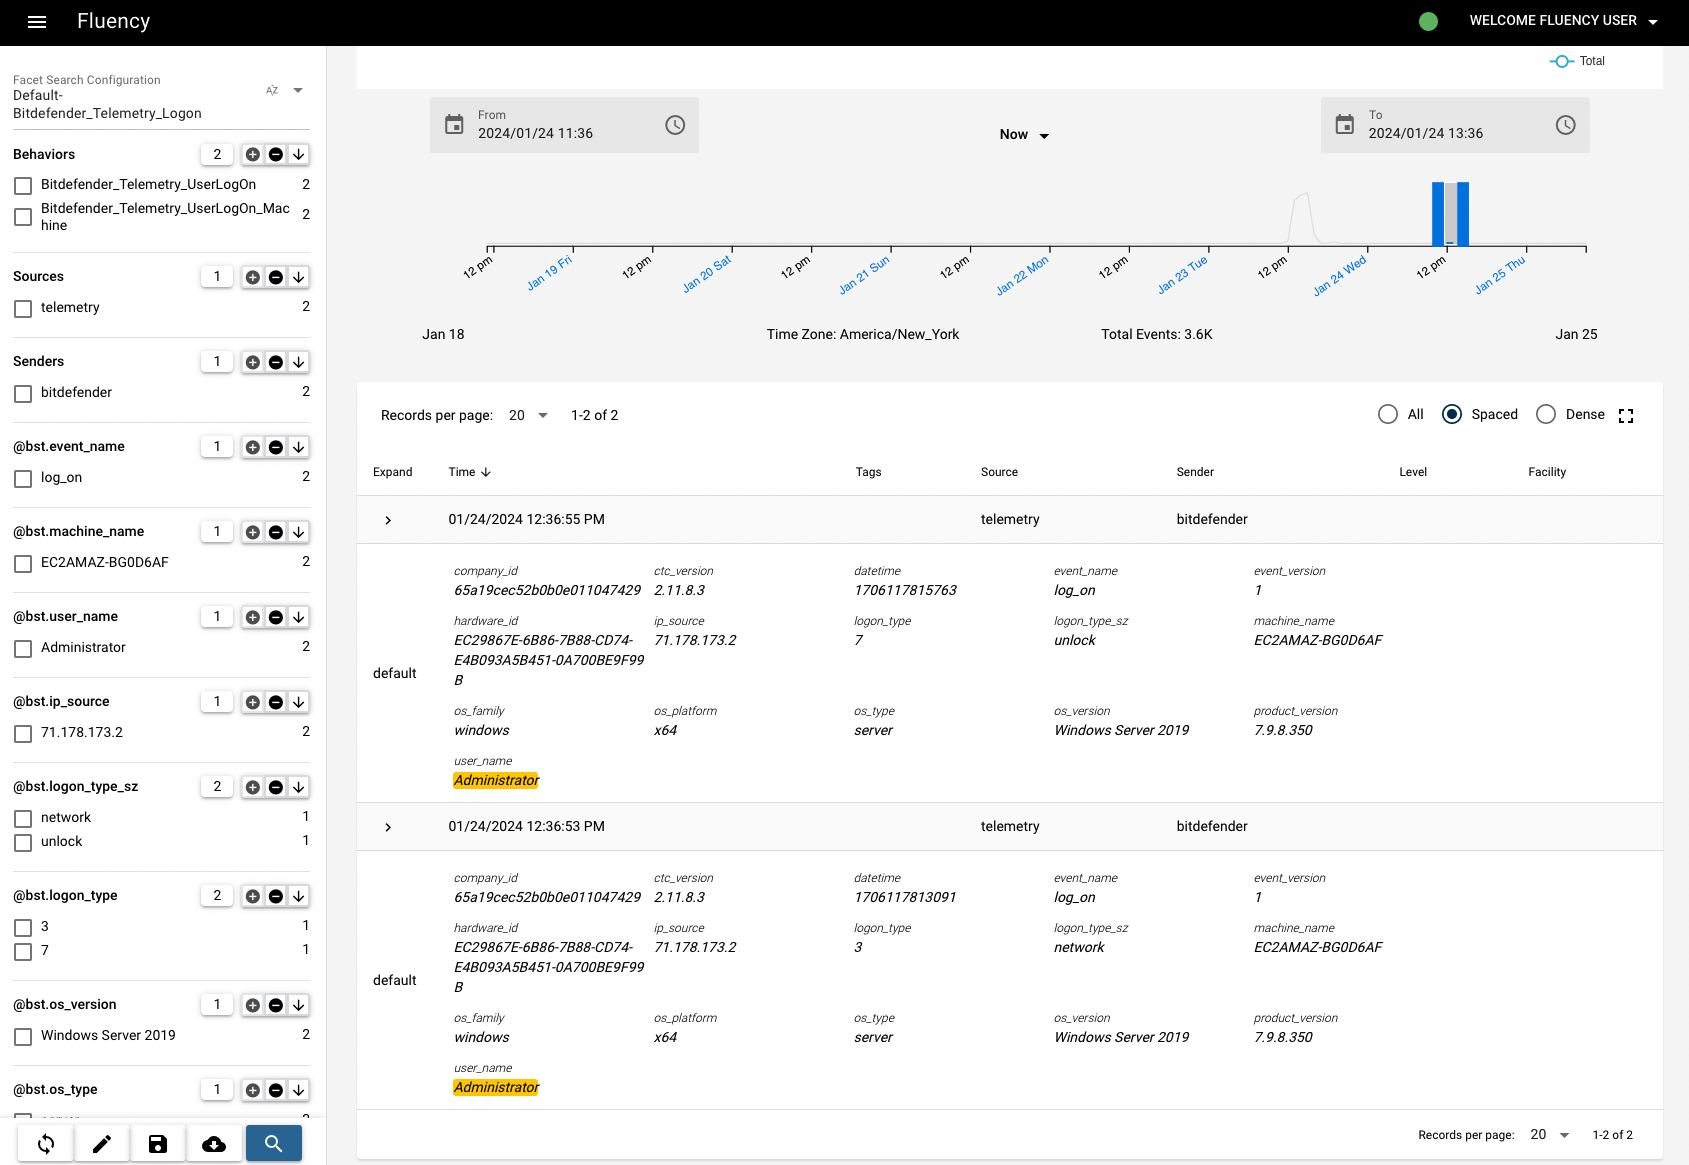
In the current interface the Events Search page carries an index selector to the left of the query field, an Export Data and a Run Investigation button in the header, a facet panel down the left, and an event count timeline above the results:
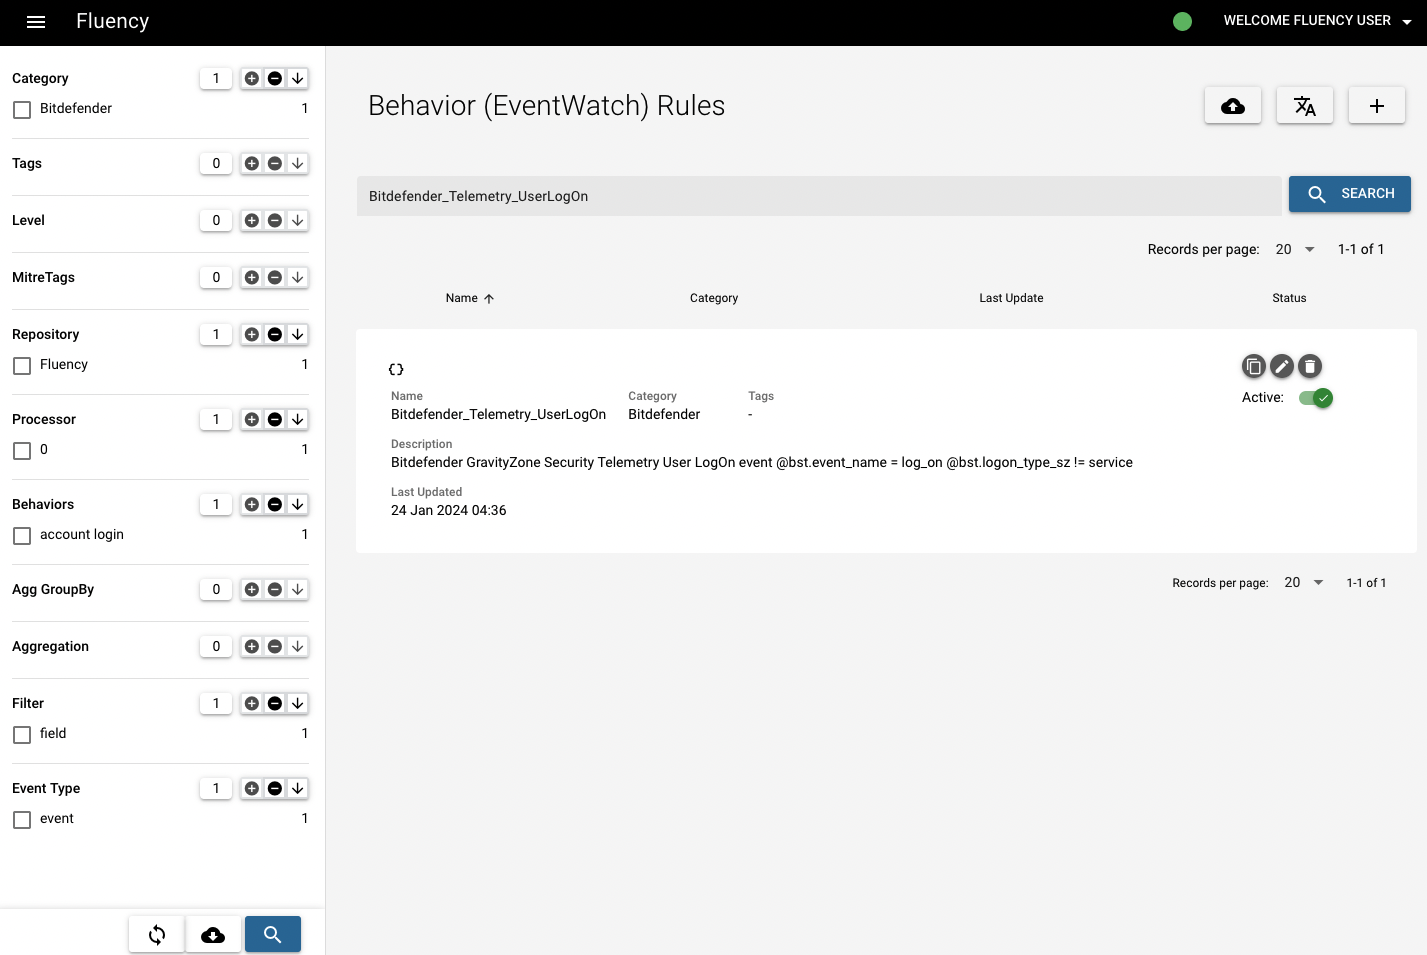
Before investigating the syslog, go to the Behavior Rules page under SIEM and search for the specific behavior ("Bitdefender_Telemetry_UserLogOn", in this case) to see what it refers to.
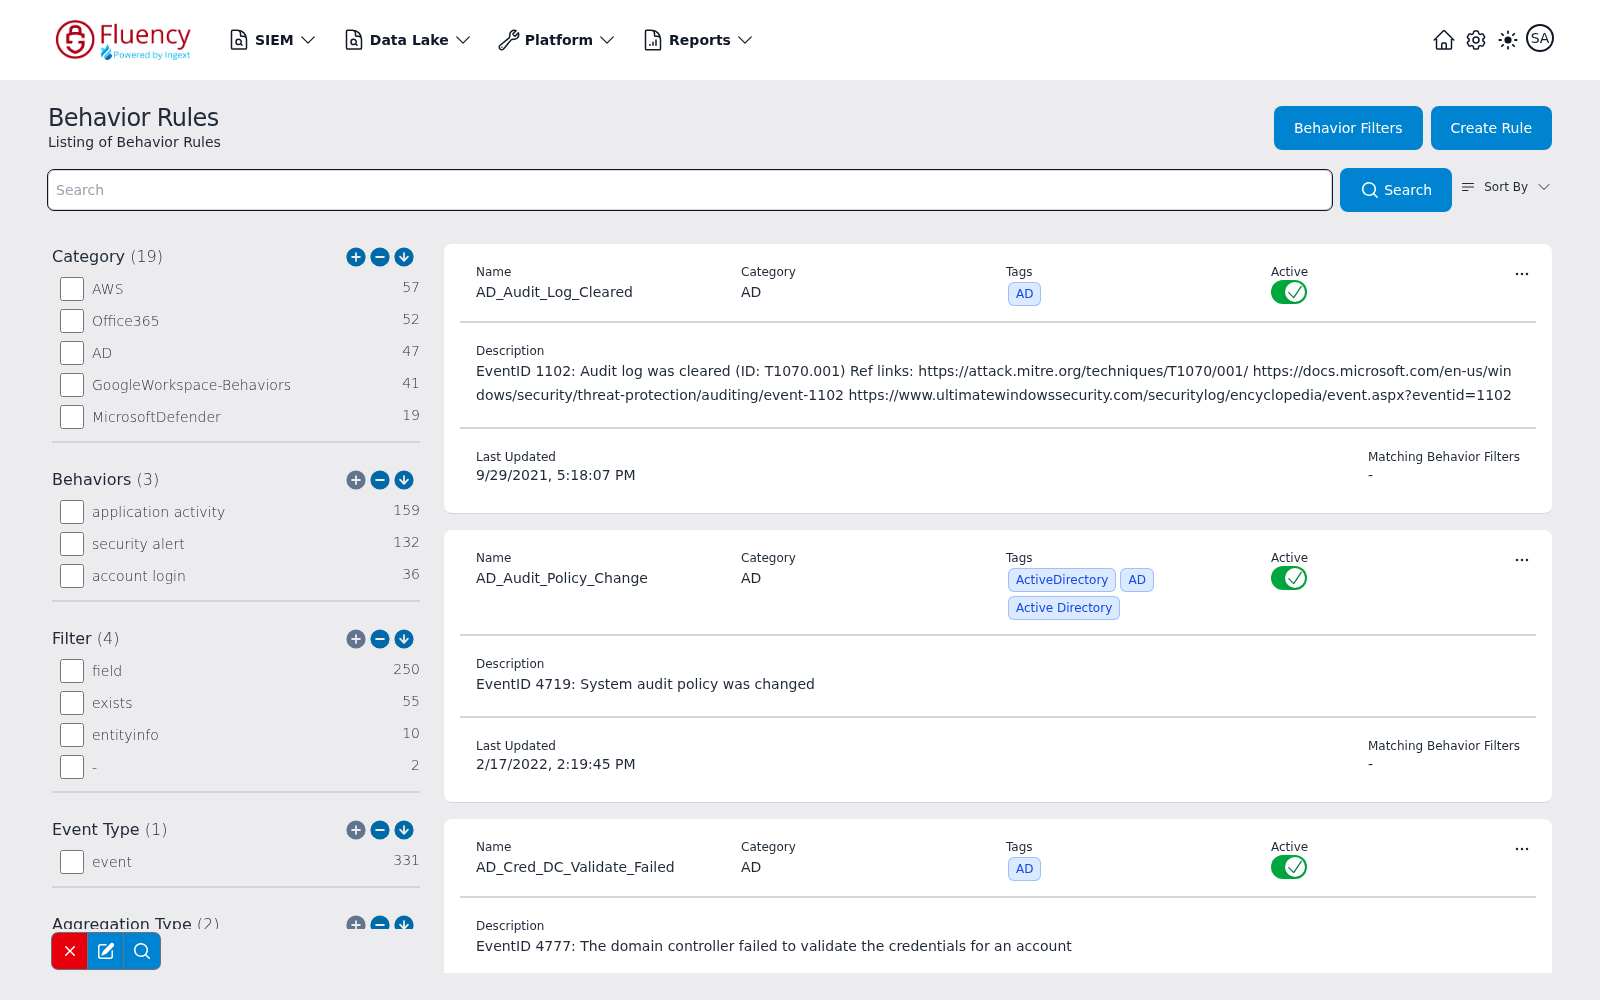
In the current interface each rule is a card carrying its Name, Category, Tags, an Active toggle, and a three-dot (...) actions menu:
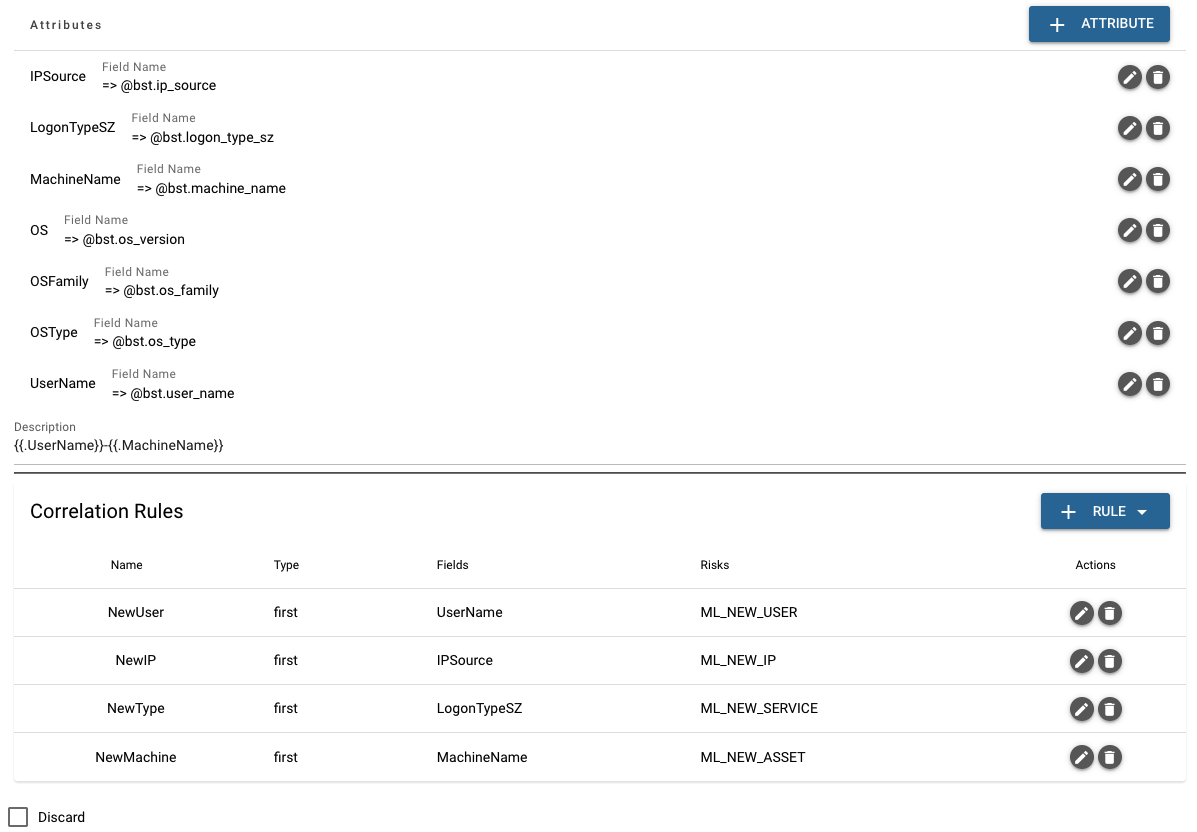
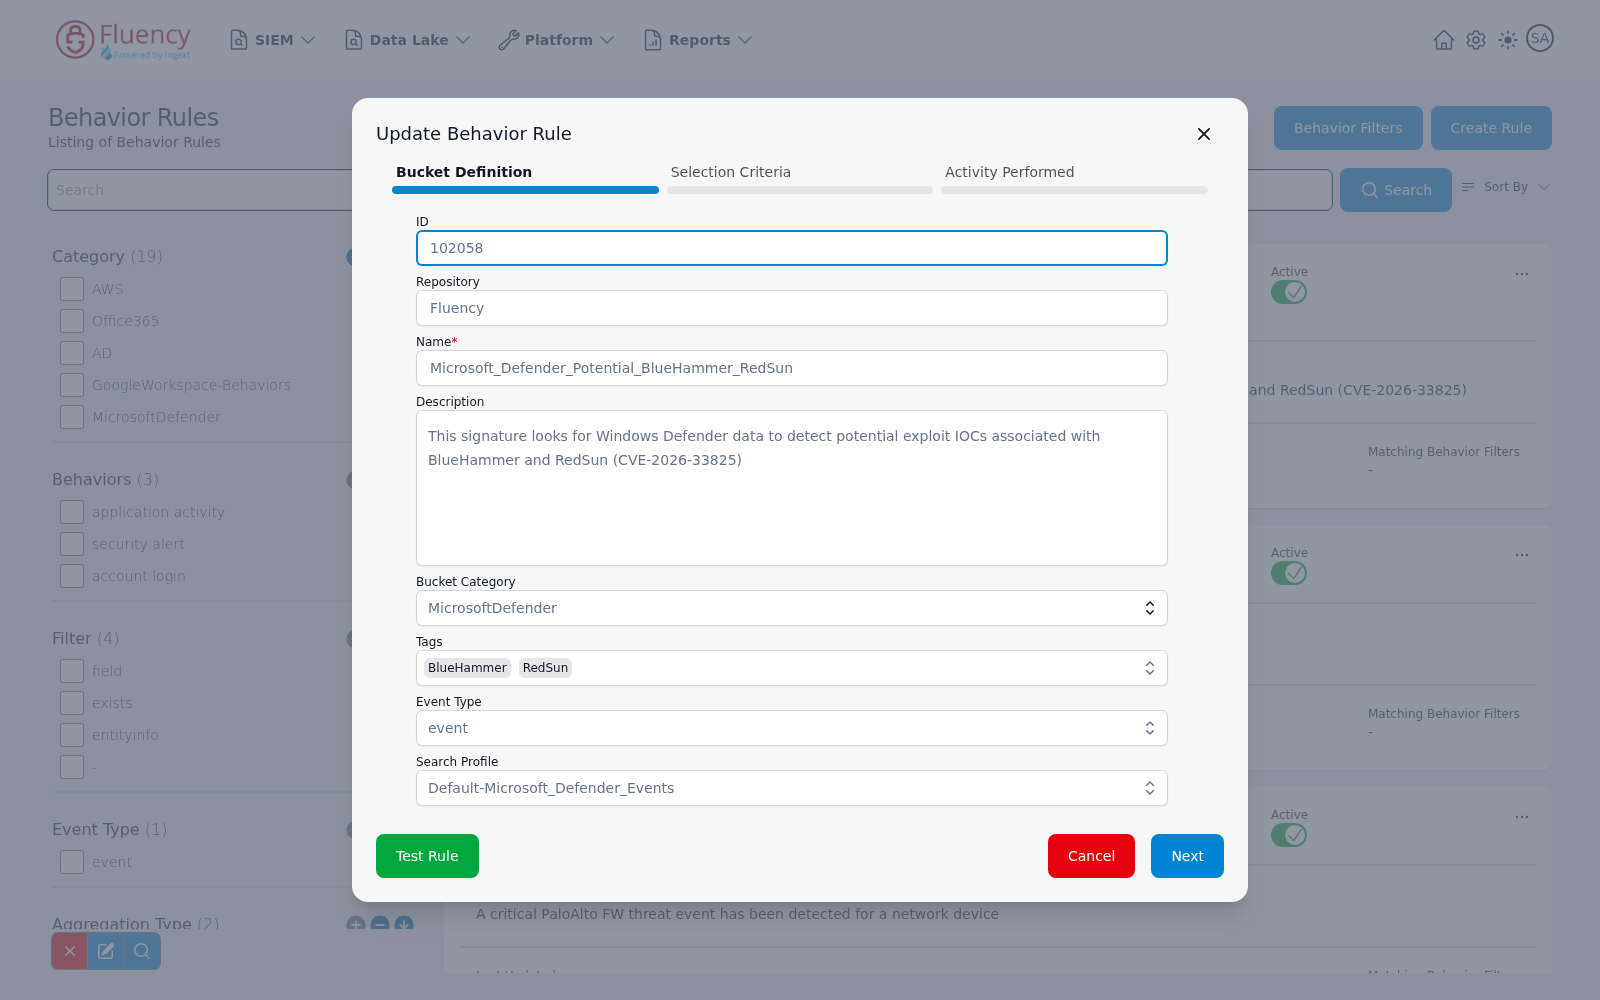
Click the pencil icon and continue to the third step "Activity Performed" (see Creating a Behavior Rule), then you can see this rule aims to give alerts for new logon, including the information of new user, IP, type and machine.
In the current interface the equivalent is the card's ... menu → View, which opens the Update Behavior Rule dialog — the same three-step wizard as Create Rule (Bucket Definition, Selection Criteria, Activity Performed), pre-filled with the selected rule.
Then go back to the previous Behavior Timeline page and check the new user/IP/type/machine, you can see the record that has high score represents a new user who is different from the regular record (lower), and that's why this event triggered the alert.