Behavior Summary
The screenshots and several interactions on this page — the "triggered events" expansion with its Correlation Hits and Fields tabs, the Status drop-down, and the magnifying-glass pivot to Behavior Timeline — are from an older version of the interface and are not covered by the current SIEM → Behavior Summary reference. On the current page each summary appears as a card (entity, Day Index, Status, Score, Classification) with a View JSON row menu. The interactions below need to be re-verified against the current product.
Sign in to your Fluency portal at https://<companyname>.app.ingext.io — see Fluency Web Interface for the URL formats.
Choose the Behavior Summary option under the SIEM menu in the navigation bar.
The Behavior Summary page shows a detailed view of behavior alerts. The on-page heading reads Behavior Summary Search, with the subtitle Search for behavior summaries over a date range (/SIEM/behaviorSummarySearch).
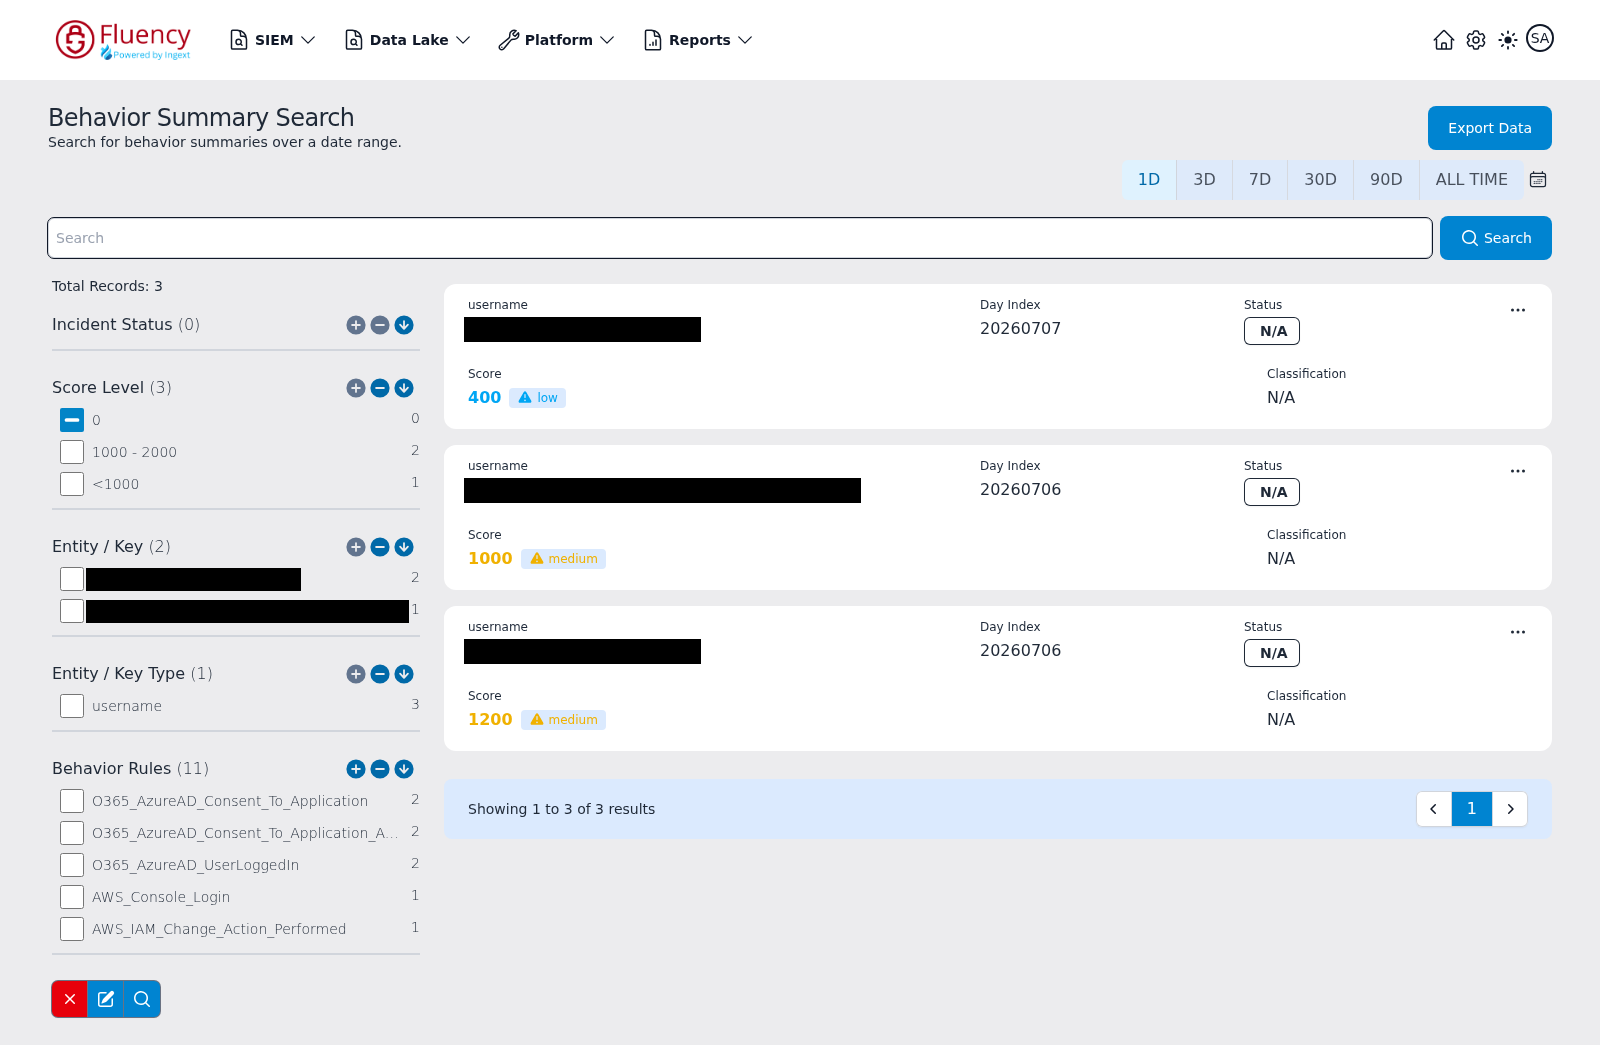
The header row carries the page title on the left and an Export Data button on the right, with the time-range selector beneath it: 1D (selected by default), 3D, 7D, 30D, 90D, and ALL TIME, plus a calendar icon for a Custom date range. Below that is a full-width Search field with a Search button; searches are combined with the selected time range and any facet selections.
The facet on the left side can be used to filter events. There are eight fields associated with a behavior model that can be used for search filters: incident status, analyst, score level, key, key type, behavior rule, behavior, and risks. The sidebar starts with a Total Records count, and each facet shows its title, the number of distinct values in parentheses, and a checkbox per value with the matching record count on the right. A checkbox in the minus state excludes the value — by default the 0 score bucket is excluded, so zero-score summaries stay hidden. The Facet Section covers the sidebar and its toolbar in detail.
Each behavior summary appears as a card showing the entity it covers (username — an email address or an AWS ARN), the Day Index the summary belongs to in YYYYMMDD form, the ticket Status badge (N/A when no status is set), the Score as a numeric behavior score with a severity chip such as medium, and the Classification (N/A when unset). A paging bar below the results reports the visible range.
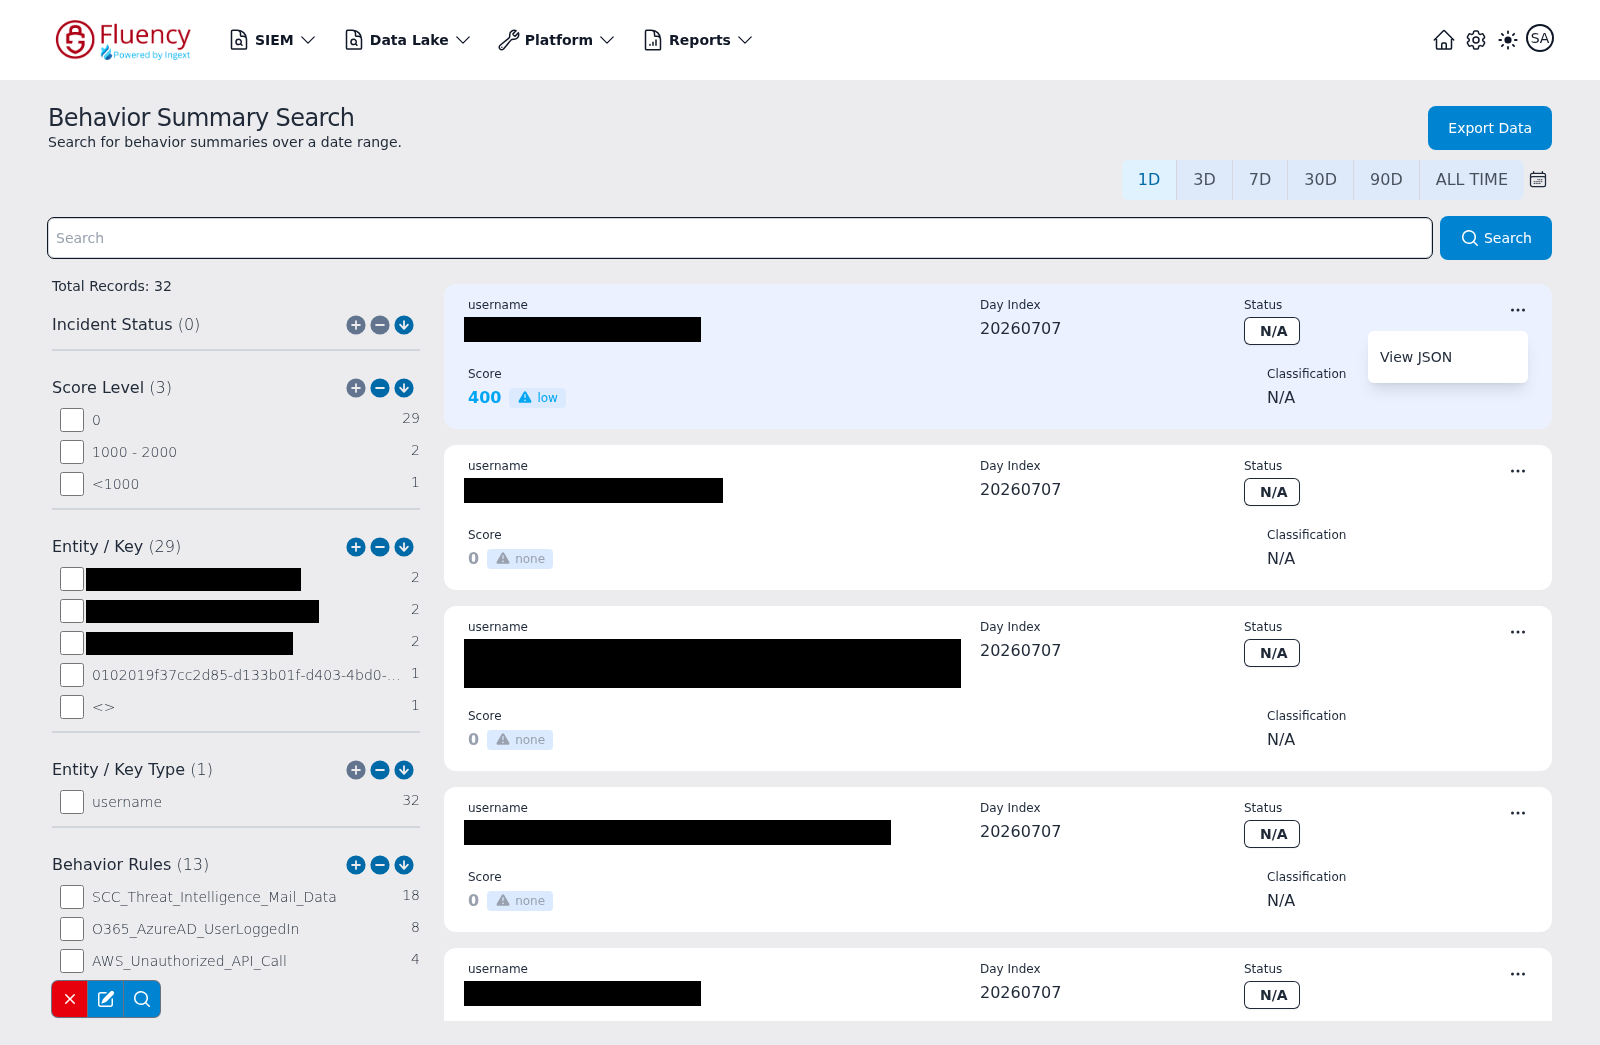
Each card has an ellipsis (...) button in its upper-right corner, whose menu holds one option, View JSON.
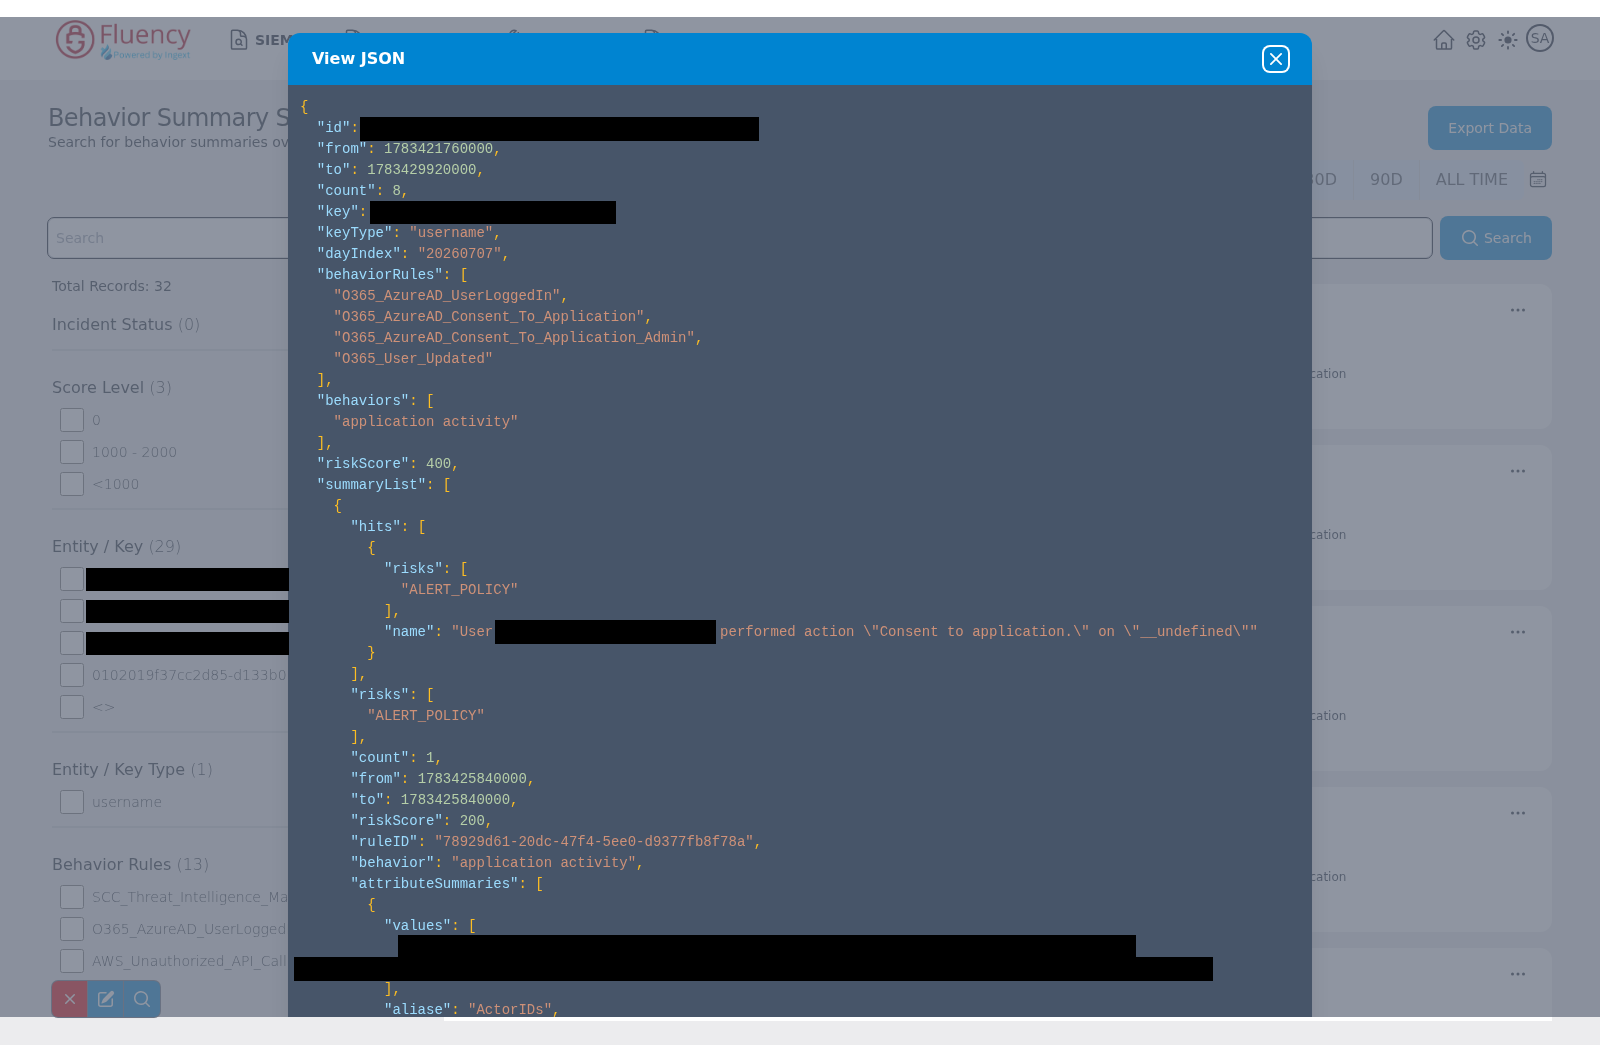
View JSON opens a dialog of the same name showing the full behavior summary record as color-coded JSON: identity and range fields such as id, from, to, count, key, keyType, and dayIndex; the behaviorRules and behaviors arrays; the overall riskScore; and a summaryList array that breaks the summary down per rule, each entry carrying its own hits, risks, count, riskScore, ruleID, behavior, and attributeSummaries. The X at the right end of the title bar closes the dialog.
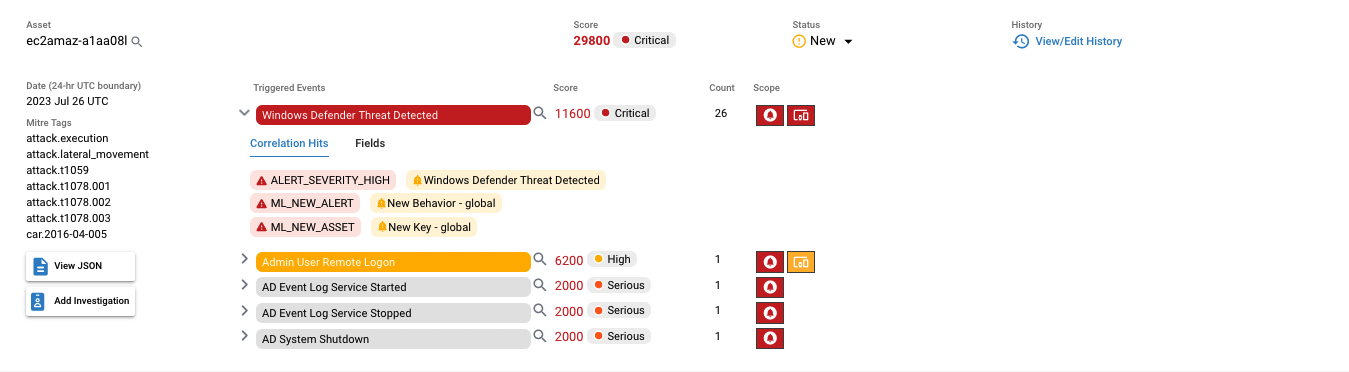
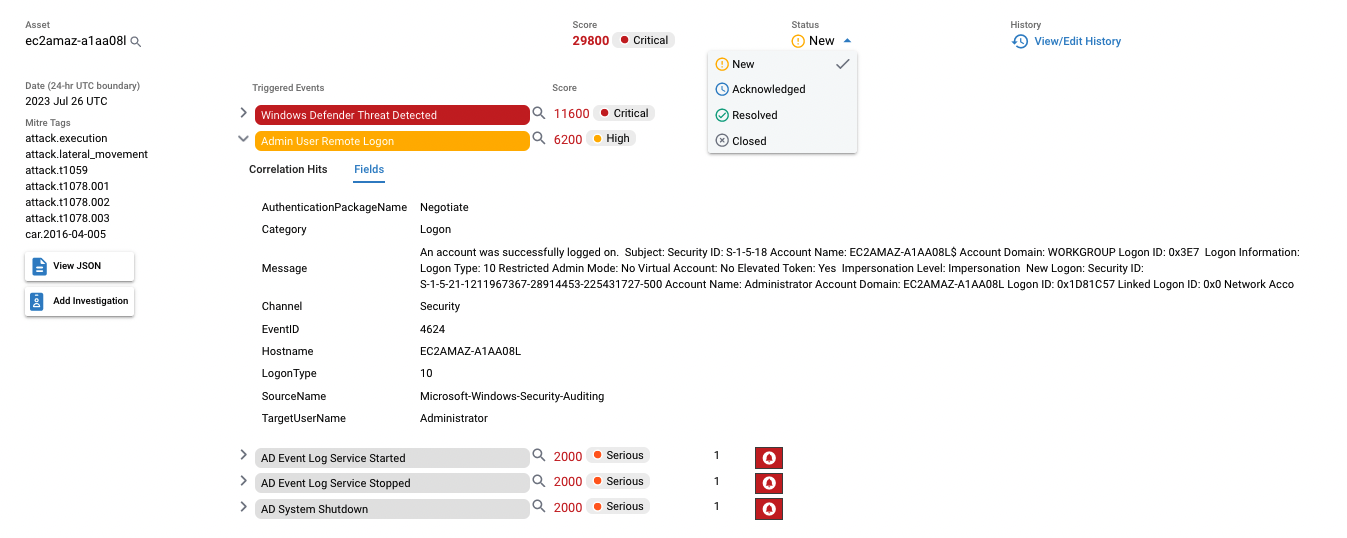
For each alert, you can see all the triggered events. To the right of that are the corresponding risk scores, in addition to the number of events that triggered them.
Clicking the arrow icon next to each "triggered events" displays two tabs: "Correlation Hits" and "Fields". The "Correlation Hits" tab shows risks that were triggered by the correlation rules associated with this alert, with a description of the field that triggered it corresponding to the alert.
The second tab is the "Fields" tab. This tab displays the attributes associated with the behavior model, in addition to their values alongside each field. Different triggered event has different information in this tab. Two examples are given below.
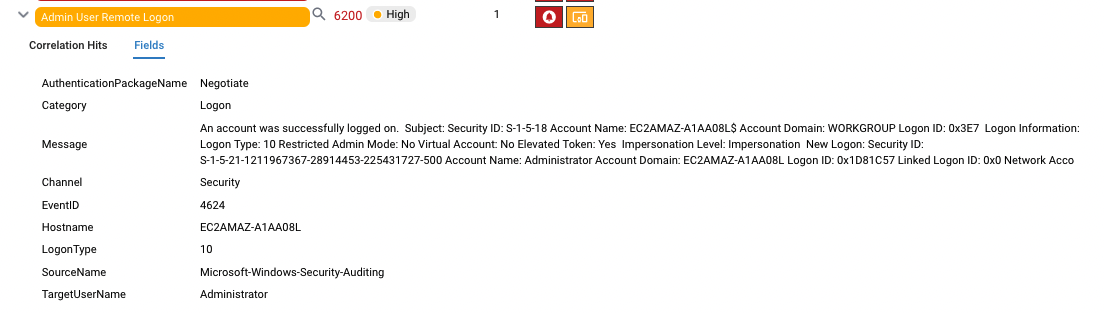
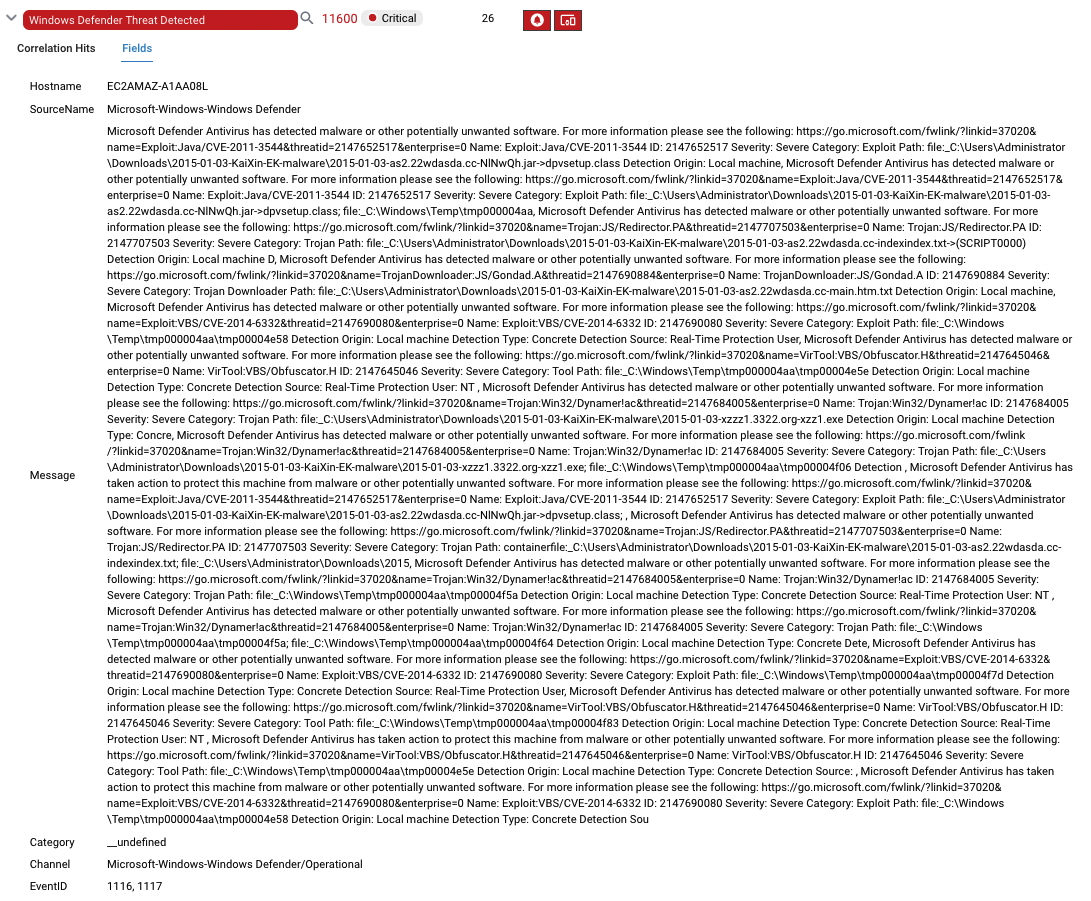
Clicking the "Status" drop-down menu allows the user to make changes to the current status of an alarm. By default, an alert will display with the N/A status. If the score associated with the alert passes a certain threshold (set by the customer), it will appear as "New."
Clicking the magnifying glass icon next to the key field will redirect you to the Behavior Timeline page and display all the events associated with the behavior alert triggered. From there, you can navigate to the events page and view more information on the events. More information on how to do this can be found on the page of Behavior Timeline.