Behavior Summary
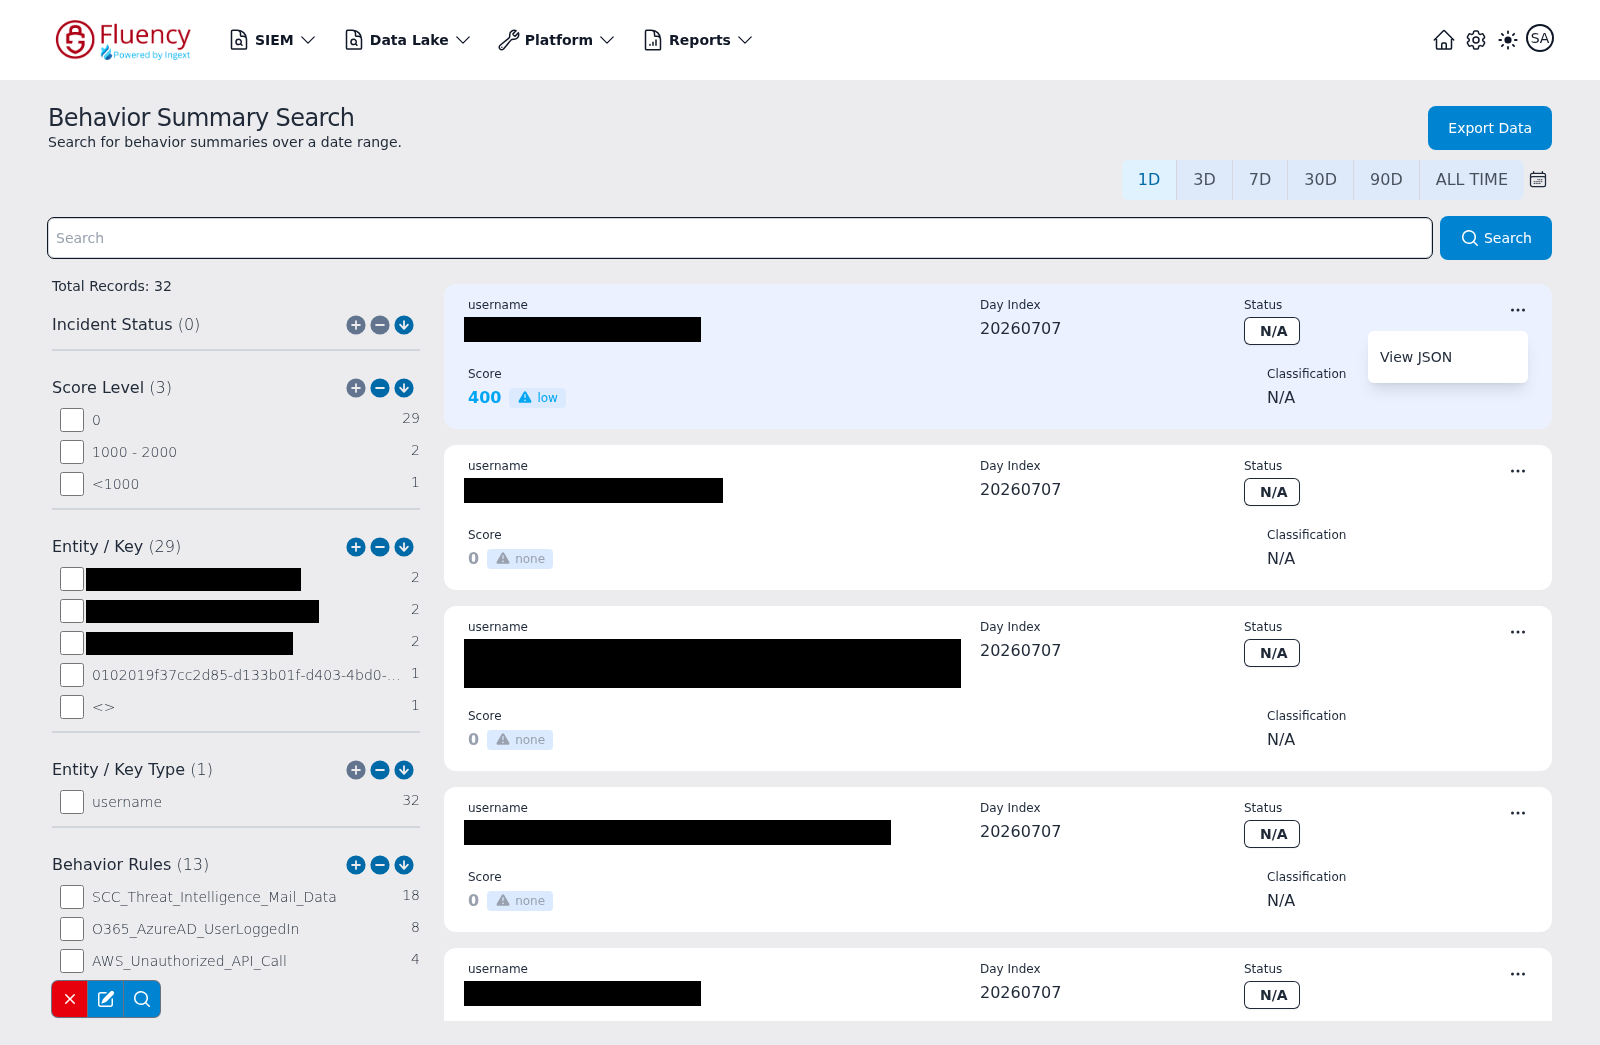
The Behavior Summary page searches the behavior summaries built for each entity over a date range. The on-page heading reads Behavior Summary Search, with the subtitle Search for behavior summaries over a date range.
Menu path: SIEM → Behavior Summary · URL path: /SIEM/behaviorSummarySearch
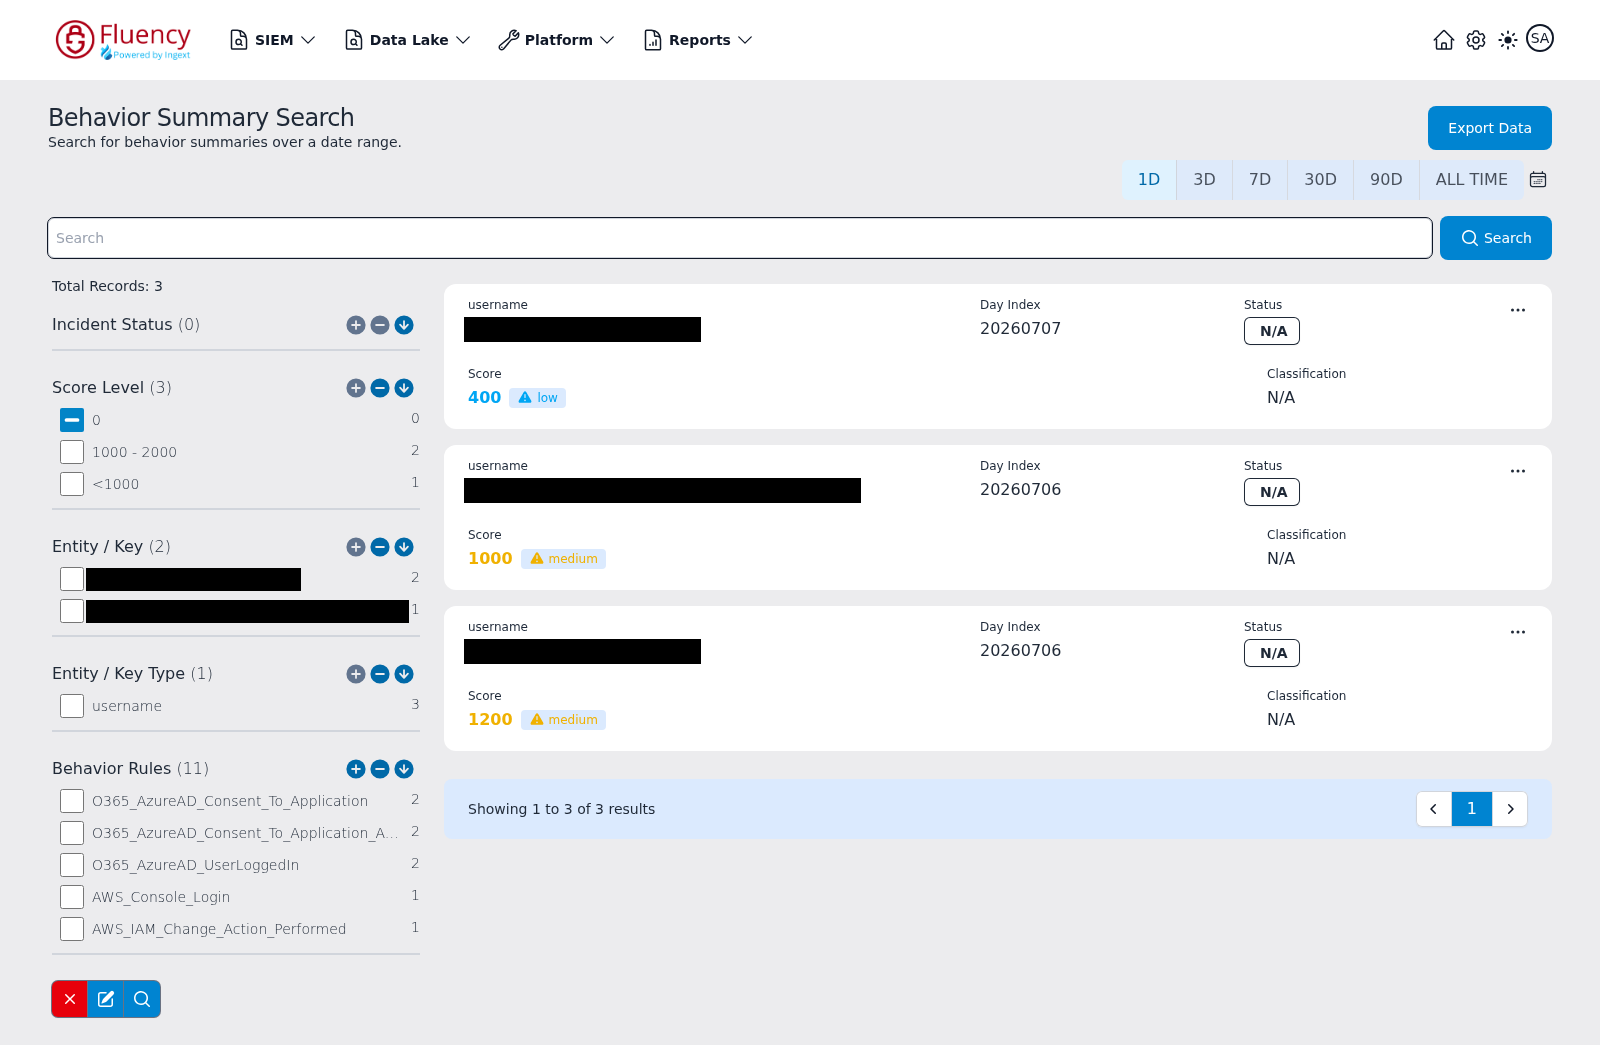
Page Layout
From top to bottom:
- A header row with the page title on the left and the Export Data button on the right, with the time-range selector beneath it.
- A full-width Search field with a Search button.
- A left sidebar showing Total Records and a stack of search facets, with a small facet toolbar at the bottom.
- The main results area on the right: one card per behavior summary, followed by a paging bar (for example Showing 1 to 3 of 3 results).
Header Actions
- Export Data — exports the current result set.
- 1D, 3D, 7D, 30D, 90D, ALL TIME — preset time ranges; 1D is selected by default.
- The calendar icon to the right of ALL TIME is the Custom date range control, used to search a specific date range instead of a preset.
Search Bar
Type a query into the Search field and click Search to run it. Searches are combined with the selected time range and any facet selections.
Facet Sidebar
The sidebar begins with a Total Records count for the current search, then lists the search facets. Each facet shows its title, the number of distinct values in parentheses, and a checkbox per value with the matching record count on the right; long value lists are truncated to the first few entries. The default facets are:
- Incident Status
- Score Level — score buckets such as 0 and 1000 - 2000.
- Entity / Key — the entities the summaries belong to (user names, AWS ARNs, and similar).
- Entity / Key Type — the kind of key, such as username.
- Behavior Rules — the behavior rules that contributed to each summary.
- Behaviors — the behavior categories observed.
Check a value to filter on it. A checkbox in the minus state marks the value as excluded — in the default view the 0 score bucket is excluded, so zero-score summaries stay hidden. Each facet heading also carries three small round icon buttons (a plus, a minus, and a downward arrow).
Facet Toolbar
A three-button toolbar sits at the bottom of the sidebar: a red X, a pencil icon, and a magnifier icon.
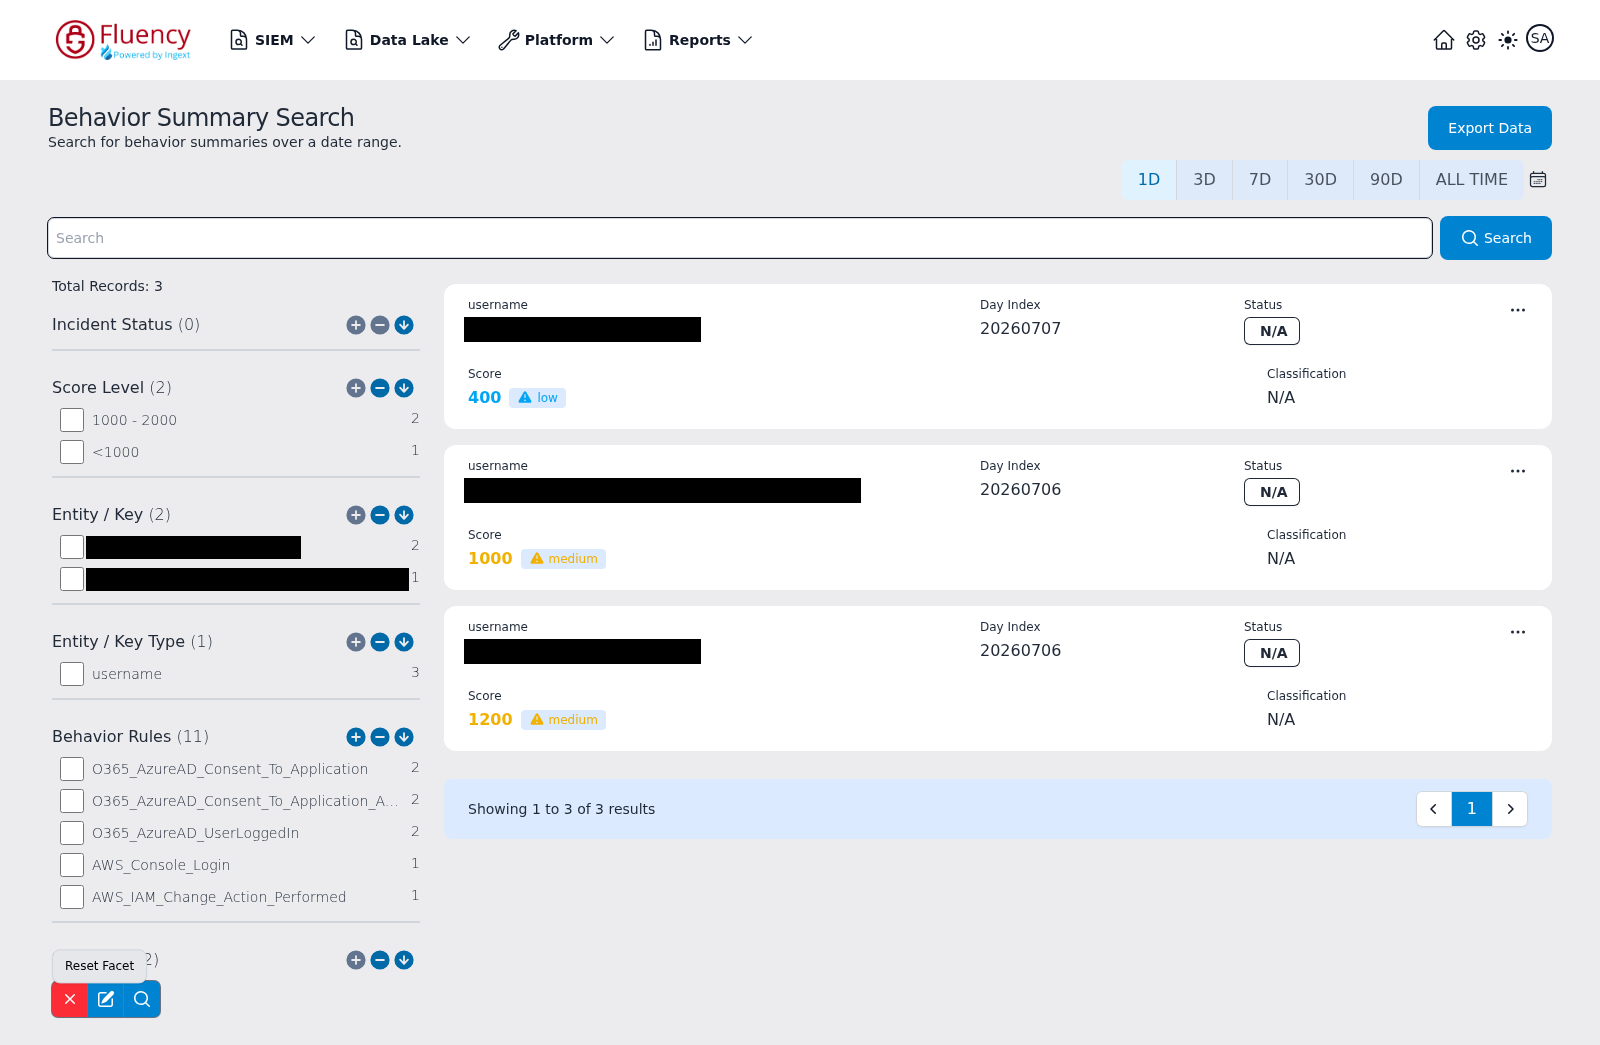
The red X button is Reset Facet. Clicking it clears the current facet selections — in the capture below, resetting removes the default exclusion of the 0 score bucket, and the Score Level facet returns to listing only the buckets present in the results:
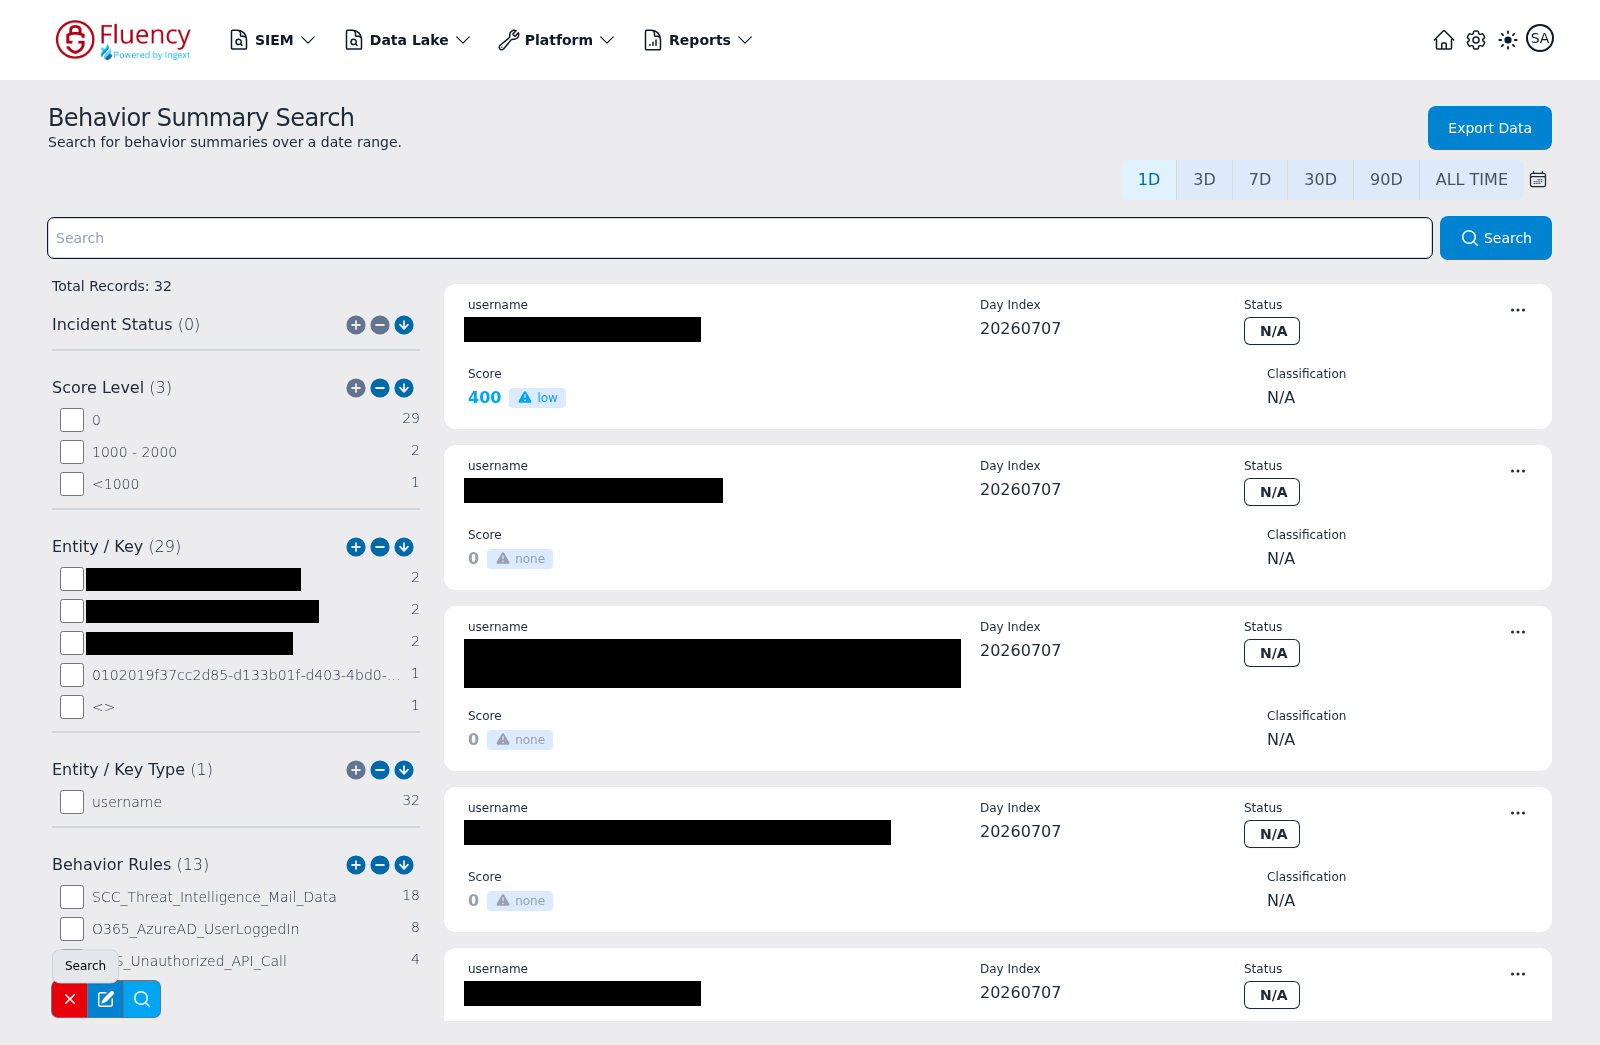
The magnifier button is Search. It re-runs the search with the current facet selections:
Search Facets Dialog
The pencil button opens the Search Facets dialog ("List of all event search facets."), where you edit which facets the sidebar shows:
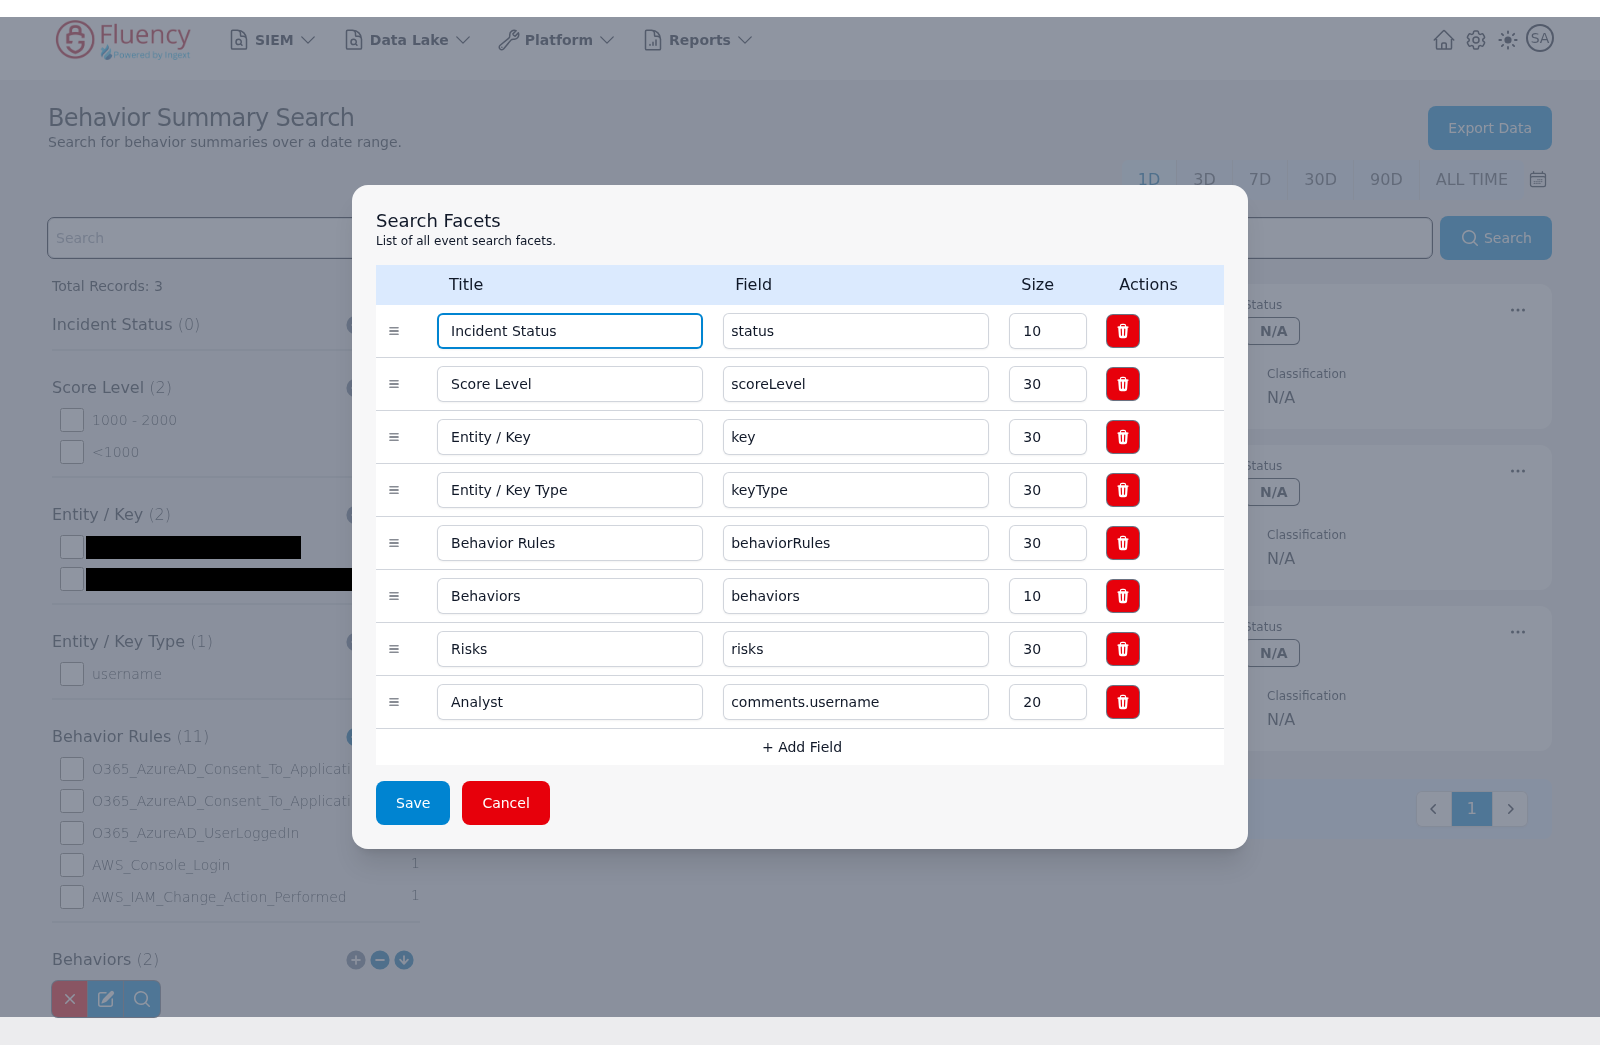
The dialog is a table with Title, Field, and Size columns plus an Actions column. The default rows are:
| Title | Field | Size |
|---|---|---|
| Incident Status | status | 10 |
| Score Level | scoreLevel | 30 |
| Entity / Key | key | 30 |
| Entity / Key Type | keyType | 30 |
| Behavior Rules | behaviorRules | 30 |
| Behaviors | behaviors | 10 |
| Risks | risks | 30 |
| Analyst | comments.username | 20 |
Each row has a drag handle on the left for reordering and a red trash button under Actions to remove the facet. All three cells are editable text fields. Click + Add Field to append a new facet row, then Save to apply the changes or Cancel to discard them.
Results
Each behavior summary appears as a card showing:
- username — the entity the summary covers (an email address or an AWS ARN in this capture).
- Day Index — the day the summary belongs to, in
YYYYMMDDform. - Status — the ticket status badge (N/A when no status is set).
- Score — the numeric behavior score with a severity chip (for example medium).
- Classification — the assigned classification (N/A when unset).
Row Menu
Each card has an ellipsis (...) button in its upper-right corner. Clicking it opens a menu with one option, View JSON:
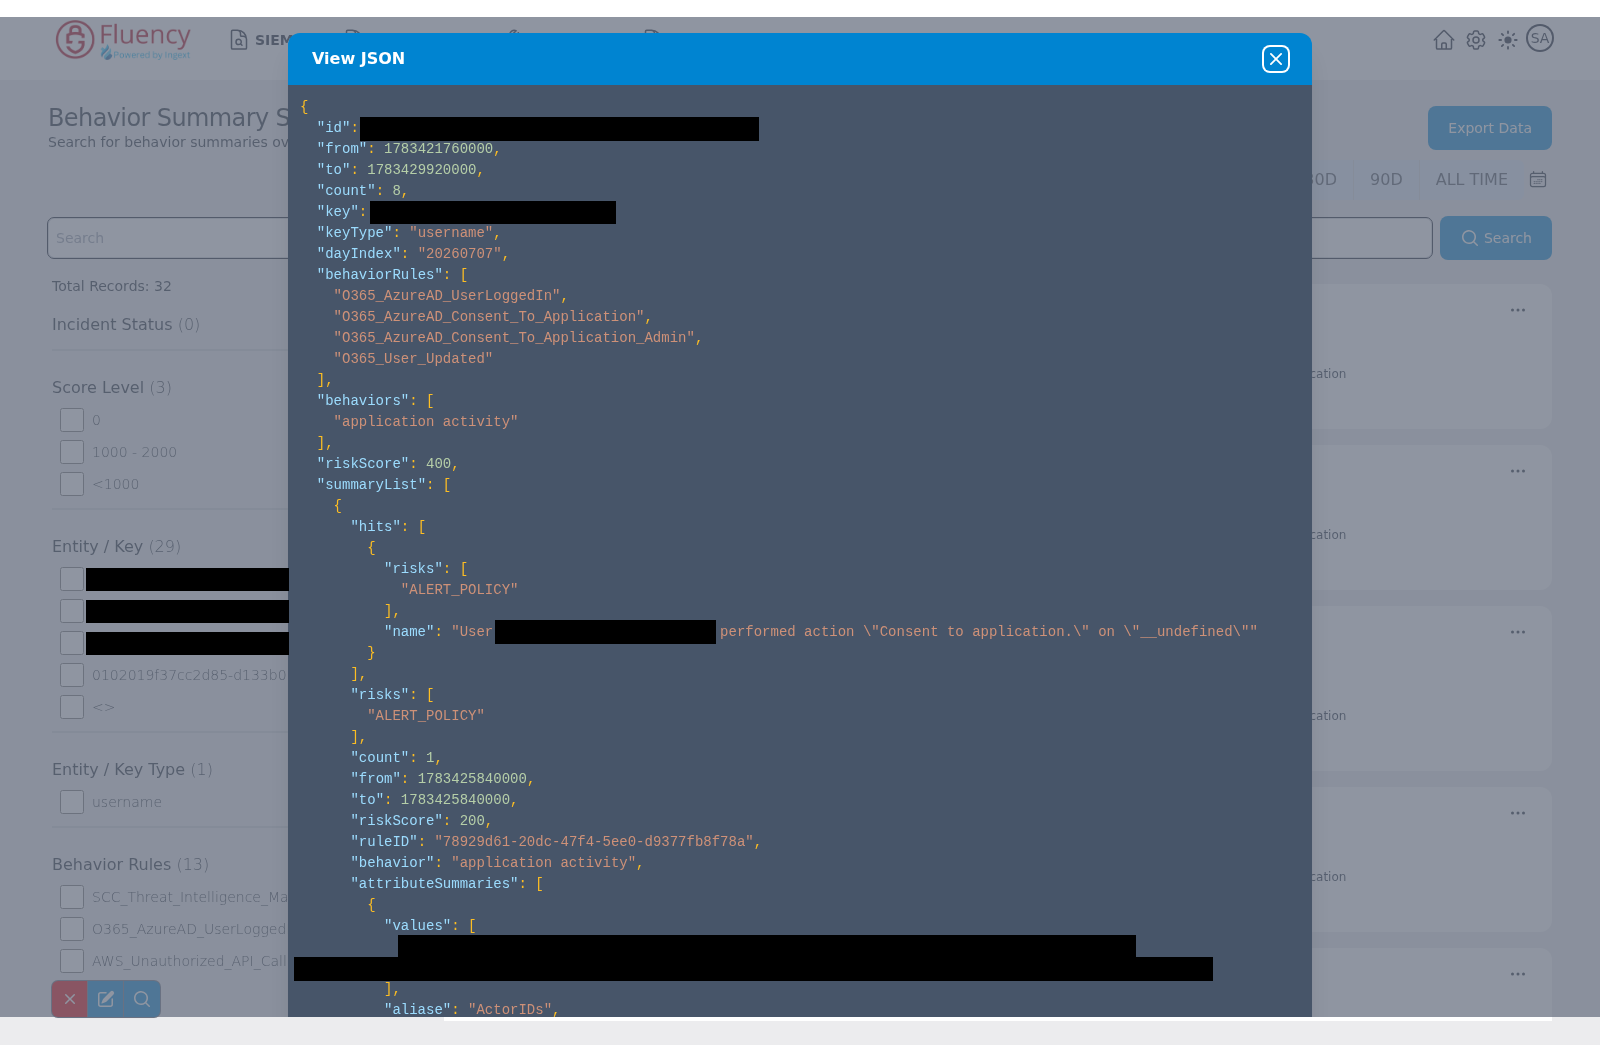
Choosing View JSON opens a dialog of the same name over the page, with a close (X) button at the right end of its title bar. The body shows the full behavior summary record as color-coded JSON: identity and range fields such as id, from, to, count, key, keyType, and dayIndex; the behaviorRules and behaviors arrays; the overall riskScore; and a summaryList array that breaks the summary down per rule, each entry with its own hits, risks, count, riskScore, ruleID, behavior, and attributeSummaries. Click the X button to close the dialog and return to the results.
Pagination
The bar below the results reports the visible range (Showing 1 to 3 of 3 results in this capture) and provides left and right arrows plus numbered page buttons for longer result sets.