Behavior Timeline
The Behavior Timeline page presents behavior events in chronological order. A risk-score chart plots the events over time, and each event can be expanded to show the alerts it raised and its attribute fields.
Menu path: SIEM → Behavior Timeline · URL path: /SIEM/behaviorTimeline
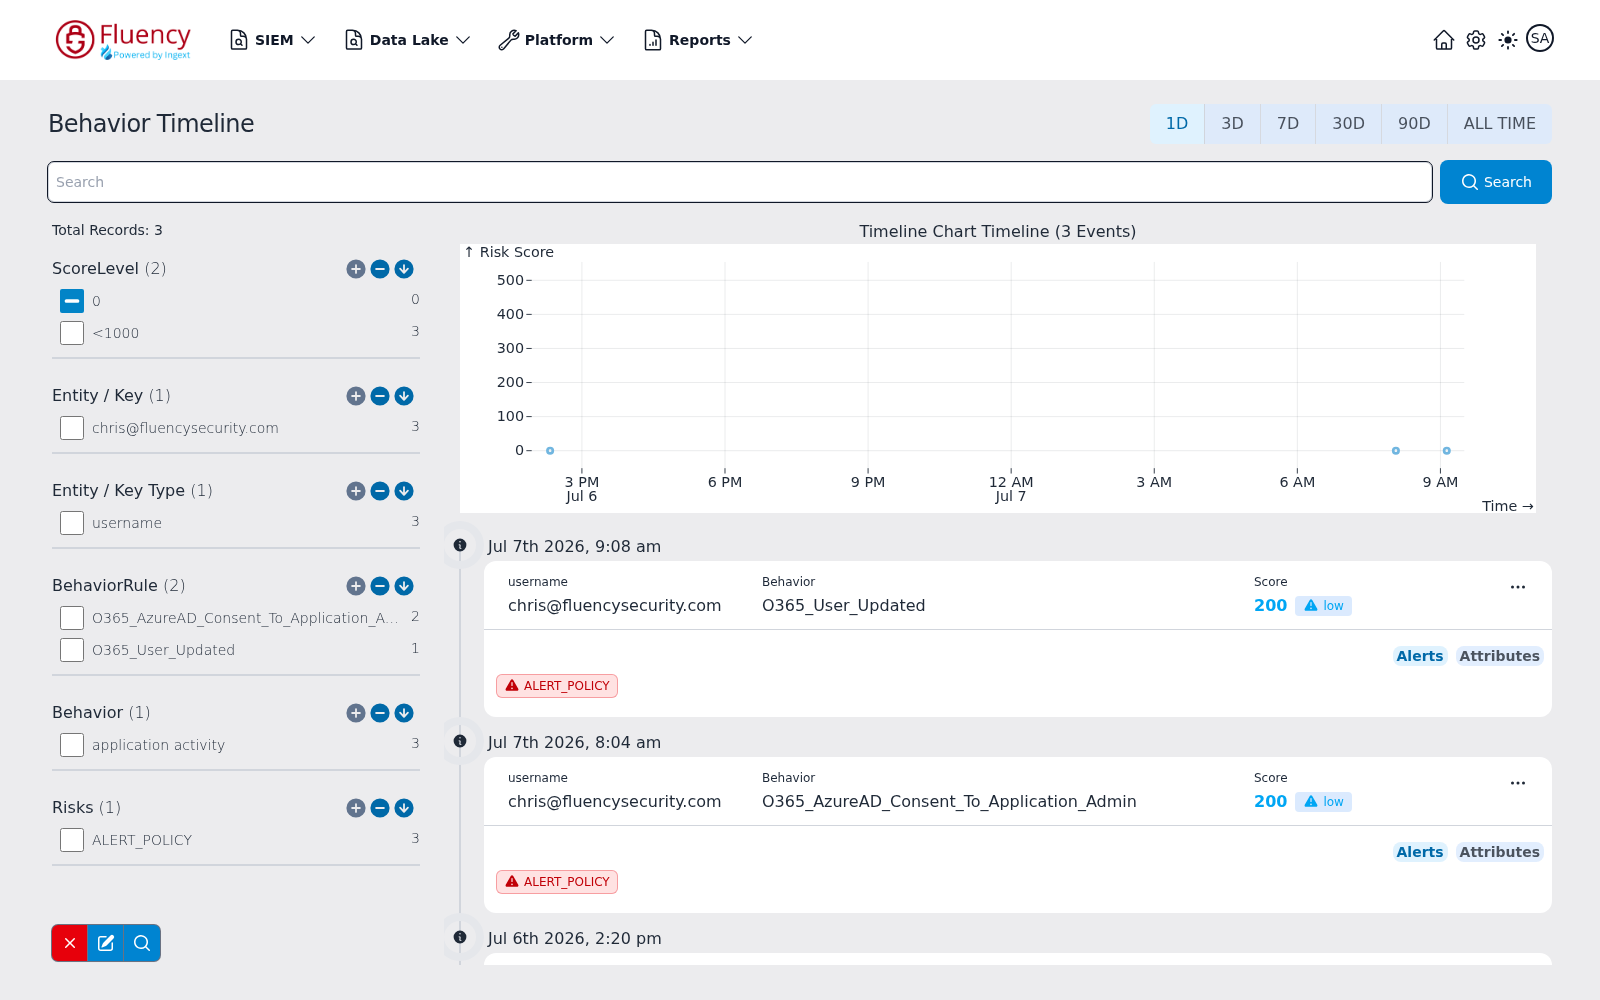
Page Layout
From top to bottom:
- A header row with the page title on the left and the time-range presets — 1D (default), 3D, 7D, 30D, 90D, ALL TIME — on the right.
- A full-width Search field with a Search button.
- A left sidebar showing Total Records and the search facets, with a small facet toolbar at the bottom.
- The main area on the right: the timeline chart at the top, then the timeline of event entries grouped by timestamp.
Search Bar
Type a query into the Search field and click Search to run it. Searches are combined with the selected time range and any facet selections.
Facet Sidebar
The sidebar begins with a Total Records count, then lists the facets. Each facet shows its title, the number of distinct values in parentheses, and a checkbox per value with the matching event count on the right. The default facets are:
- ScoreLevel — score buckets such as 0 and
<1000. - Entity / Key — the entities involved (user names, AWS ARNs, and similar).
- Entity / Key Type — the kind of key, such as username.
- BehaviorRule — the behavior rules the events matched.
- Behavior — the behavior categories observed (for example application activity).
- Risks — risk tags attached to the events.
Check a value to filter on it. A checkbox in the minus state marks the value as excluded — in the default view the 0 score bucket is excluded, so zero-score events stay hidden. Each facet heading also carries three small round icon buttons (a plus, a minus, and a downward arrow).
Facet Toolbar
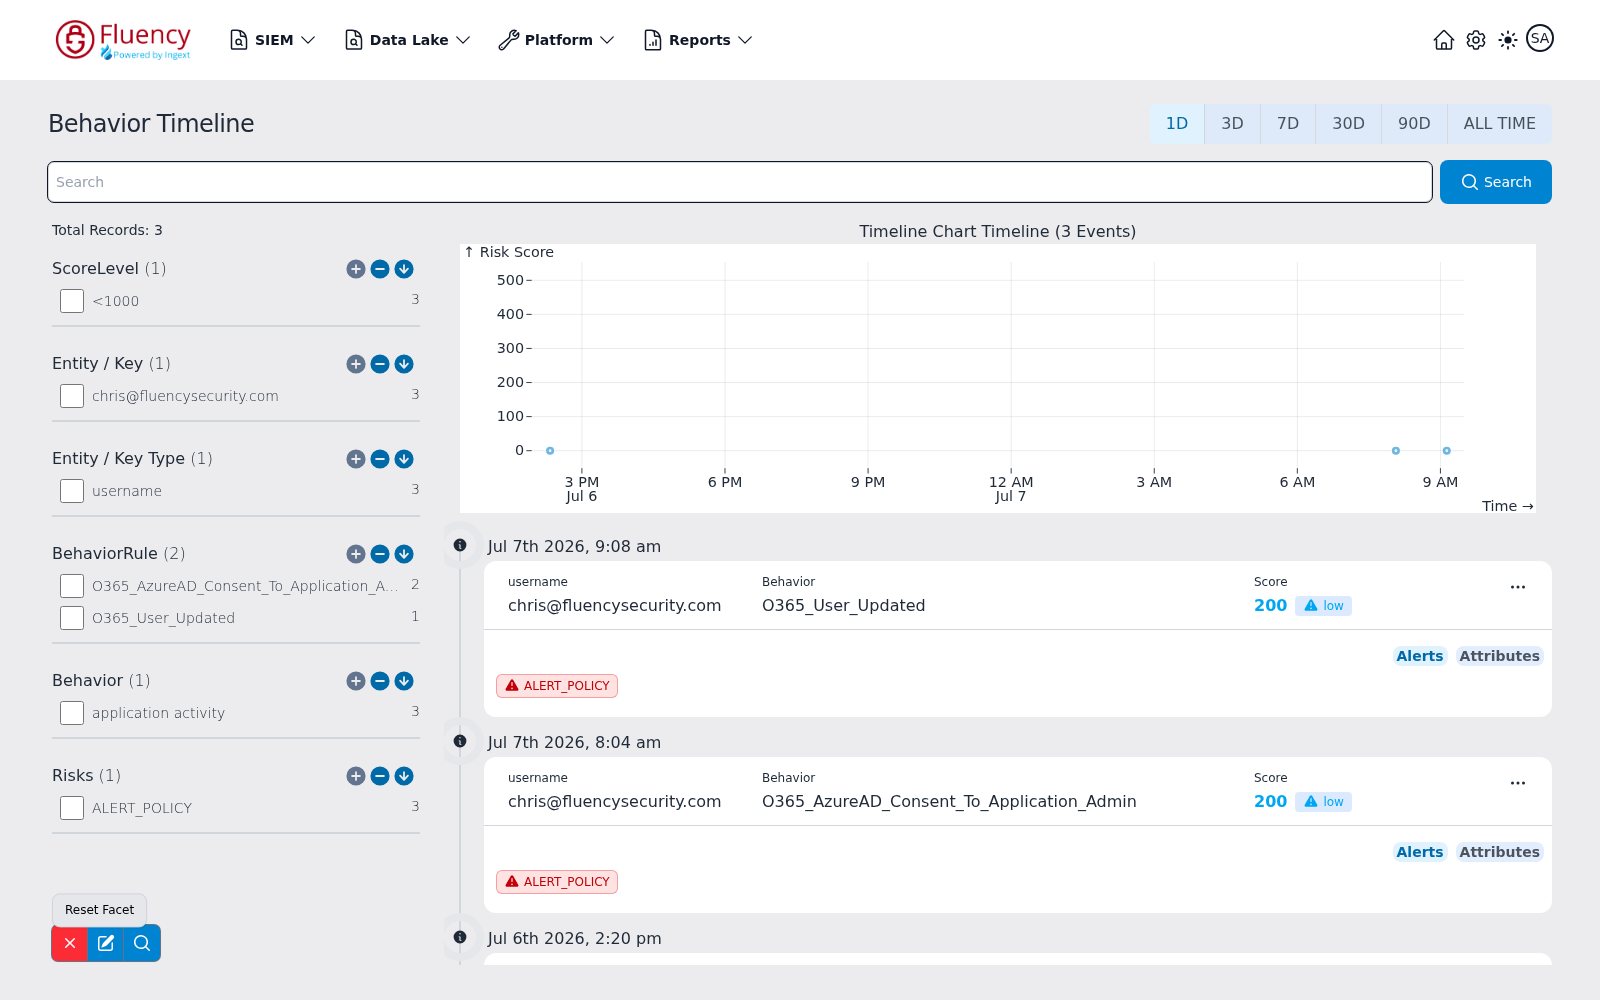
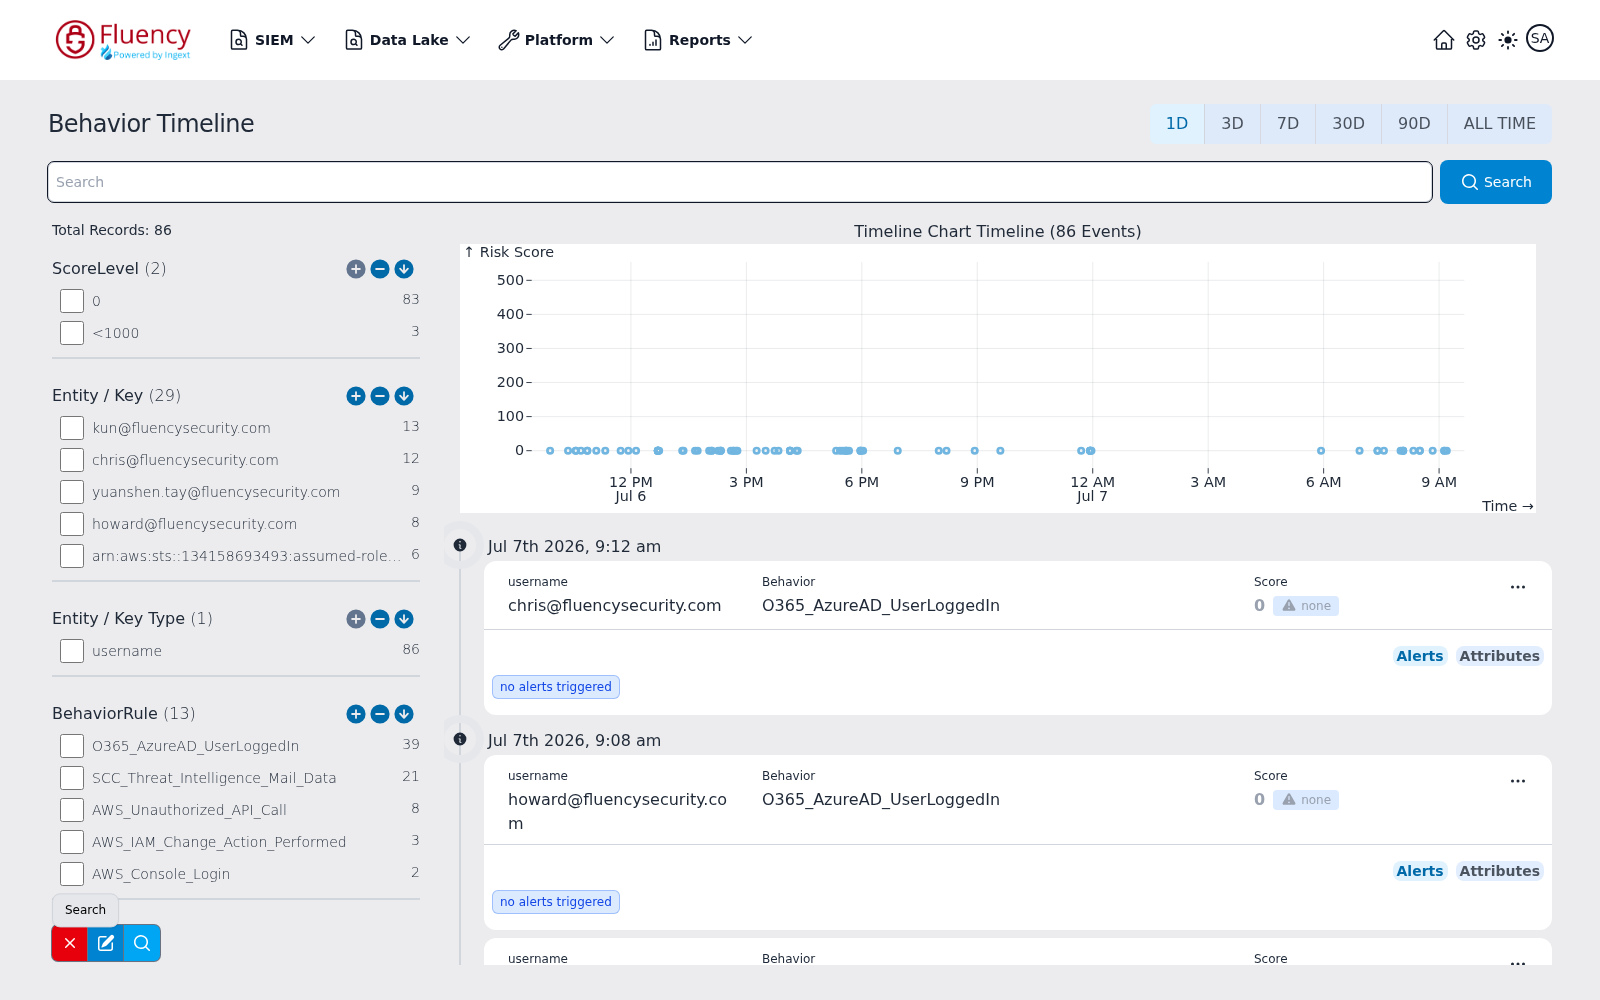
A three-button toolbar sits at the bottom of the sidebar: a red X, a pencil icon, and a magnifier icon.
The red X button is Reset Facet. Clicking it clears the current facet selections — in the capture below, resetting removes the default exclusion of the 0 score bucket, and the ScoreLevel facet returns to listing only the buckets present in the results:
The magnifier button is Search. It re-runs the search with the current facet selections:
Search Facets Dialog
The pencil button opens the Search Facets dialog ("List of all event search facets."), where you edit which facets the sidebar shows:
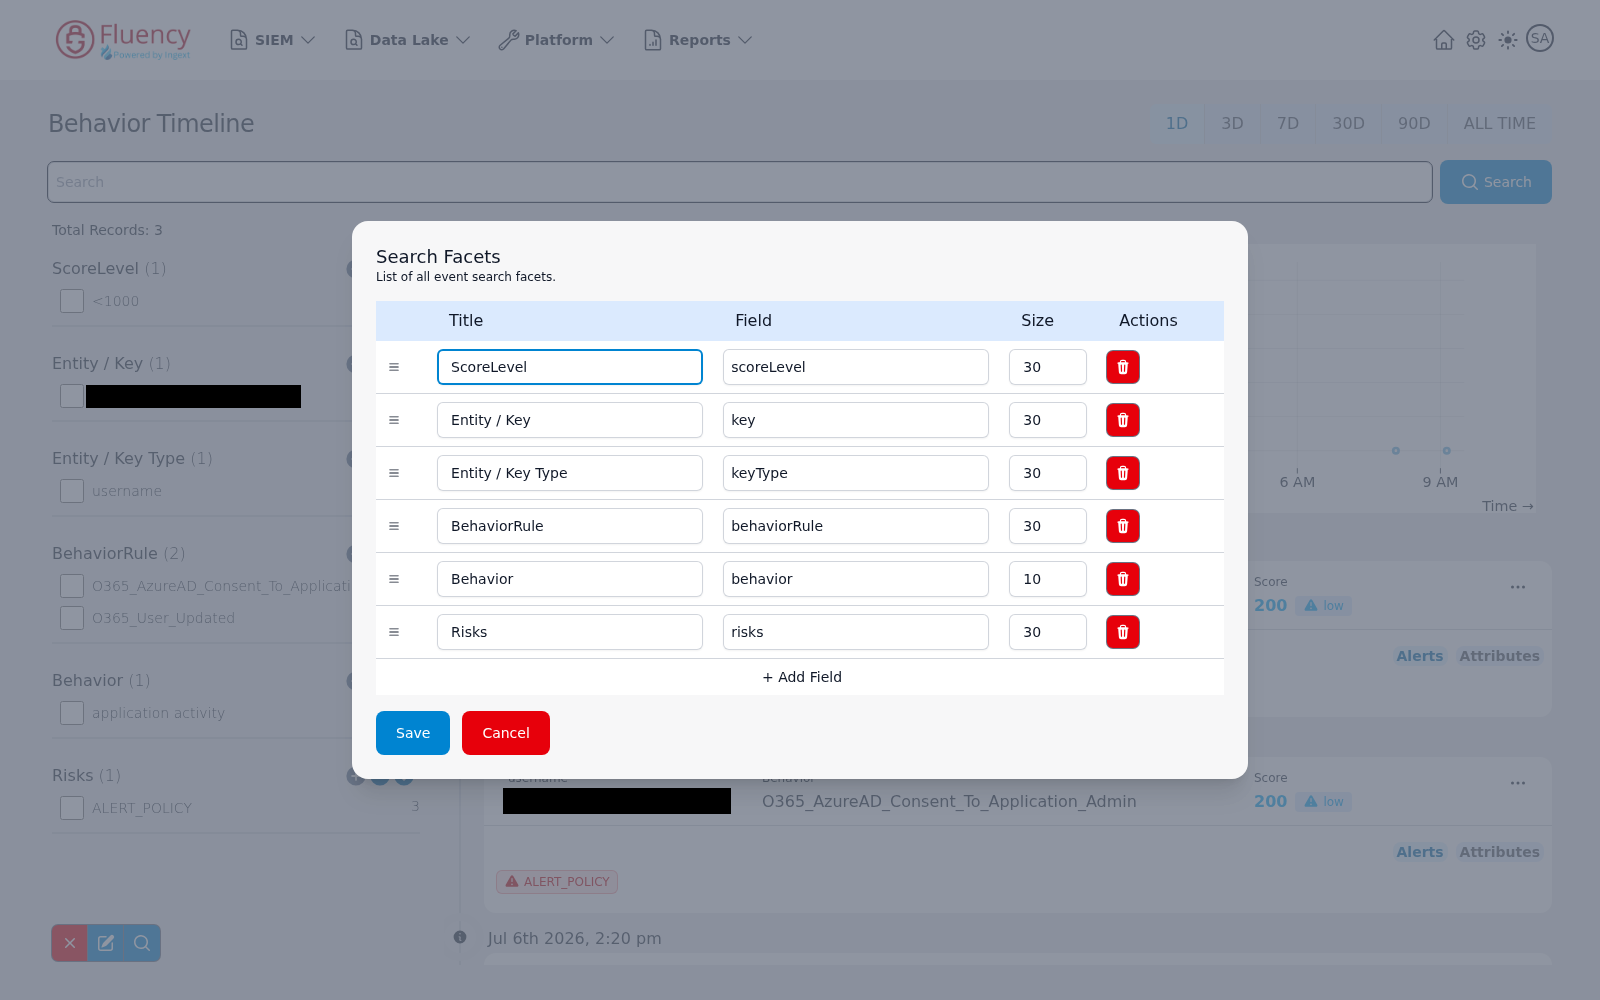
The dialog is a table with Title, Field, and Size columns plus an Actions column. The default rows are:
| Title | Field | Size |
|---|---|---|
| ScoreLevel | scoreLevel | 30 |
| Entity / Key | key | 30 |
| Entity / Key Type | keyType | 30 |
| BehaviorRule | behaviorRule | 30 |
| Behavior | behavior | 10 |
| Risks | risks | 30 |
Each row has a drag handle on the left for reordering and a red trash button under Actions to remove the facet. All three cells are editable text fields. Click + Add Field to append a new facet row, then Save to apply the changes or Cancel to discard them.
Timeline Chart
The chart at the top of the main area is headed Timeline Chart Timeline with the number of plotted events in parentheses (3 events in this capture). It plots one dot per event, with Risk Score on the vertical axis and time of day on the horizontal axis (labeled Time), giving a quick view of when scored activity occurred in the selected range.
Timeline Entries
Below the chart, events are listed newest first along a vertical timeline. Each timestamp group is marked on the spine with an info icon and a heading such as the event's date and time; a group can contain more than one event card when several events share the timestamp. Each card shows:
- username — the entity involved (an email address in this capture).
- Behavior — the behavior rule the event matched.
- Score — the numeric risk score with a severity chip (for example low).
- An ellipsis (...) menu button in the card's upper-right corner.
The panel beneath each card defaults to the alerts view: a row of tag chips for the alerts and risk tags the event raised (a red ALERT_POLICY chip in this capture), with the Alerts and Attributes toggle buttons on the right.
Row Menu
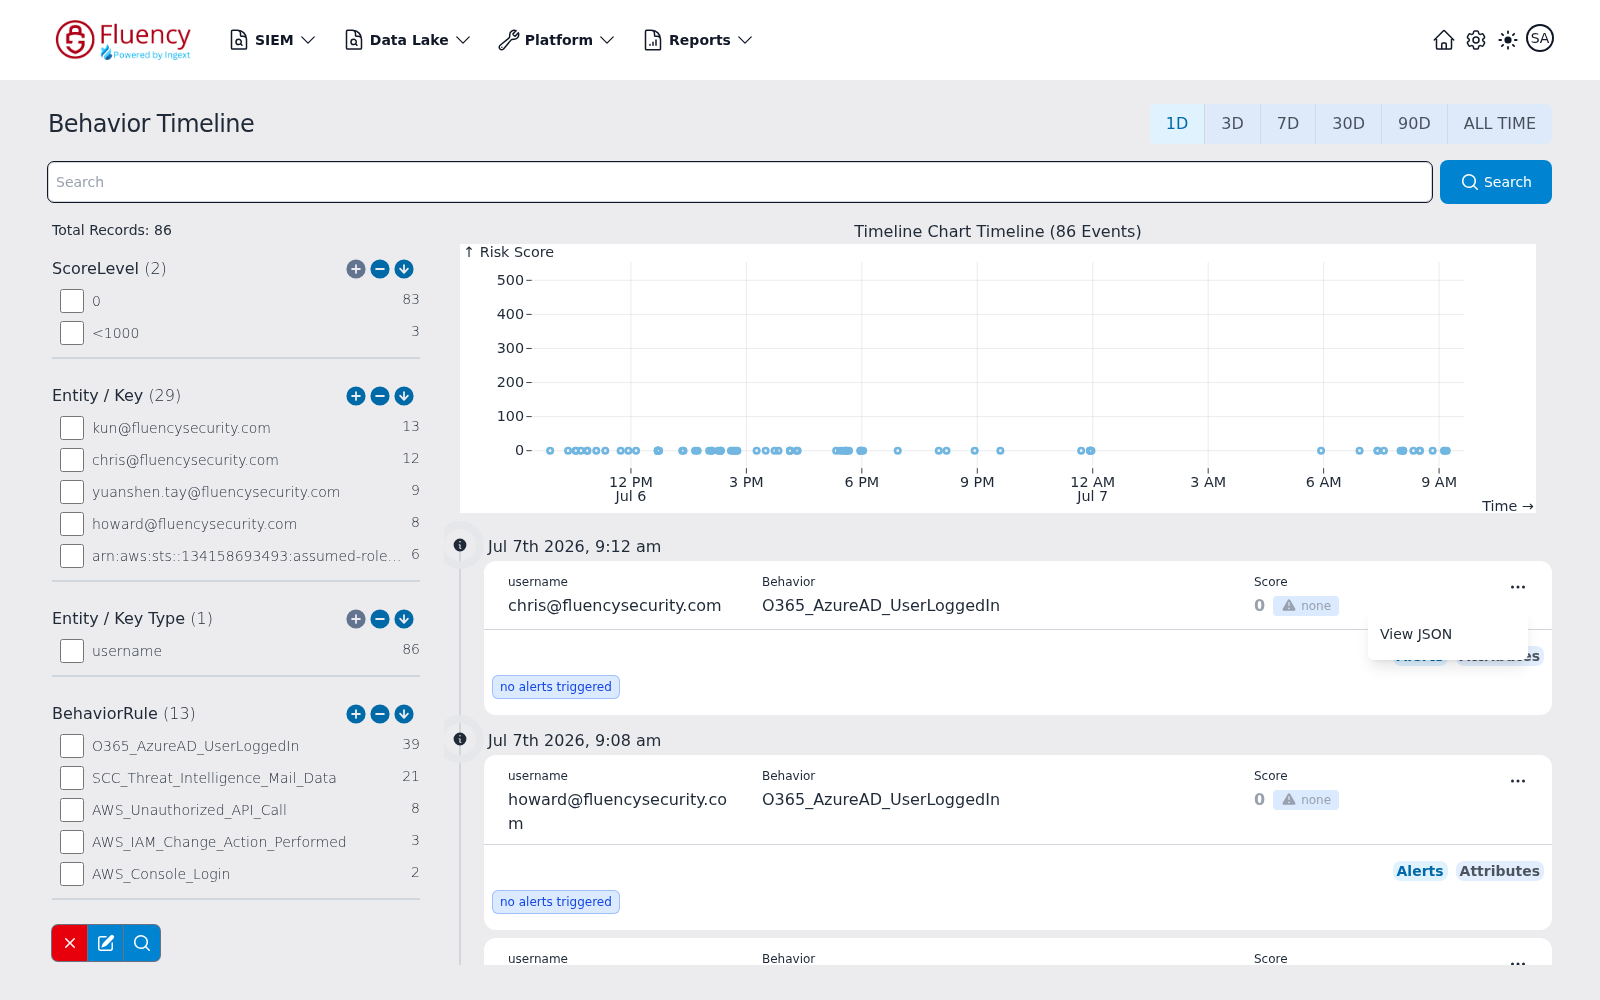
Clicking a card's ellipsis (...) button opens a menu with one option, View JSON:
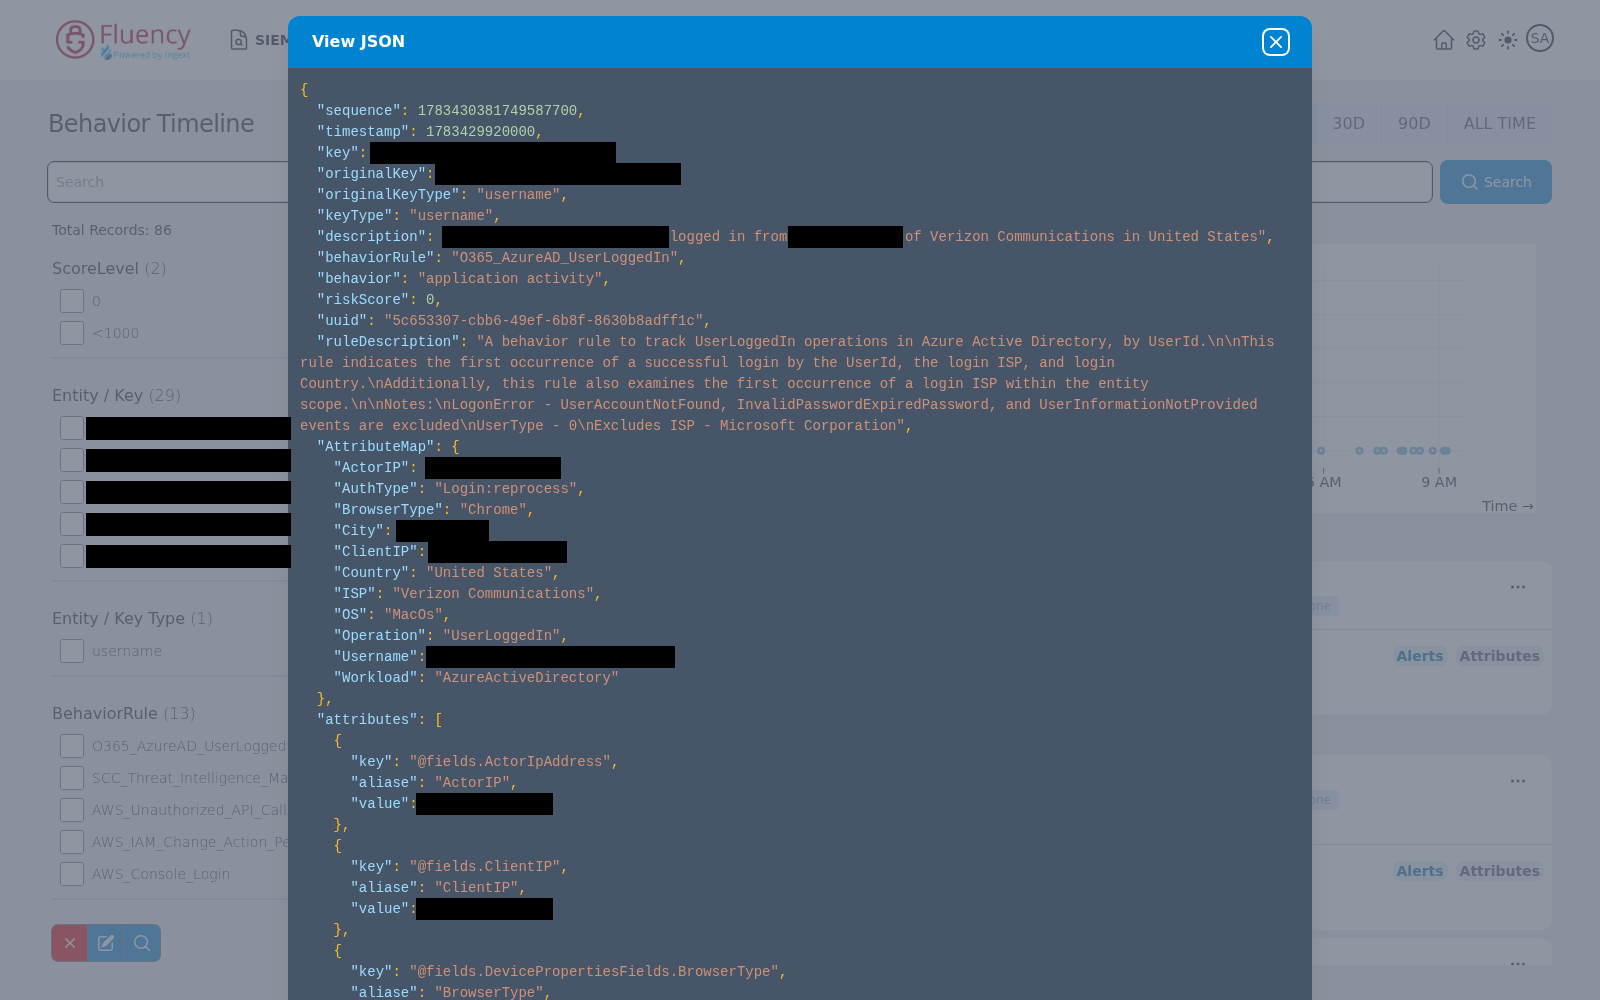
Choosing View JSON opens a dialog of the same name over the page, with a close (X) button at the right end of its title bar. The body shows the full event record as color-coded JSON: event fields such as sequence, timestamp, key, keyType, description, behaviorRule, behavior, riskScore, uuid, and ruleDescription; an AttributeMap object holding the same attribute fields the Attributes panel lists; and an attributes array pairing each raw source field with its alias and value. Click the X button to close the dialog and return to the timeline.
Alerts and Attributes
Every entry has a pair of toggle buttons on the right edge of its lower panel:
- Alerts — shows the tag chips for the alerts and risks the event triggered (the default view).
- Attributes — replaces the tags with the event's attribute fields as labeled rows.
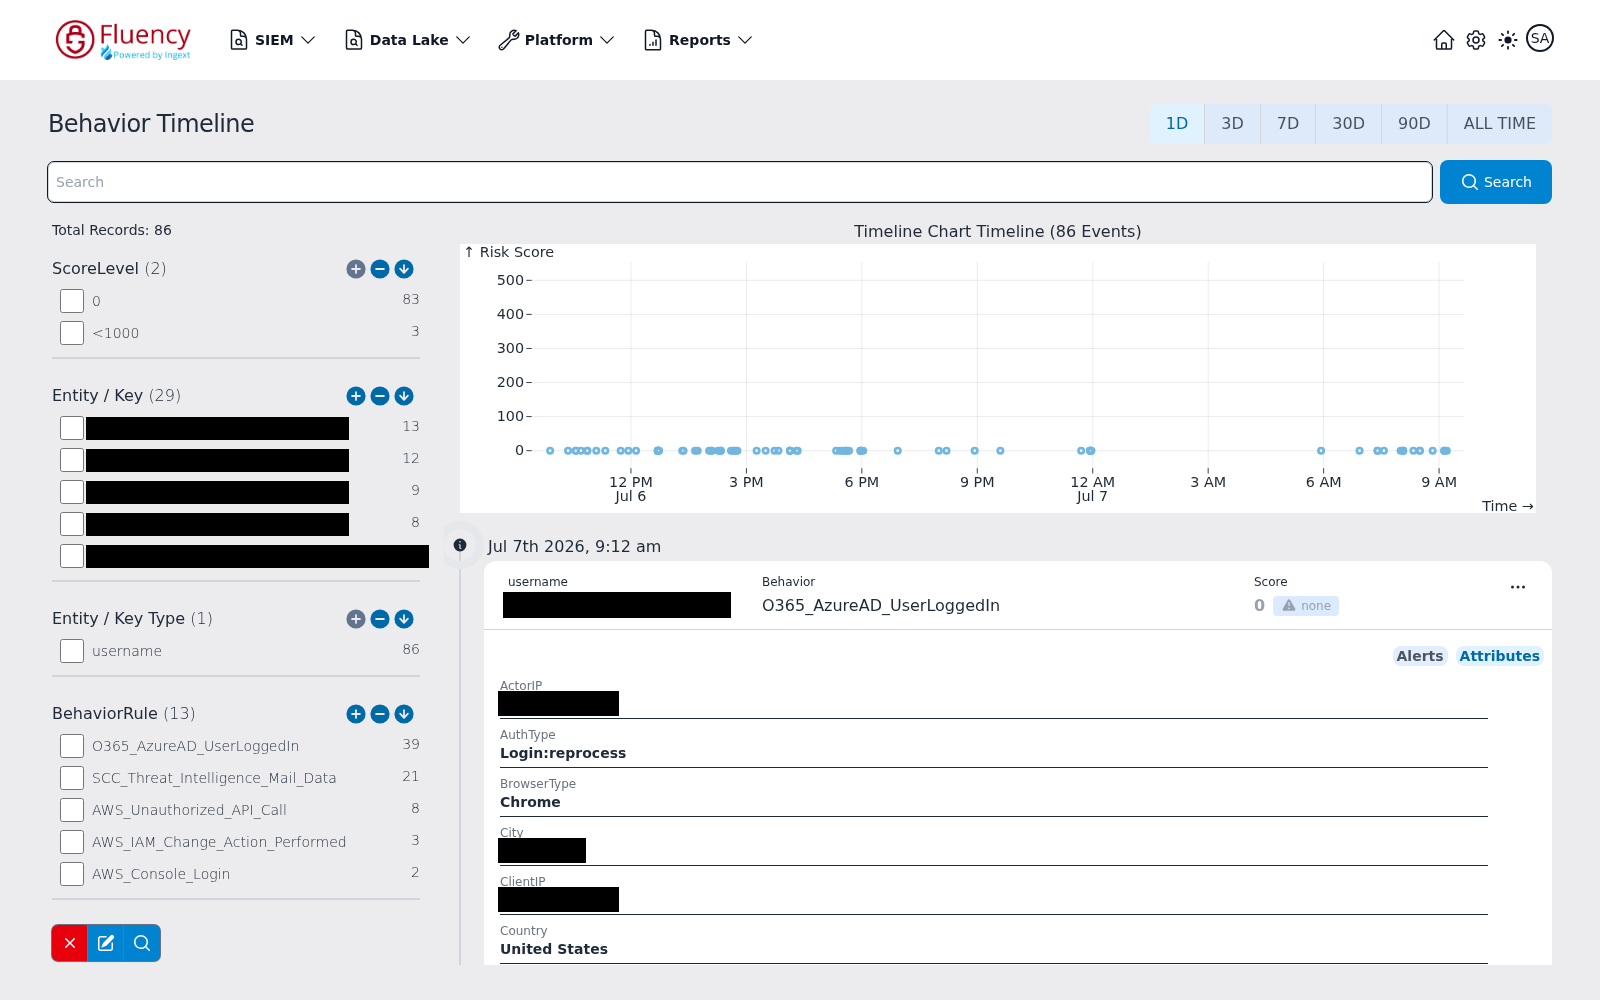
The attribute fields depend on the event source — the capture above shows an Azure AD sign-in event with fields such as ActorIP, AuthType, BrowserType, City, ClientIP, and Country. Click Alerts to switch the panel back to the tag view.