Overview Summary
The Overview Summary page is a dashboard of Fluency behavior summaries. It shows ticket counters for a chosen time range and a filterable list of the underlying ticket records.
Menu path: SIEM → Overview Summary · URL path: /SIEM/overviewSummary
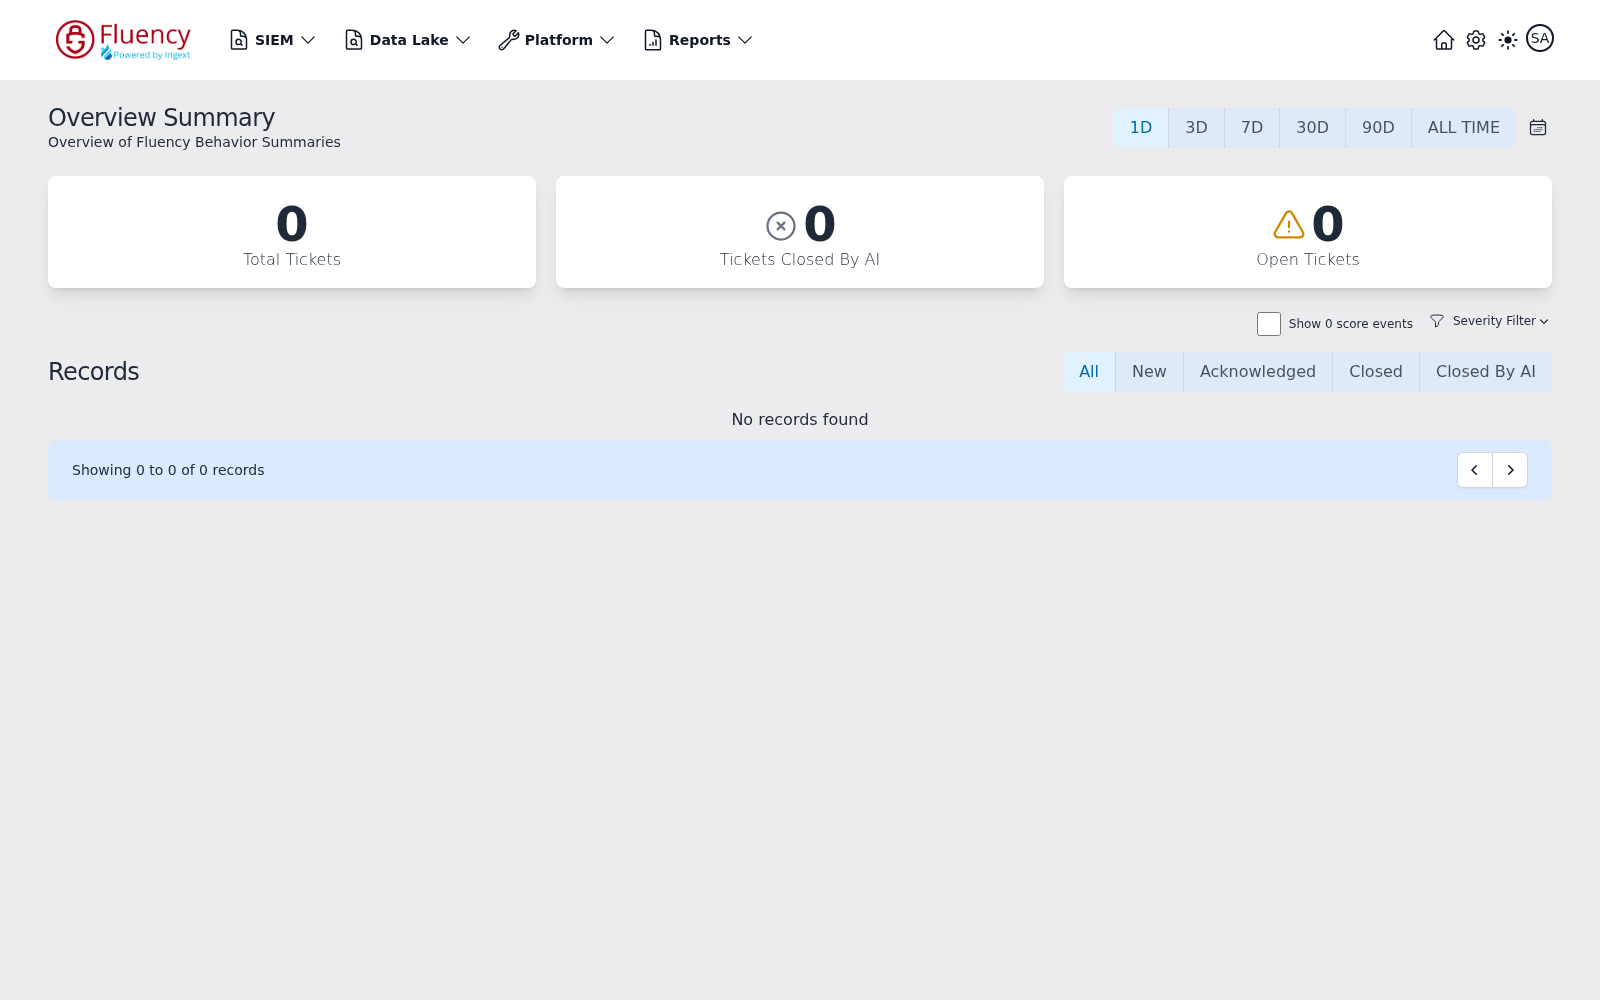
Page Layout
From top to bottom the page contains:
- A header with the page title and the subtitle Overview of Fluency Behavior Summaries, with the time-range selector on the right.
- Three counter cards: Total Tickets, Tickets Closed By AI, and Open Tickets.
- A filter row on the right with the Show 0 score events checkbox and the Severity Filter dropdown.
- The Records section, with status filter tabs on the right and the record list below.
- A footer bar showing the record range (for example Showing 0 to 0 of 0 records) with paging arrows.
Time Range
The button group in the upper right selects the period the counters and records cover:
- 1D (selected by default), 3D, 7D, 30D, 90D, ALL TIME.
- The calendar icon to the right of ALL TIME is the Custom date range control, used to set a specific date range instead of a preset.
Ticket Counters
Three cards summarize behavior-summary tickets for the selected time range:
- Total Tickets — all tickets generated in the period.
- Tickets Closed By AI — tickets resolved automatically, marked with a circled-x icon.
- Open Tickets — tickets still awaiting review, marked with a warning-triangle icon.
In this demo capture all three counters read zero.
Record Filters
Two controls sit between the counters and the records list, aligned to the right:
- Show 0 score events — a checkbox, off by default. Enable it to include events with a score of 0 in the list.
- Severity Filter — a dropdown that limits the list by ticket severity.
Severity Filter
Click Severity Filter to open a checklist of severities:
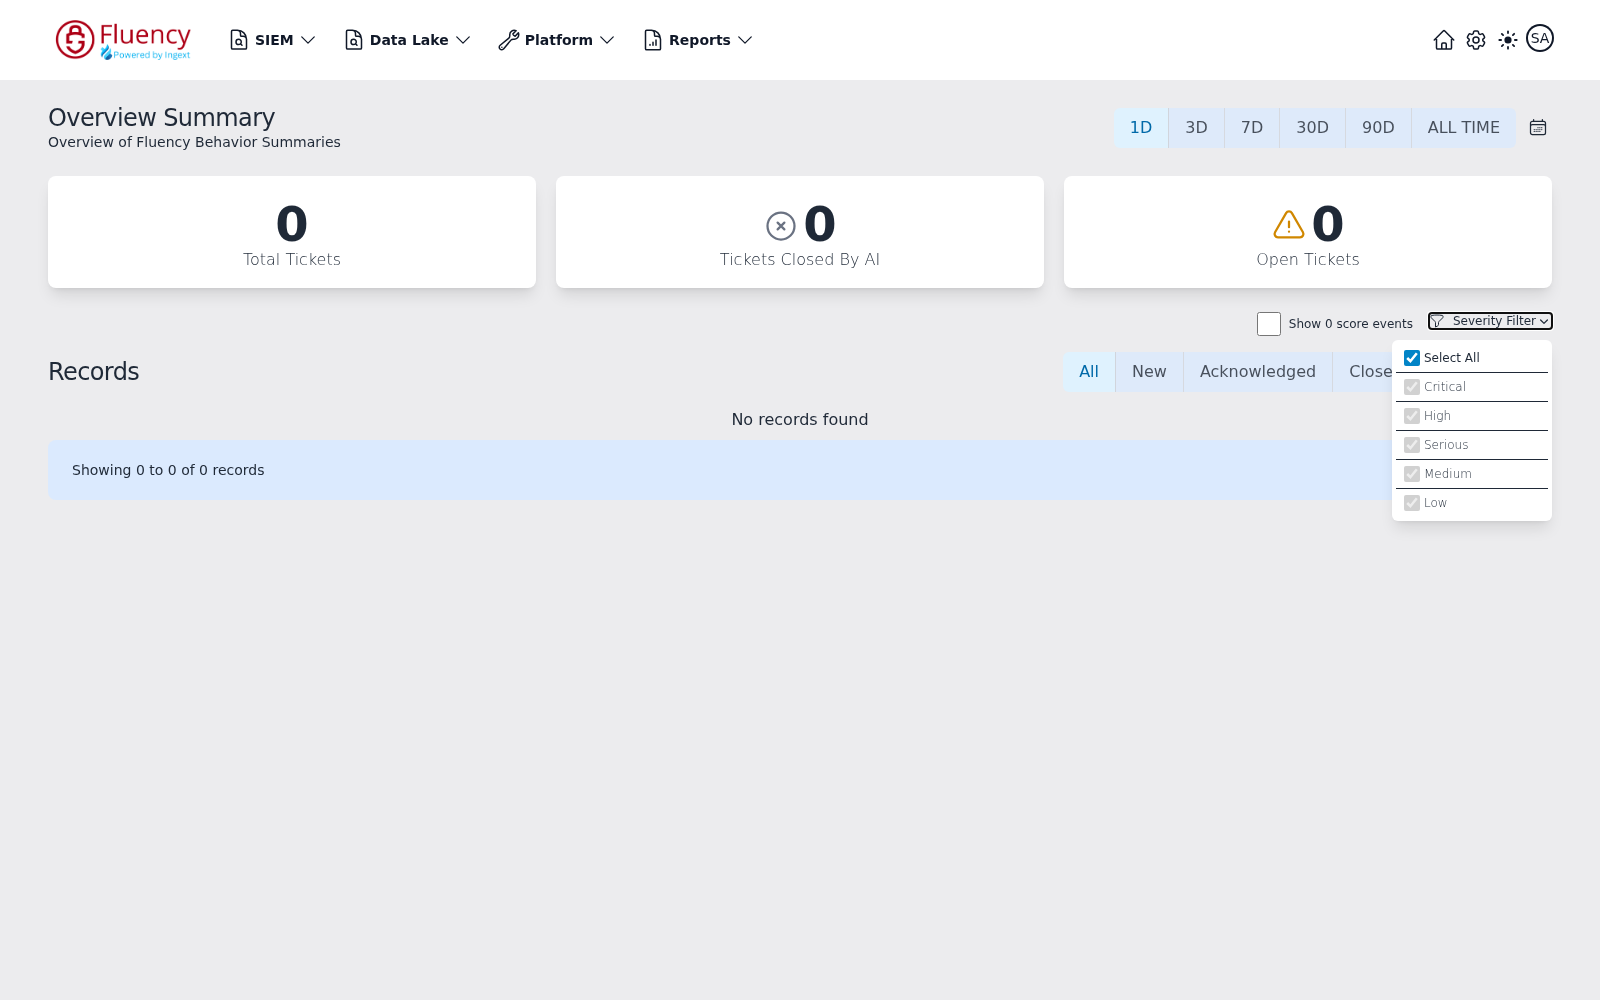
The dropdown contains a Select All checkbox followed by one checkbox per severity level:
- Critical
- High
- Serious
- Medium
- Low
With Select All checked (the default), every severity is included.
Records
The Records section lists the individual tickets that make up the counters. A tab bar on the right filters the list by ticket status:
- All (selected by default)
- New
- Acknowledged
- Closed
- Closed By AI
When nothing matches the current time range and filters, the list shows No records found. The footer bar reports the visible range (Showing 0 to 0 of 0 records in this capture) and provides left and right arrow buttons to page through longer lists.