Dashboard
The Dashboard page lists all report dashboards in the account, grouped by type. Each report appears as a card that previews its widgets and opens its rendered dashboard.
Menu path: Reports → Dashboard · URL path: /reports/Dashboard
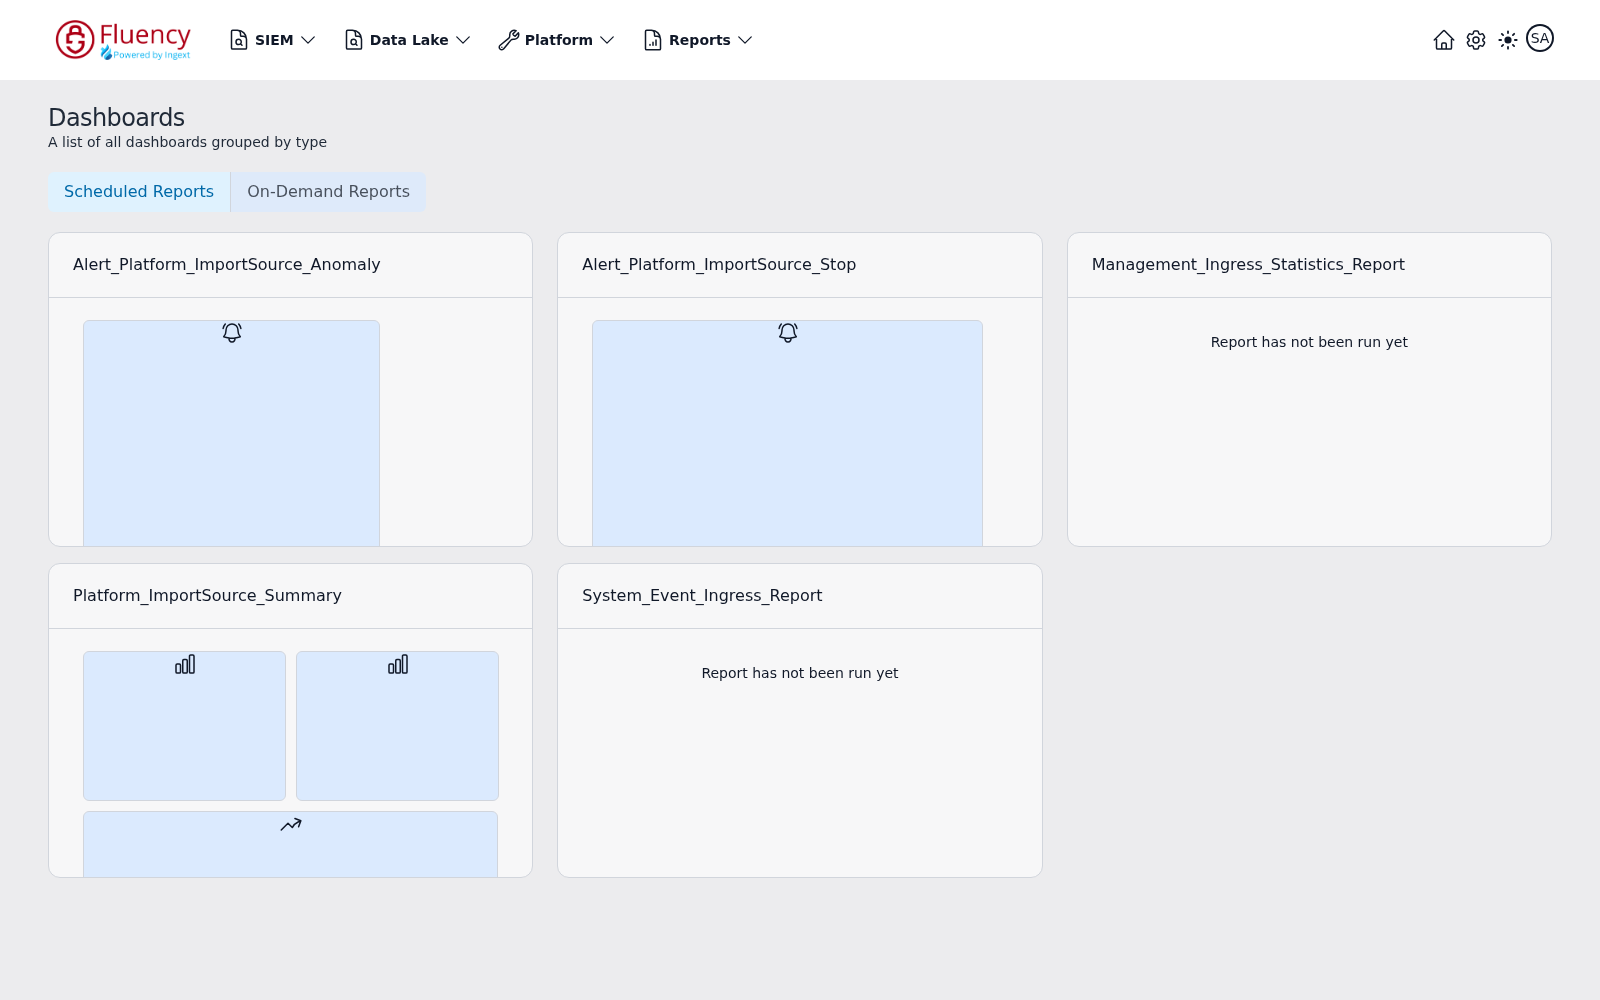
Page Layout
From top to bottom the page contains:
- A header with the title Dashboards and the subtitle A list of all dashboards grouped by type.
- Two tabs that group the dashboards by report type: Scheduled Reports (selected by default) and On-Demand Reports.
- A card grid, three cards per row, with one card for each report dashboard.
Report Type Tabs
The tabs above the grid switch which group of dashboards is shown:
- Scheduled Reports — dashboards for reports that run on a schedule.
- On-Demand Reports — dashboards for reports that are run manually.
Dashboard Cards
Each card has a title bar showing the report name and a body that previews the report's content:
- Reports that have run show thumbnail tiles of their widgets — the tile icons indicate the widget type (alert, bar chart, pie chart, trend line, and so on).
- Reports that have never run show the message Report has not been run yet instead of a preview.
In this demo capture the Scheduled Reports tab shows five cards; two of them have not been run yet.