Collectors
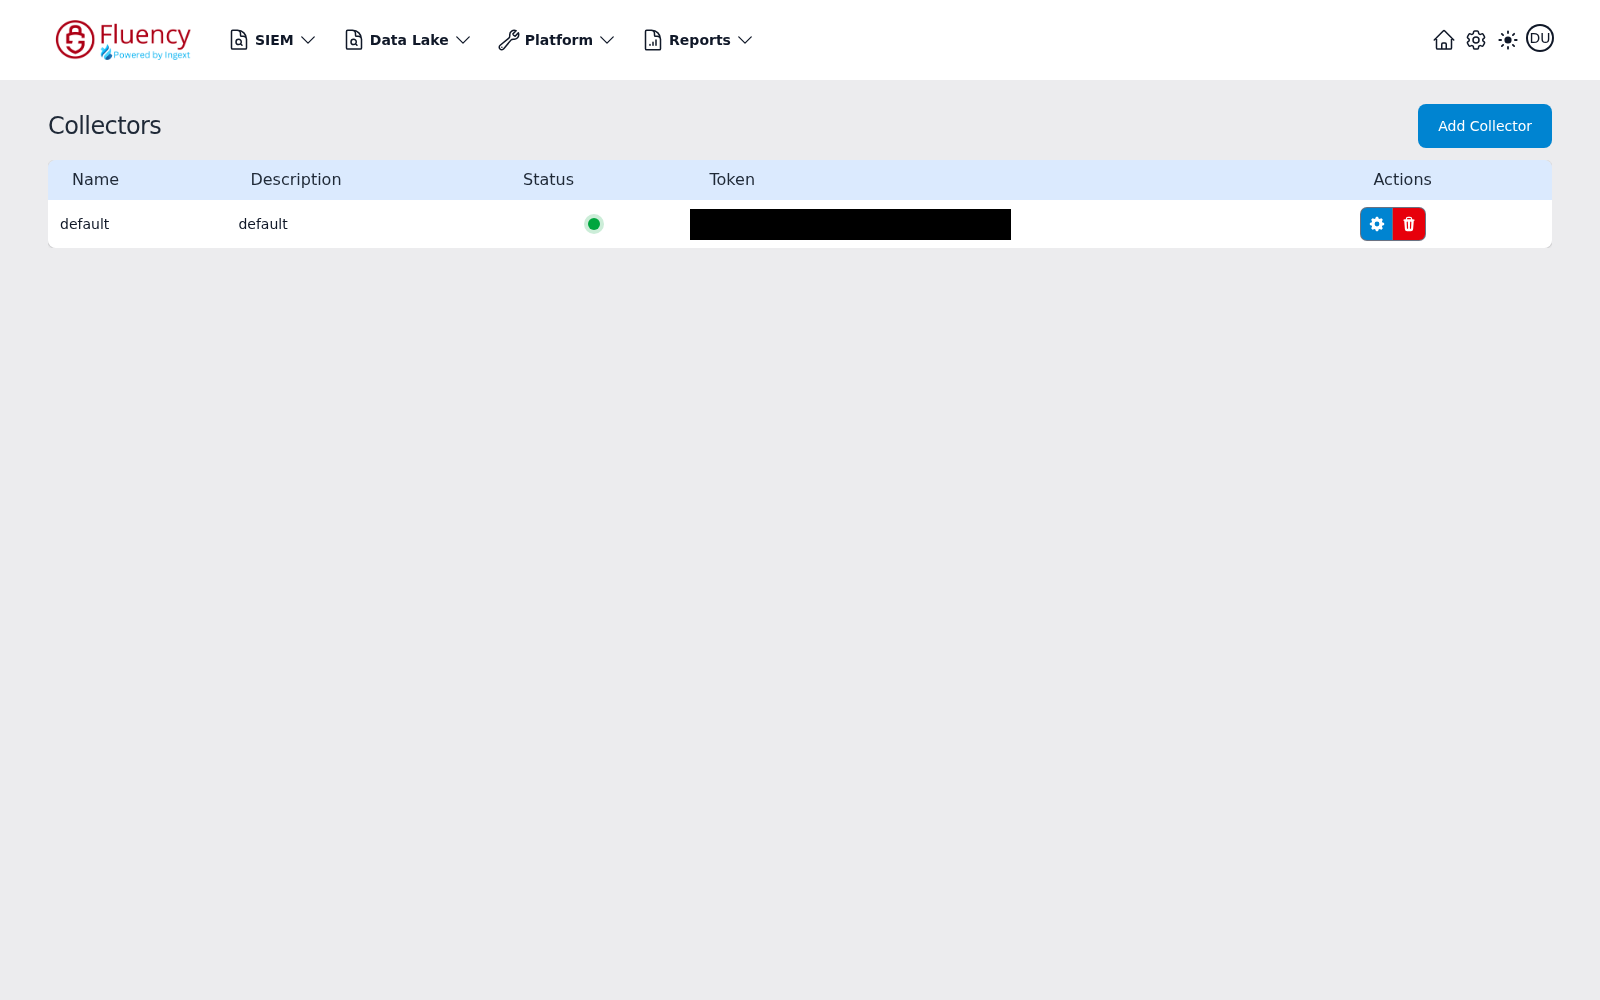
The Collectors page lists the collectors registered on the platform, along with each collector's status and token. From here you can add a collector manually, delete an existing one, or open a collector's own configuration.
Menu path: Platform → Administration → Collectors · URL path: /platform/collectors
Task guide: Managing Collectors — adding and configuring a collector.
Page Layout
The header shows the title Collectors with the Add Collector button on the right. Below it, a table lists the registered collectors with Name, Description, Status, Token, and Actions columns.
Add Collector
Click Add Collector to open the Add Collector dialog.
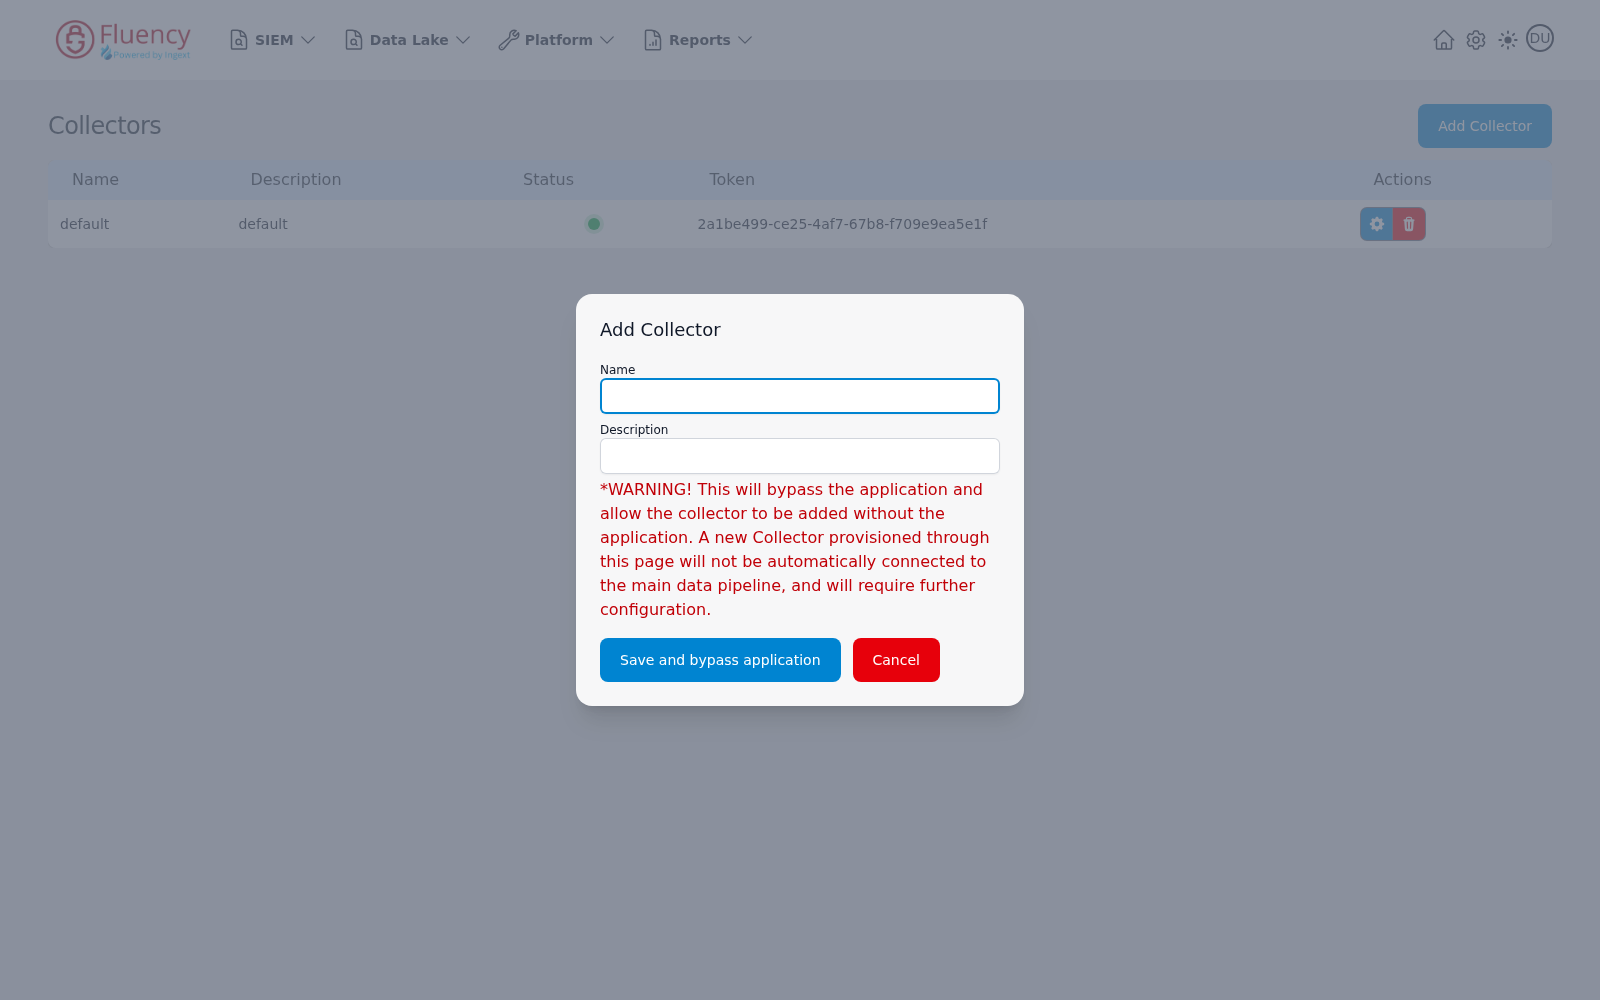
The dialog contains two fields:
- Name
- Description
A warning in red text explains that this bypasses the application: a collector provisioned through this page is added without an application, is not automatically connected to the main data pipeline, and requires further configuration.
Click Save and bypass application to create the collector anyway, or Cancel to close the dialog.
Collectors Table
Each row is one registered collector:
- Name and Description — the collector's identifying details.
- Status — an indicator dot showing the collector's current state. Green means the appliance is connected and reporting; grey means it has not yet checked in.
- Token — the collector's unique token, the value the appliance registers with.
- Actions — two buttons: a blue gear that opens the collector's configuration, and a red trash that deletes it.
Delete a Collector
Click the red trash icon in the Actions column to open the Delete Collector confirmation dialog.
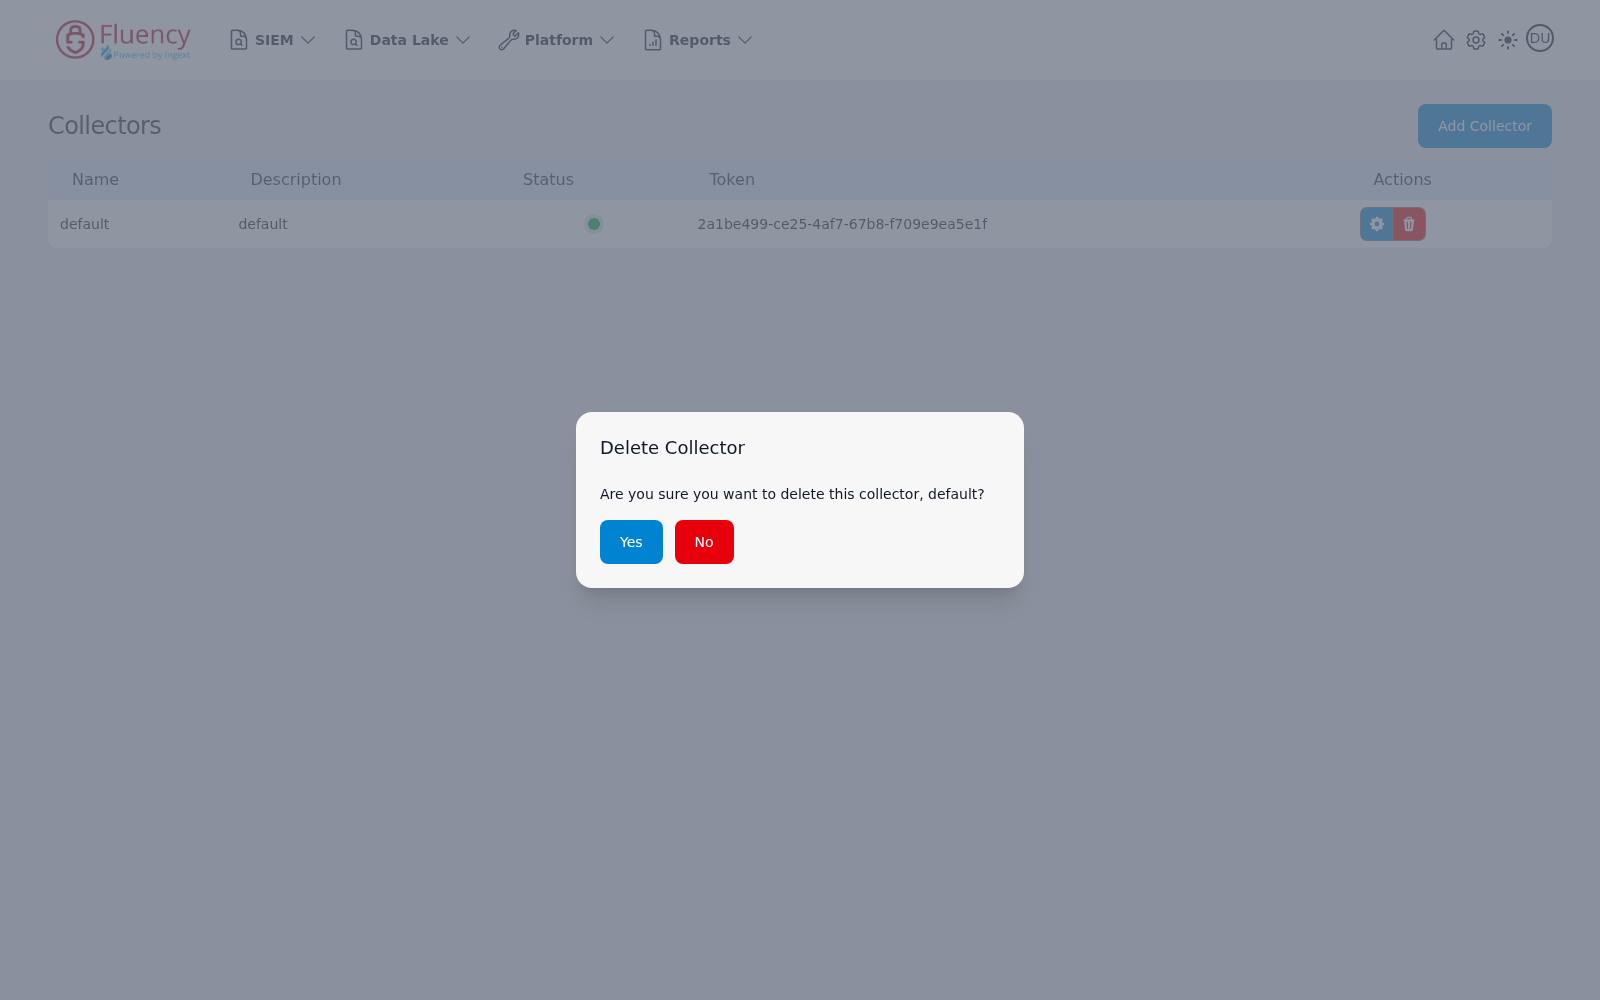
The dialog asks Are you sure you want to delete this collector, followed by the collector's name. Click Yes to delete the collector or No to keep it.
Collector Configuration
Click a row's blue gear button to open Collector Configuration for that appliance. The header carries the title and Collector name: followed by the collector's name, and the body is divided into three tabs: Syslog Ports (the tab it opens on), Network Settings, and Management.
Syslog Ports
Lists the syslog listeners running on the collector appliance — not the platform's own cloud syslog endpoint, which is configured on Syslog Ports.
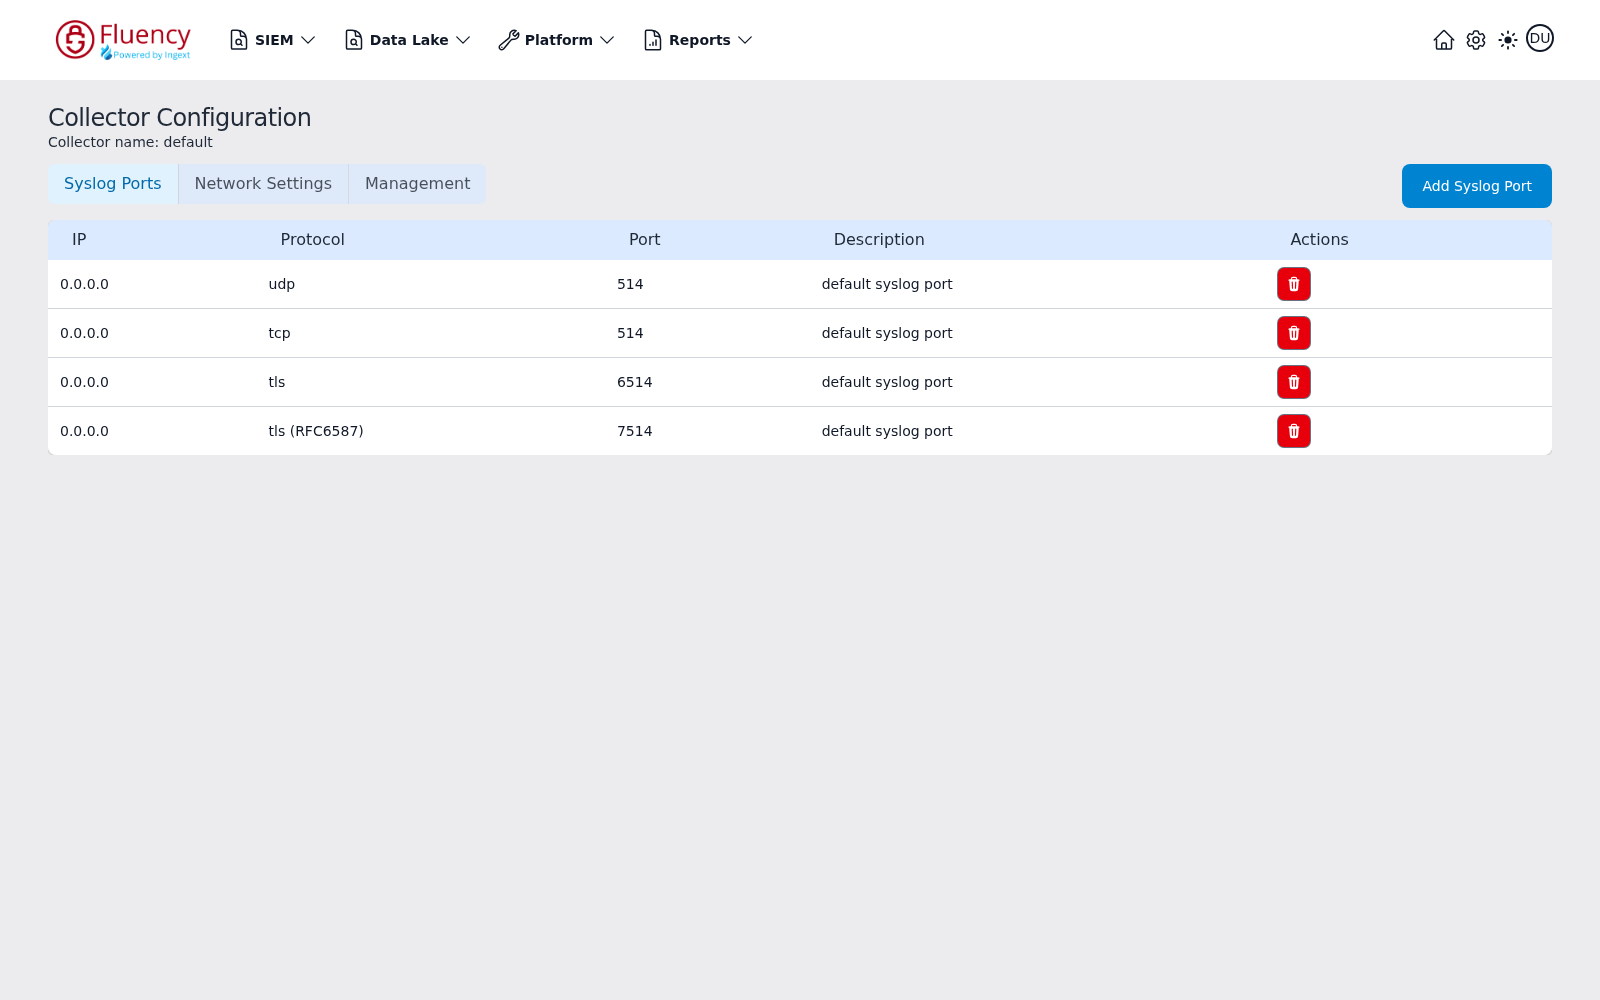
The table has IP, Protocol, Port, Description, and Actions columns. A default collector listens on four ports: udp and tcp on 514, tls on 6514, and tls (RFC6587) on 7514, each bound to 0.0.0.0 and described as default syslog port.
Add Syslog Port
Click Add Syslog Port in the upper right to open the Add Syslog Port Configuration dialog.
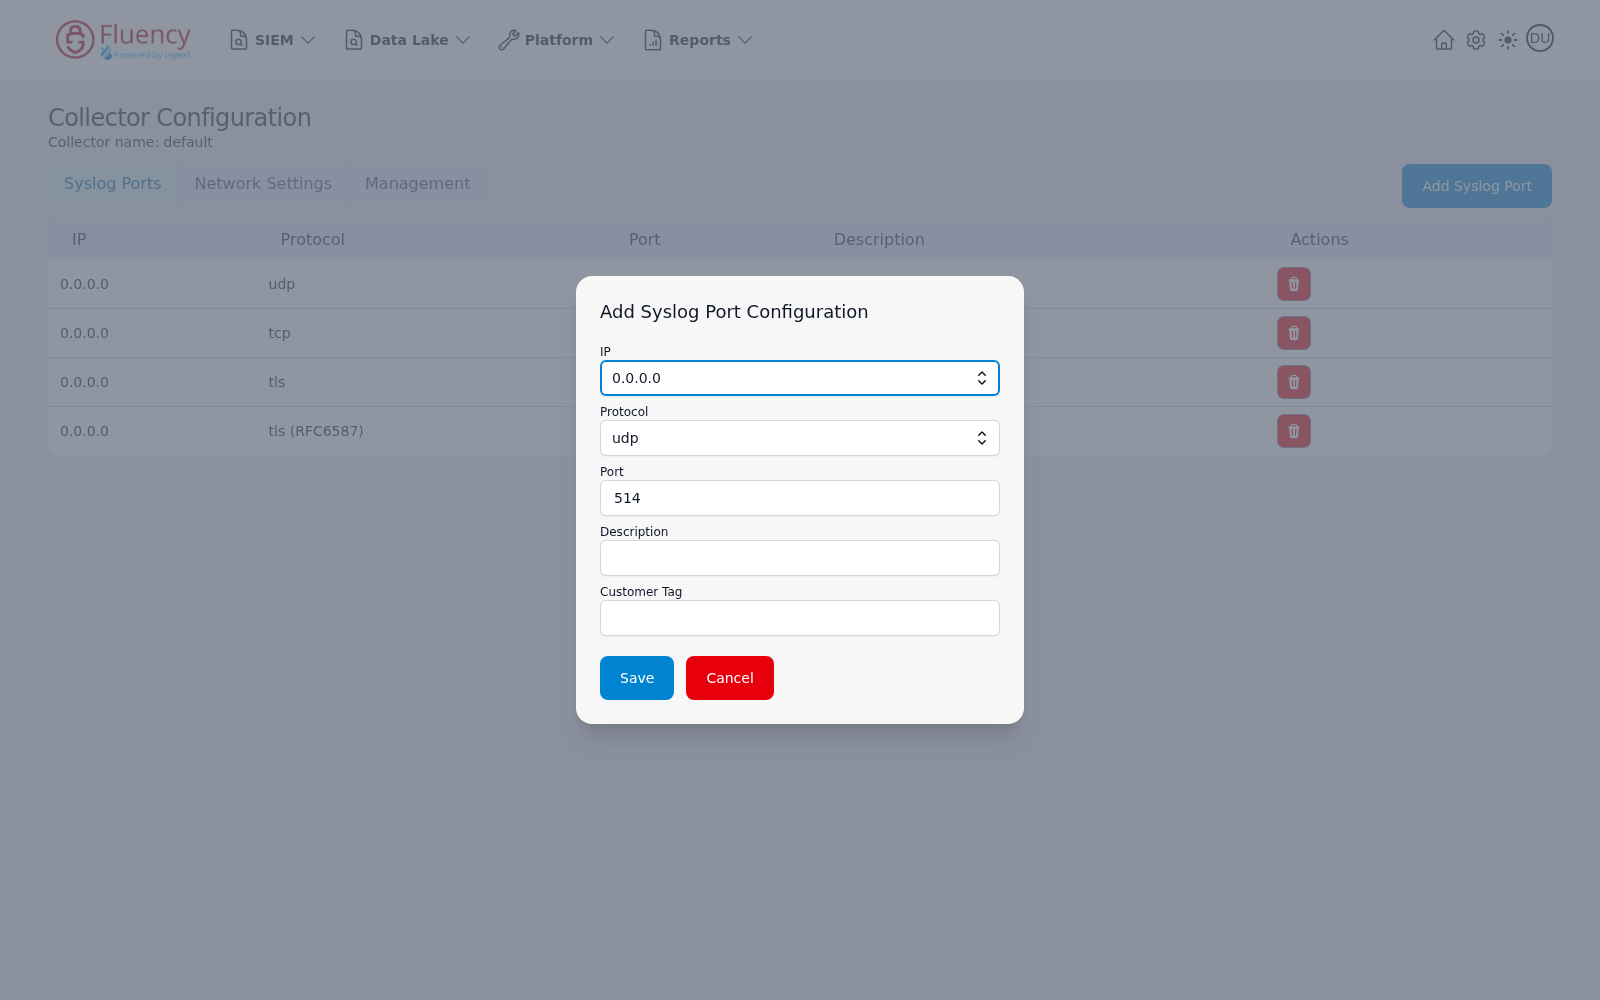
The dialog has five fields:
- IP — a drop-down of the addresses the collector can bind to, defaulting to
0.0.0.0(all interfaces). - Protocol — a drop-down of the supported protocols, defaulting to
udp. - Port — the listening port, prefilled with
514. - Description — free text identifying the listener.
- Customer Tag — an optional tag applied to records arriving on this port, used to attribute them to a customer.
Click Save to create the listener or Cancel to close without saving.
Delete a Syslog Port
Each row's red trash button opens the Delete Syslog Port confirmation, which names the protocol and port it will remove.
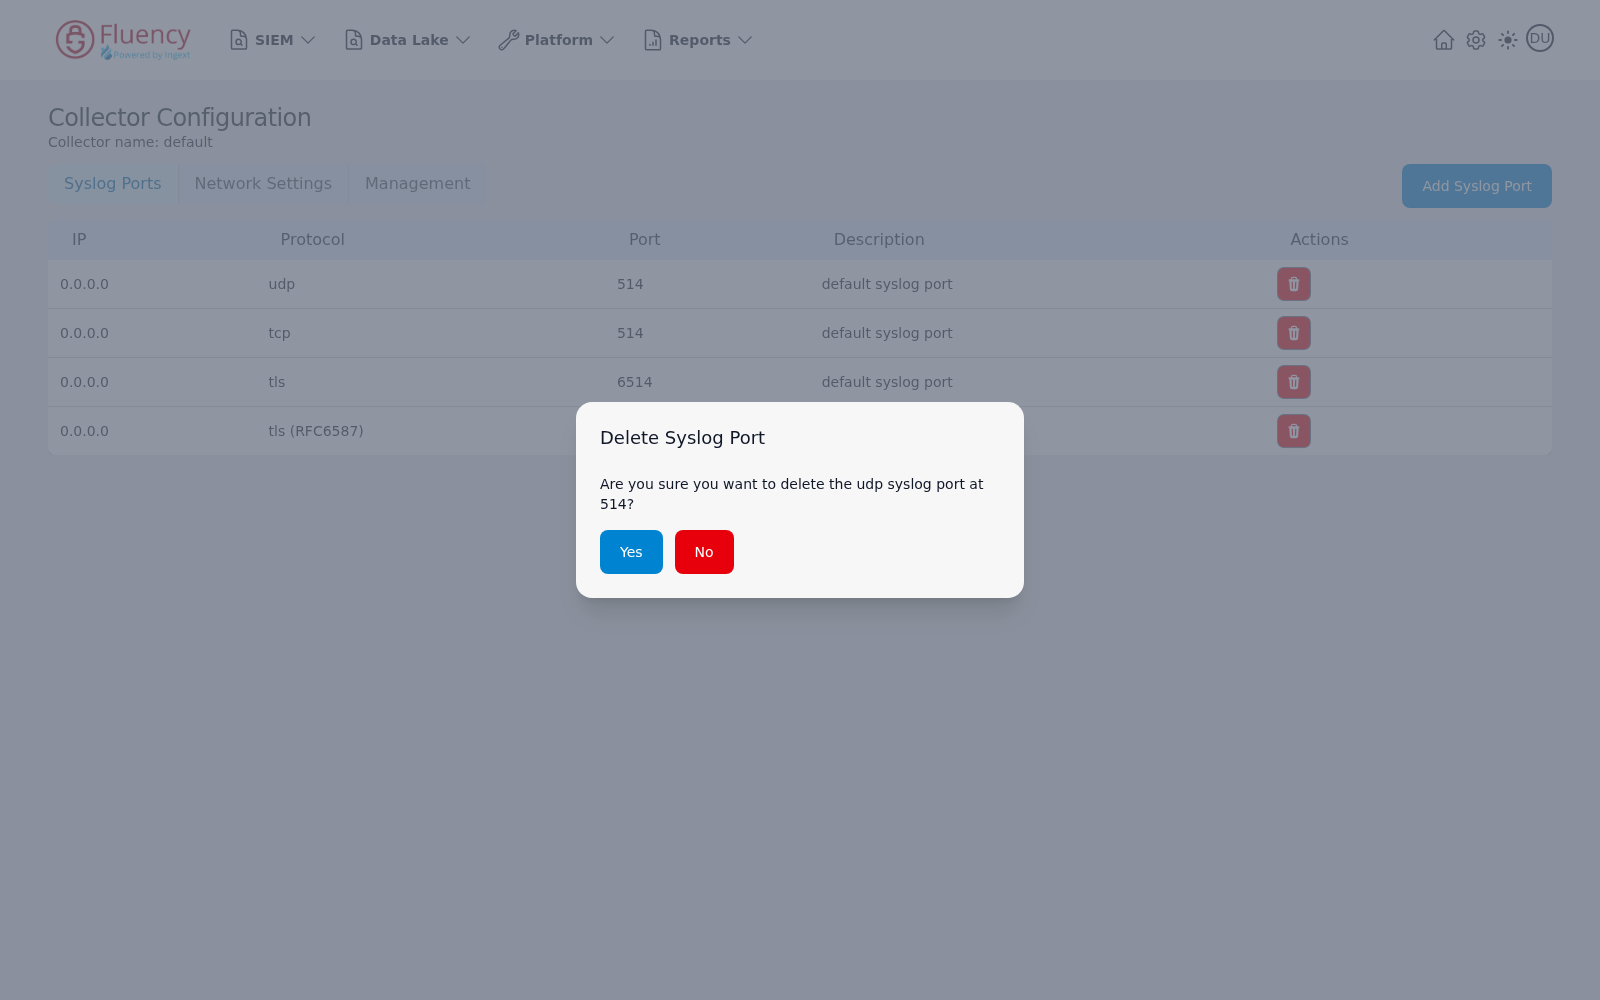
Click Yes to delete the listener or No to keep it.
Network Settings
A read-only view of the appliance's network configuration.
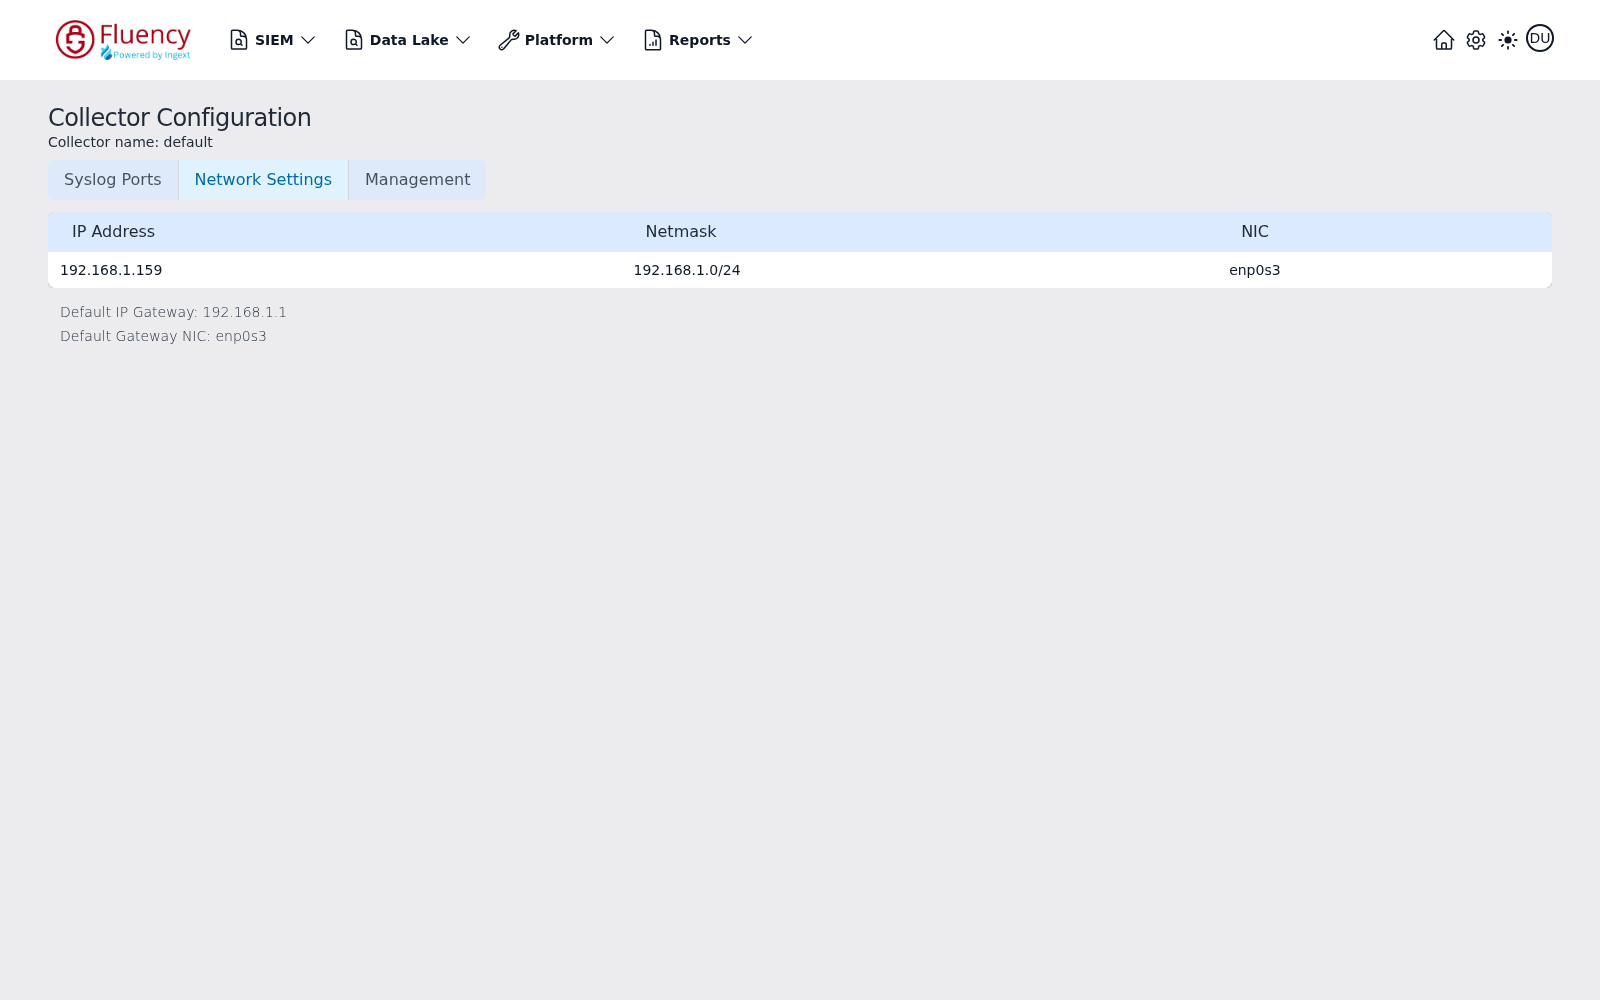
A table lists each interface with IP Address, Netmask, and NIC columns, and two lines beneath it report the Default IP Gateway and the Default Gateway NIC.
Management
The appliance's health and diagnostics, and the only tab with a control that changes the collector's state.
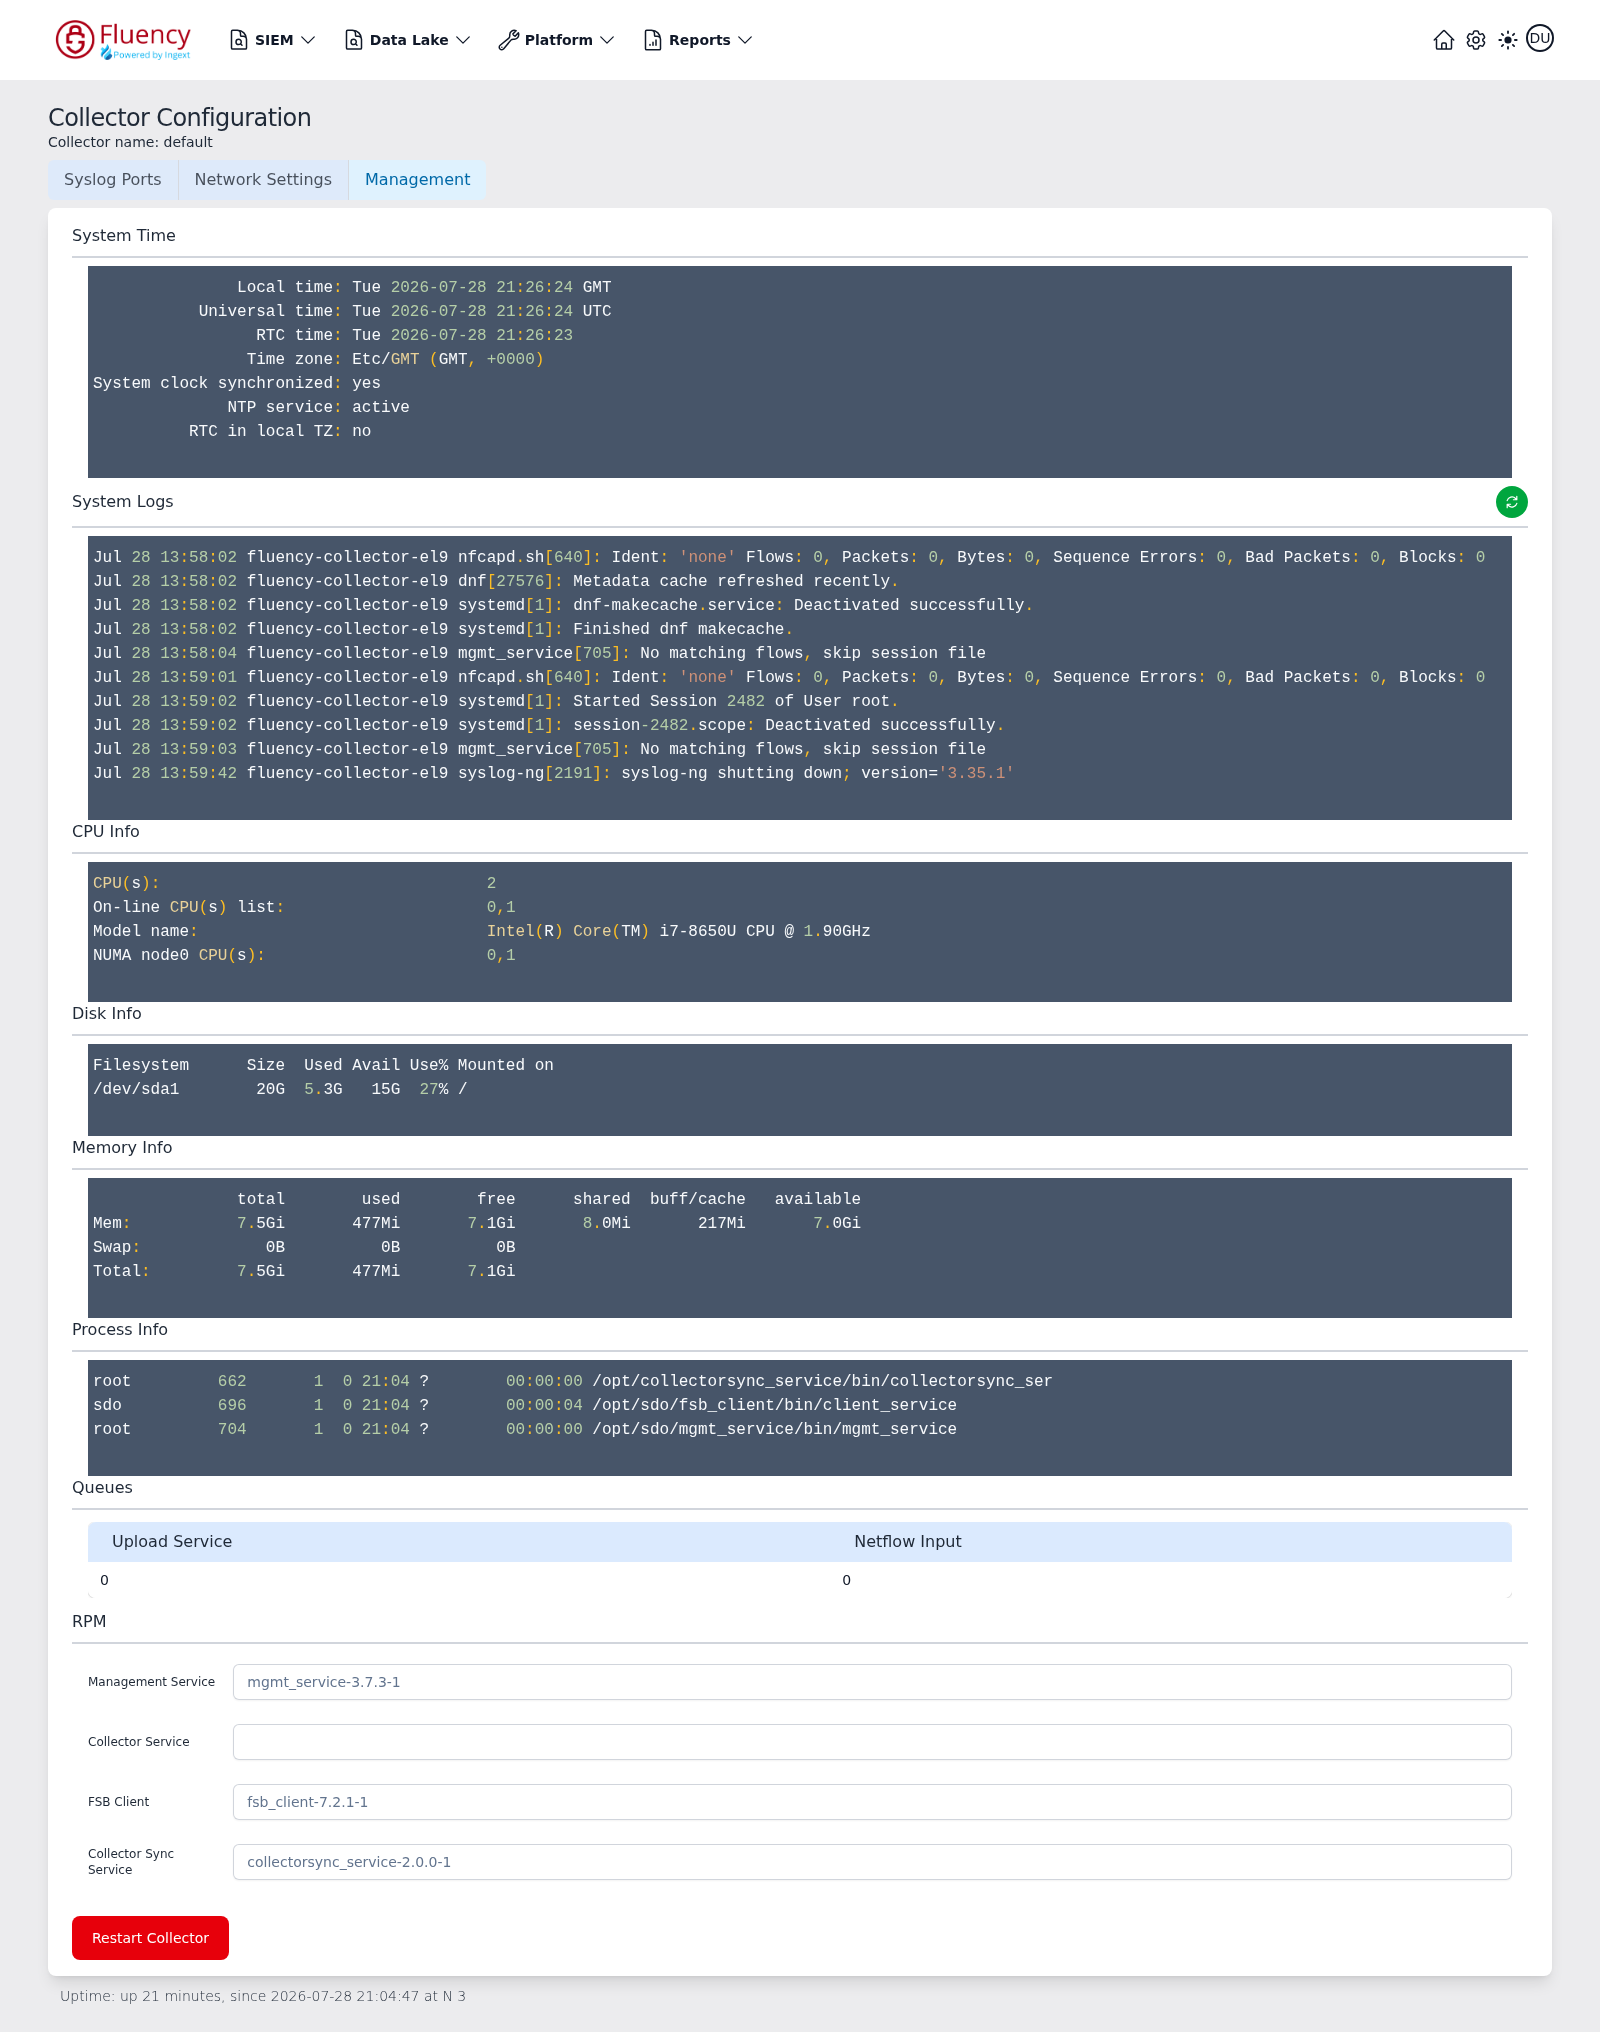
The tab is a stack of read-only panels:
| Panel | What it reports |
|---|---|
| System Time | timedatectl output — local, universal and RTC time, time zone, whether the system clock is synchronized, and whether the NTP service is active. |
| System Logs | A tail of the appliance's syslog. The green button at the panel's upper right is Refresh Status, which re-reads the log. |
| CPU Info | Core count, on-line CPU list, model name, and NUMA node layout. |
| Disk Info | df output for the appliance's filesystems — size, used, available, use percentage, and mount point. |
| Memory Info | free output — total, used, free, shared, buff/cache, and available memory, plus swap. |
| Process Info | The collector's running service processes and their paths. |
| Queues | Pending item counts for the Upload Service and Netflow Input queues. A non-zero value means the collector is backing up. |
| RPM | The installed package version of each collector component: Management Service, Collector Service, FSB Client, and Collector Sync Service. A field is empty when that component is not installed. |
A footer below the panels reports the appliance's uptime and the time it last started.
Restart Collector
The red Restart Collector button at the bottom of the tab restarts the collector's services. It opens a confirmation first:
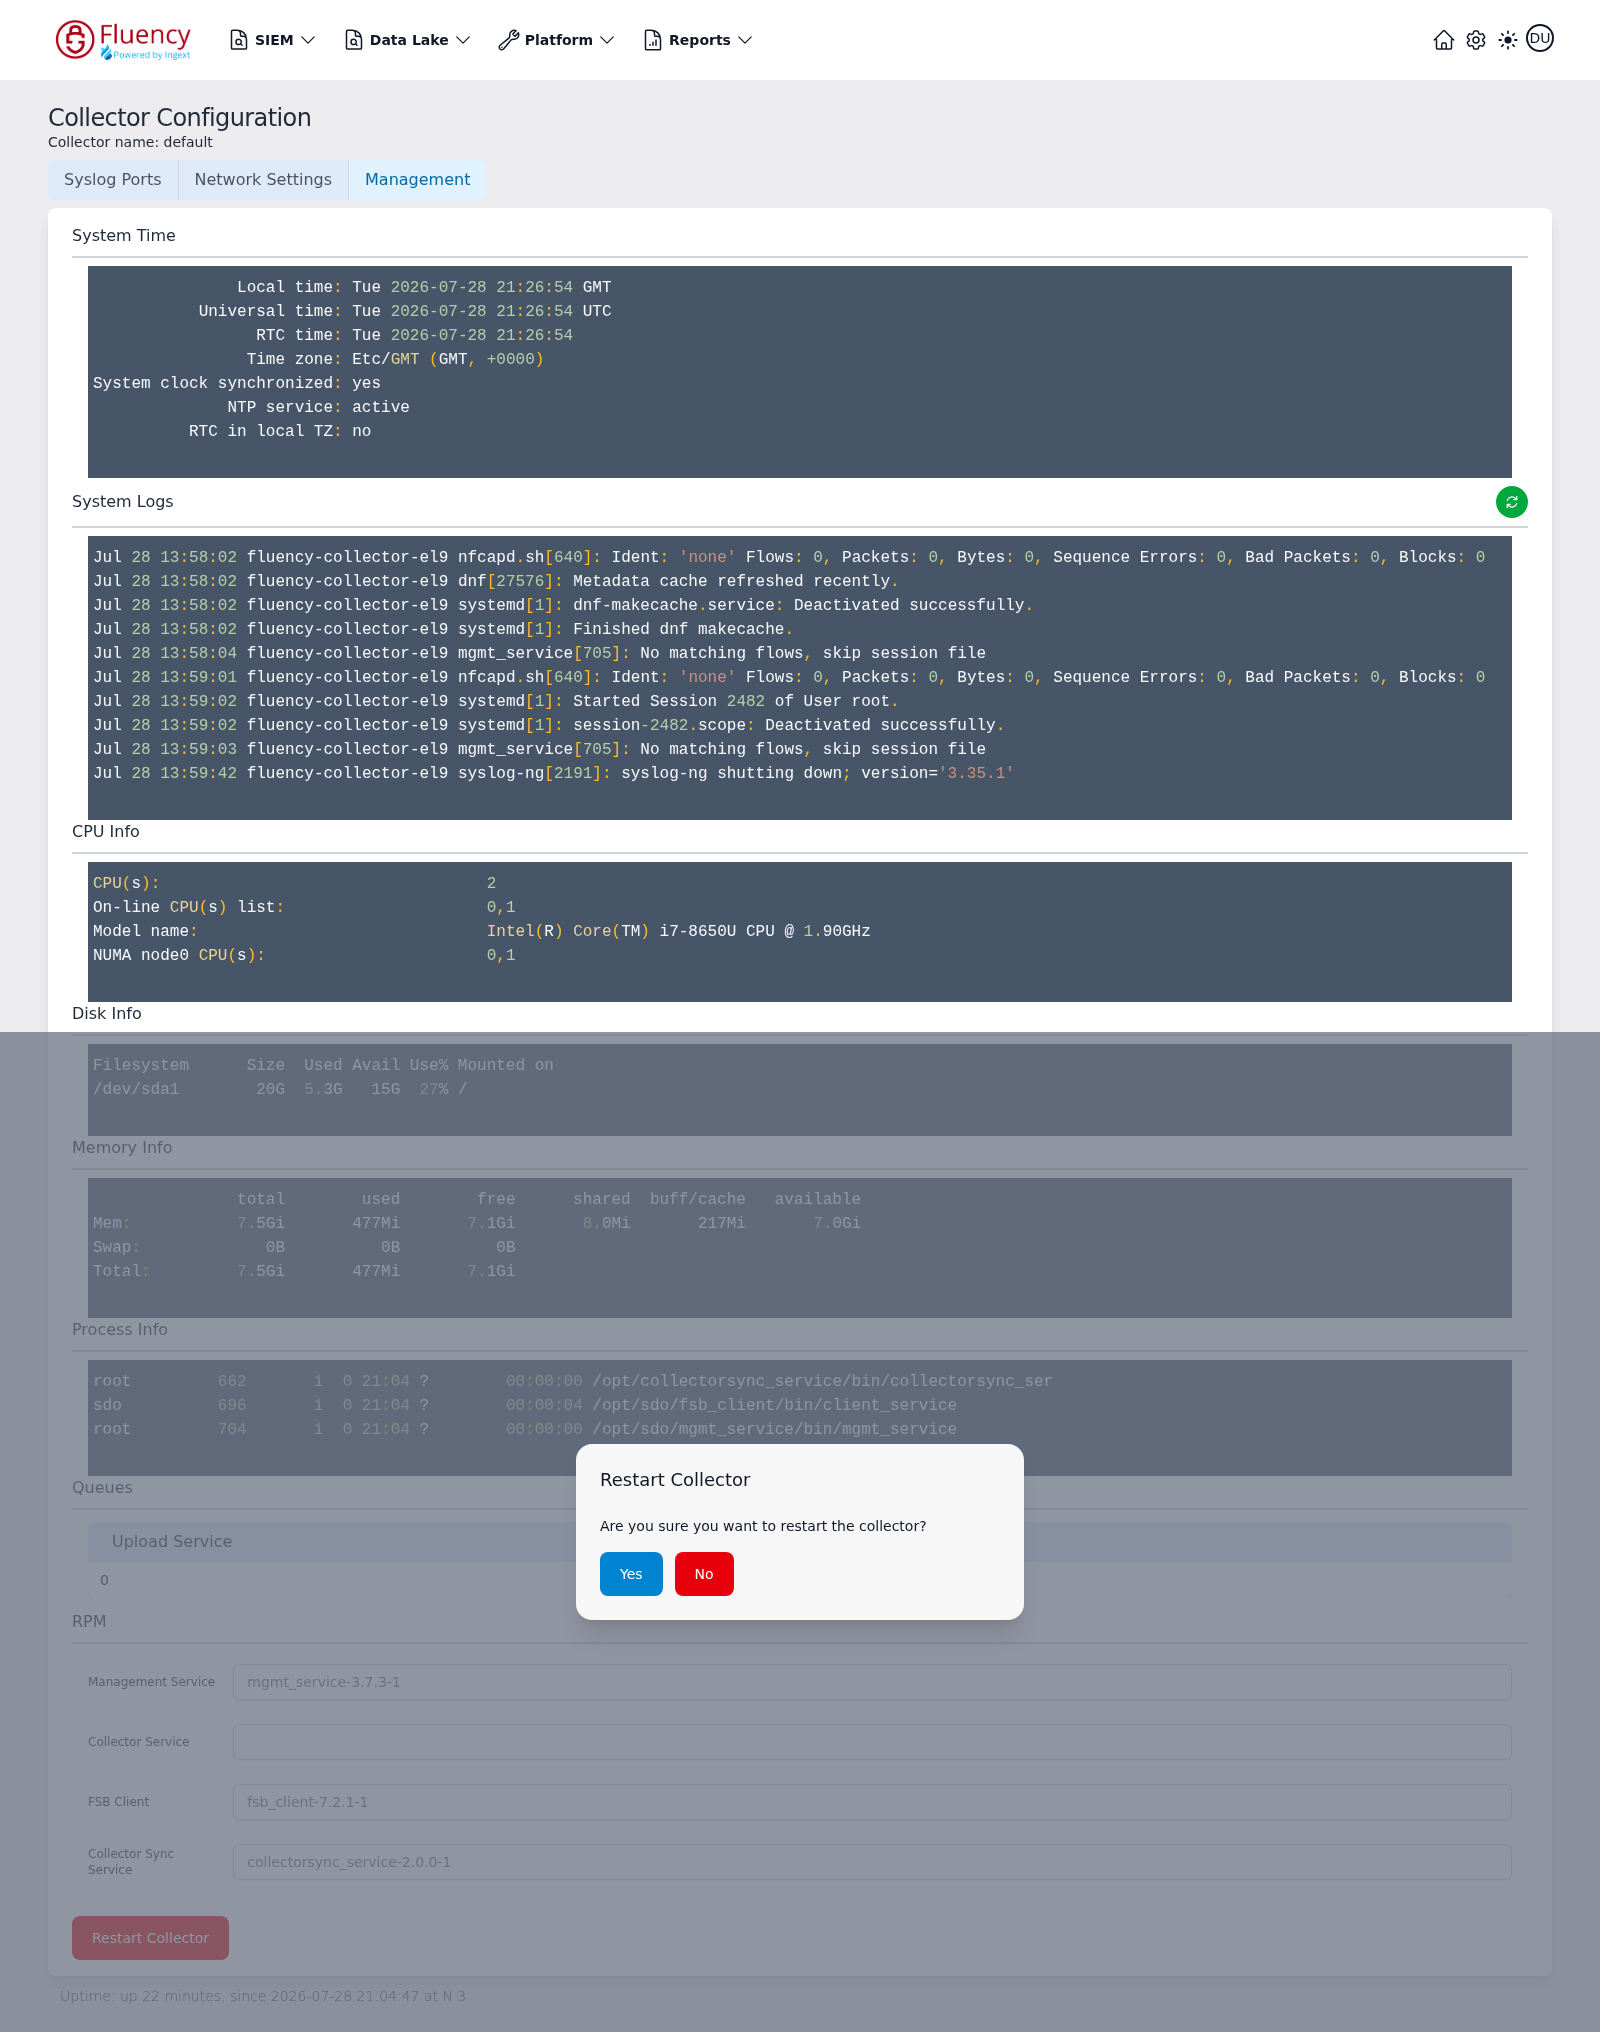
Click Yes to restart or No to cancel. Data arriving while the collector restarts is not received, so restart during a maintenance window where possible.