Configuration
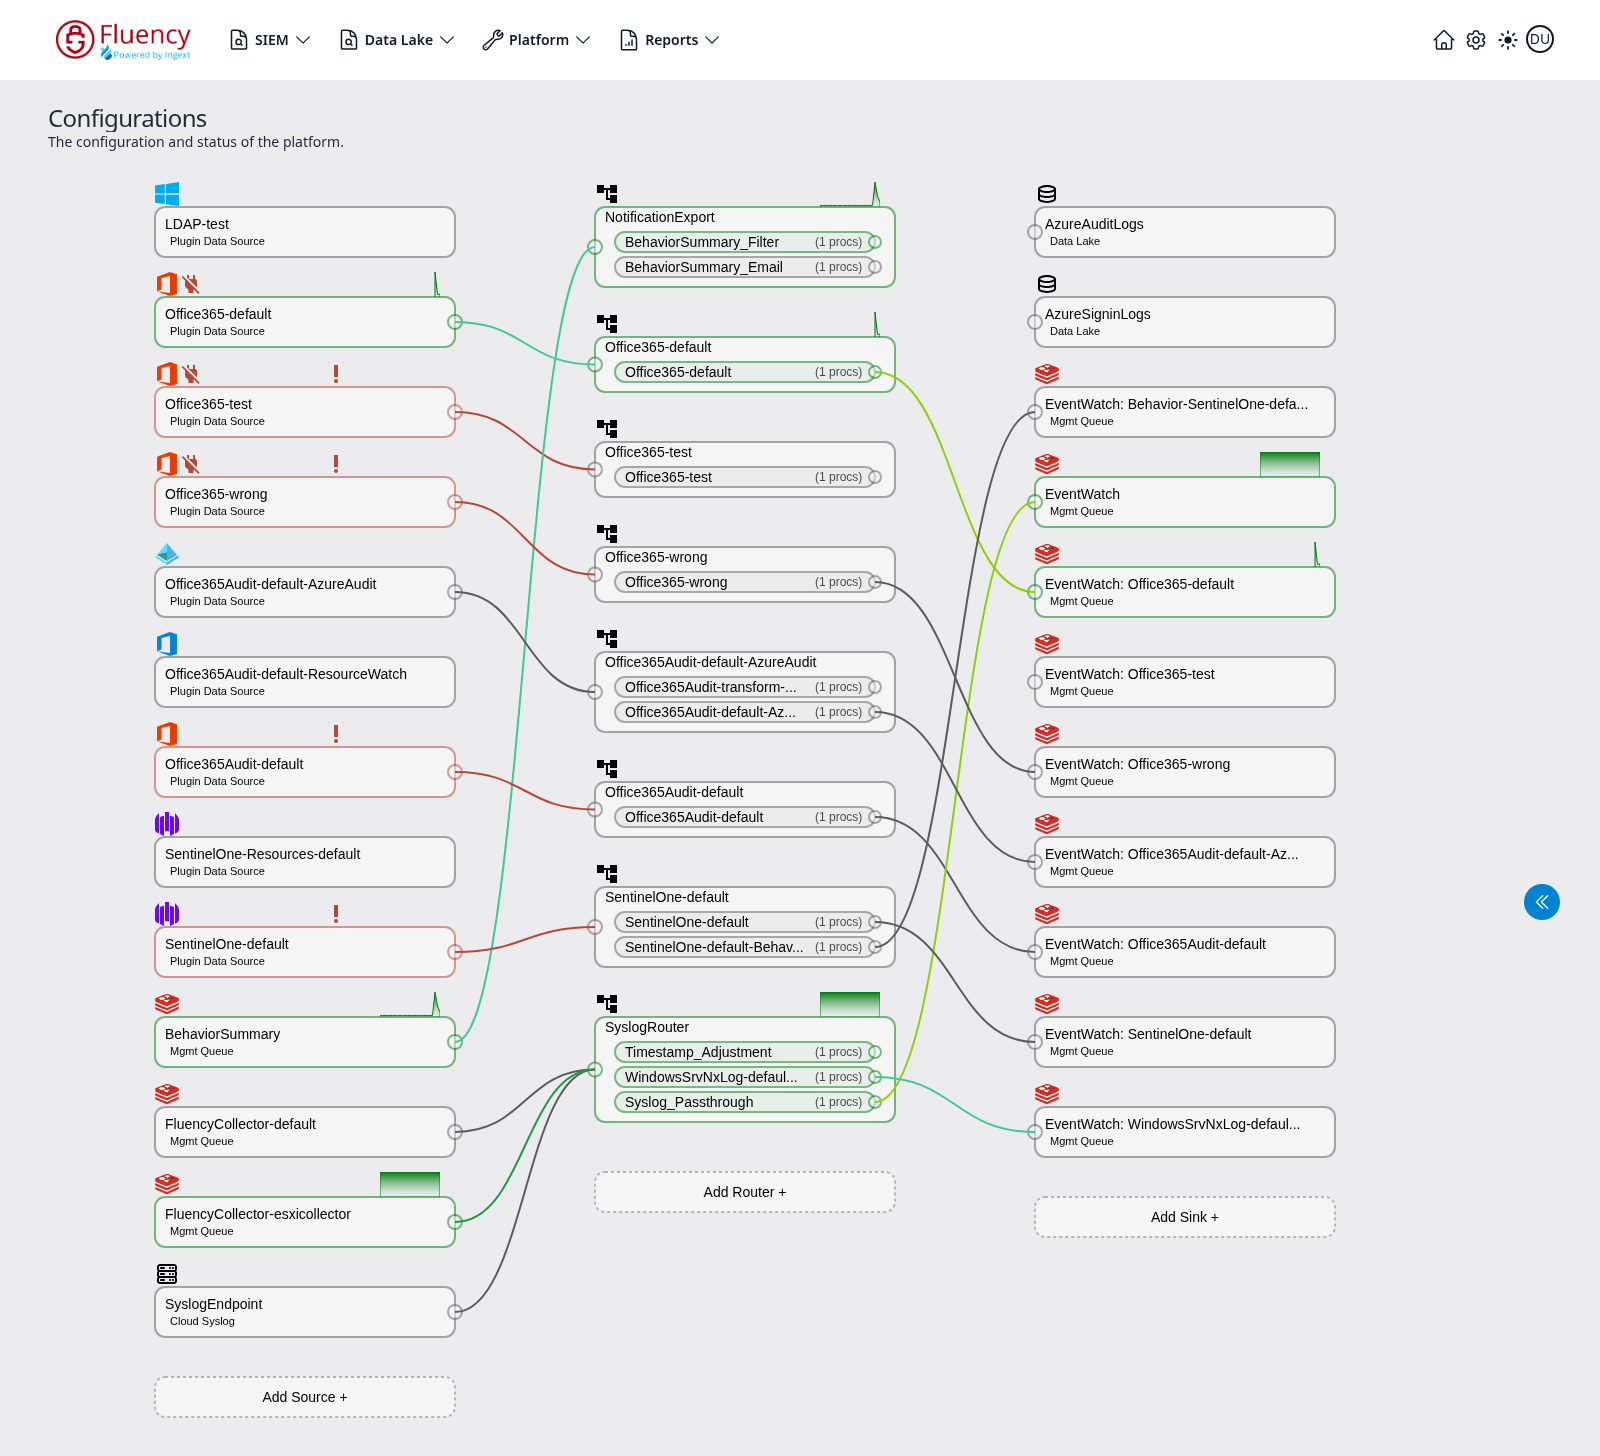
The Configuration page (titled Configurations on screen) is a live diagram of the data pipeline. It shows every source, router, and sink in the account, the processor pipes inside each router, the connections between them, and their current activity and health.
Menu path: Platform → Configuration · URL path: /platform/configuration
Page Layout
Under the page title and the subtitle The configuration and status of the platform., the diagram is arranged in three columns, read left to right in the direction data flows:
- Sources (left) — where data enters the pipeline.
- Routers (middle) — where processor pipes transform and route events.
- Sinks (right) — where processed data is delivered.
Each column ends with a dashed Add button for creating a new node of that type. A round double-chevron button floats in the lower-right corner of the page; it opens the status panel.
Node Status
A card's outline and the icons above it report its current state, so the health of the whole pipeline is readable at a glance:
- Green outline — actively moving data. A small green throughput graph sits above the card's upper-right corner.
- Gray outline — idle. No throughput graph.
- Red outline — in error. A red exclamation mark (!) appears above the card, and the connection lines leaving it are drawn in red.
A separate plug-with-slash icon may appear beside the type icon above a card, marking a node whose connection is disabled. It is independent of the error mark: a card can carry the plug-with-slash icon while still running green, and an errored card does not necessarily carry it.
Sources
Each source card shows the source name and a label for the transport that feeds it, with a type icon above the card — the vendor's own mark for plugin sources, so Office 365, SentinelOne, Azure, and Windows sources are distinguishable at a glance. The demo instance includes sources of these types:
- Plugin Data Source — data pulled by an installed application (Office 365, Office 365 Audit, SentinelOne, and LDAP instances in this capture).
- Mgmt Queue — internal management queues (a behavior summary feed and two collector queues in this capture).
- Cloud Syslog — a cloud syslog endpoint.
Click Add Source + at the bottom of the column to add a new source.
Routers
Each router card lists the pipes it runs. A pipe row shows the pipe name and its processor count, for example (1 procs). In this capture the routers include a notification-export router with filter and email pipes, one router per Office 365 and Office 365 Audit source, a SentinelOne router, and a syslog router with timestamp-adjustment, Windows-log, and passthrough pipes. Long pipe names are truncated with an ellipsis.
Click Add Router + at the bottom of the column to add a new router.
Sinks
Each sink card shows the sink name and its type label, with a type icon above the card. Two sink types appear in this capture:
- Data Lake — delivery into a data lake index, marked with a database icon (the Azure audit and sign-in log indexes here).
- Mgmt Queue — delivery into an internal queue, marked with a stacked-layers icon. These are the EventWatch sinks: one general EventWatch sink plus per-feed sinks for the individual routers.
Click Add Sink + at the bottom of the column to add a new sink.
Connections
Small circular ports sit on the edges of each card. Colored lines run from a source's output port to a router's input port, and from each router pipe's output port to a sink, tracing the exact path events take through the platform. Line colors distinguish the individual flows where several cross, and a line leaving an errored source is drawn in red.
Status Panel
The round double-chevron button in the lower-right corner opens a Home panel over the right-hand side of the page, holding a Status section with three time-series charts of the platform's overall throughput. Each chart shows its title, the unit Bytes (B), and the total for the window on the right.
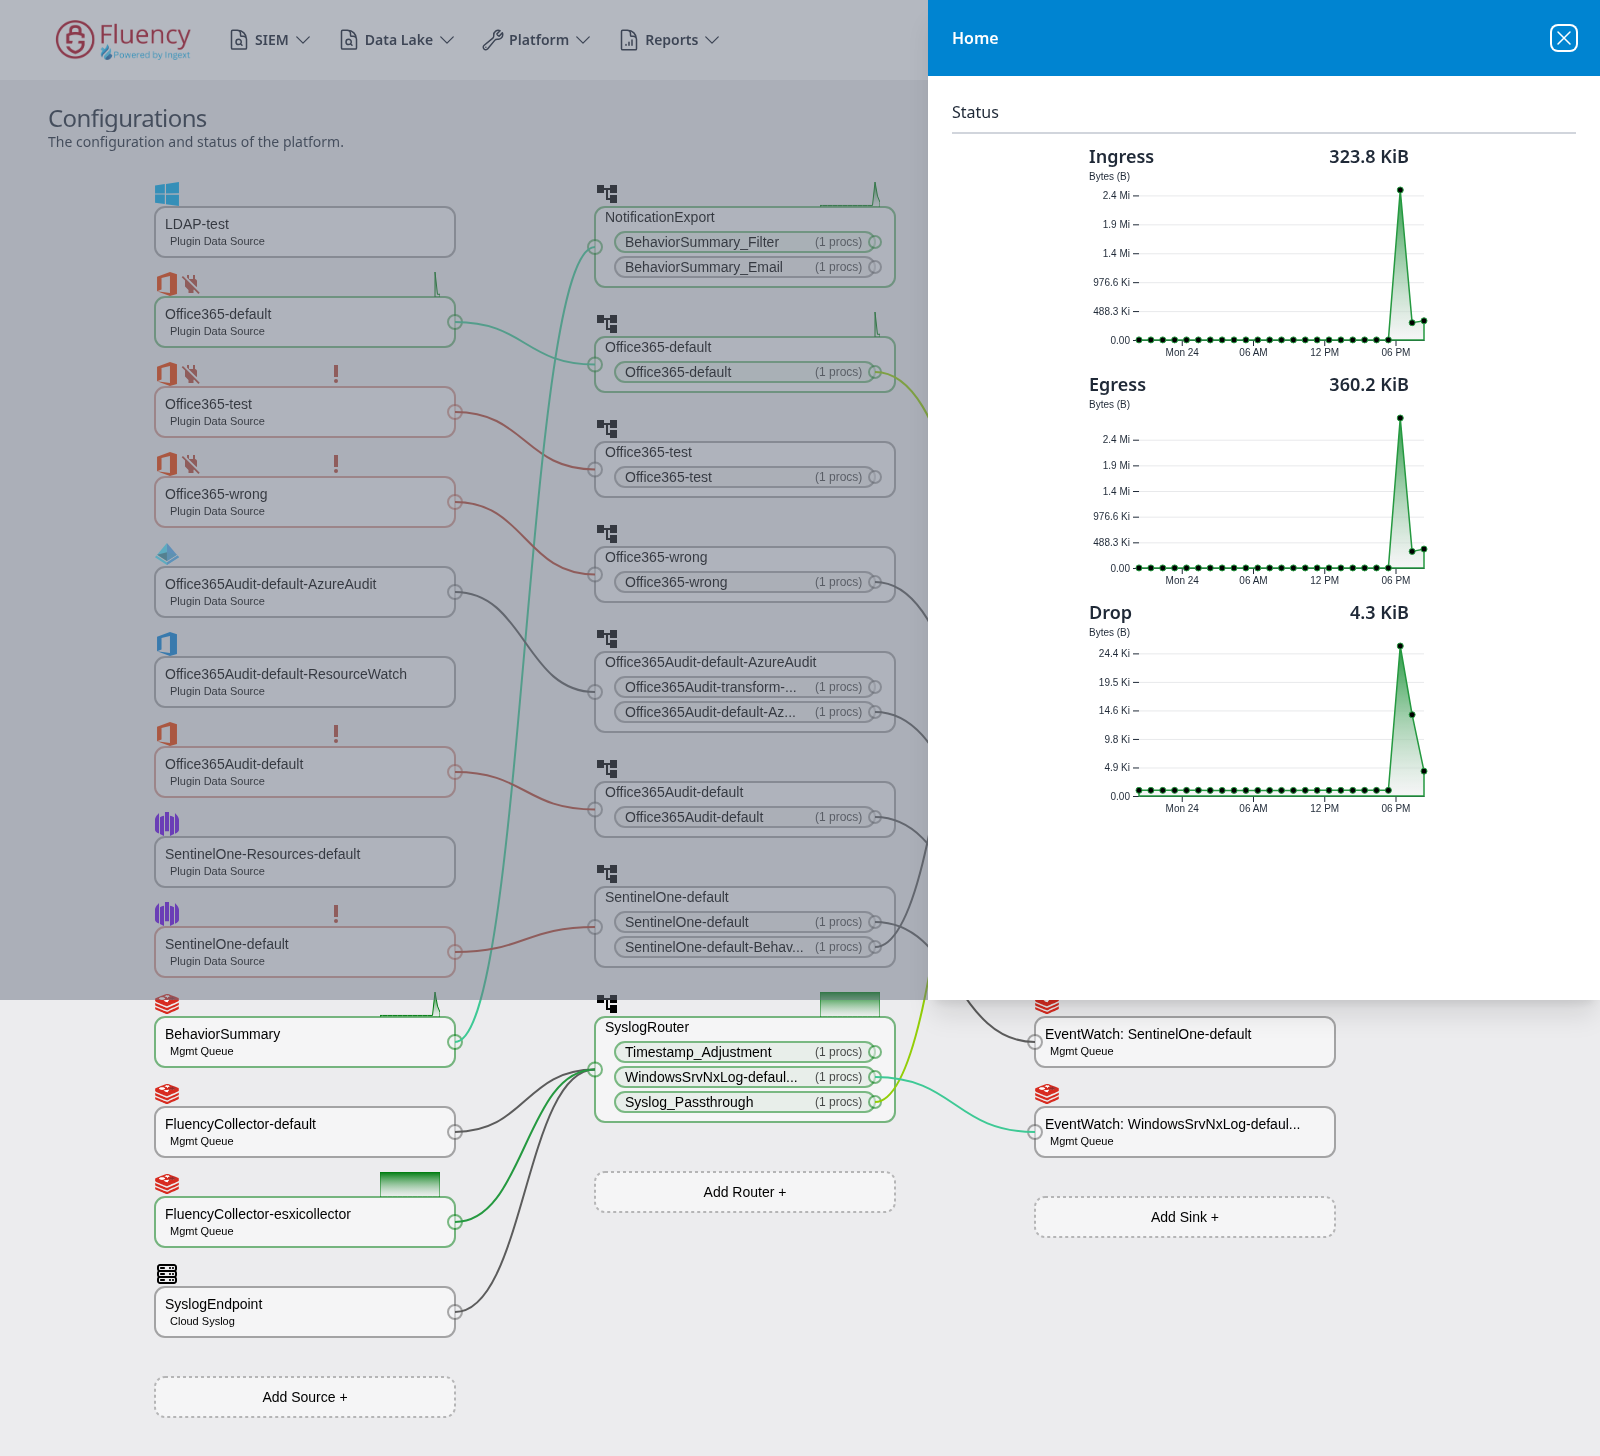
- Ingress — bytes entering the platform.
- Egress — bytes leaving it.
- Drop — bytes discarded.
Click the X in the panel's blue header bar to close it and return to the diagram.