Managing Collectors
The platform's own syslog listener protocols are managed separately, on Syslog Ports.
The Collectors page itself, control by control, is documented in the interface reference at Platform → Administration → Collectors, which is canonical for what the screen contains. This page covers which route to take and what the settings mean.
Adding a Collector
There are three ways a collector reaches the Collectors page, and they are not equivalent:
| Route | When to use it |
|---|---|
| Install the Fluency Collector template | The normal path for a new collector. Takes no parameters, and its details panel provides the Security token the appliance registers with — see Fluency Collector. |
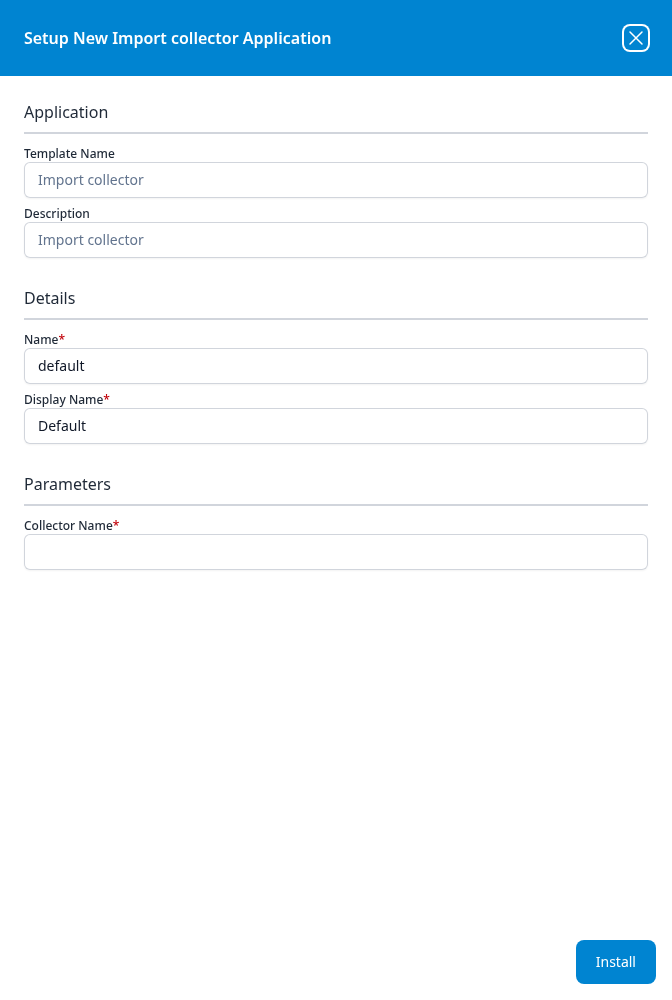
| Install the Import collector template | Brings an existing collector under an application, so it is connected to the pipeline like any other. Its single parameter is Collector Name. |
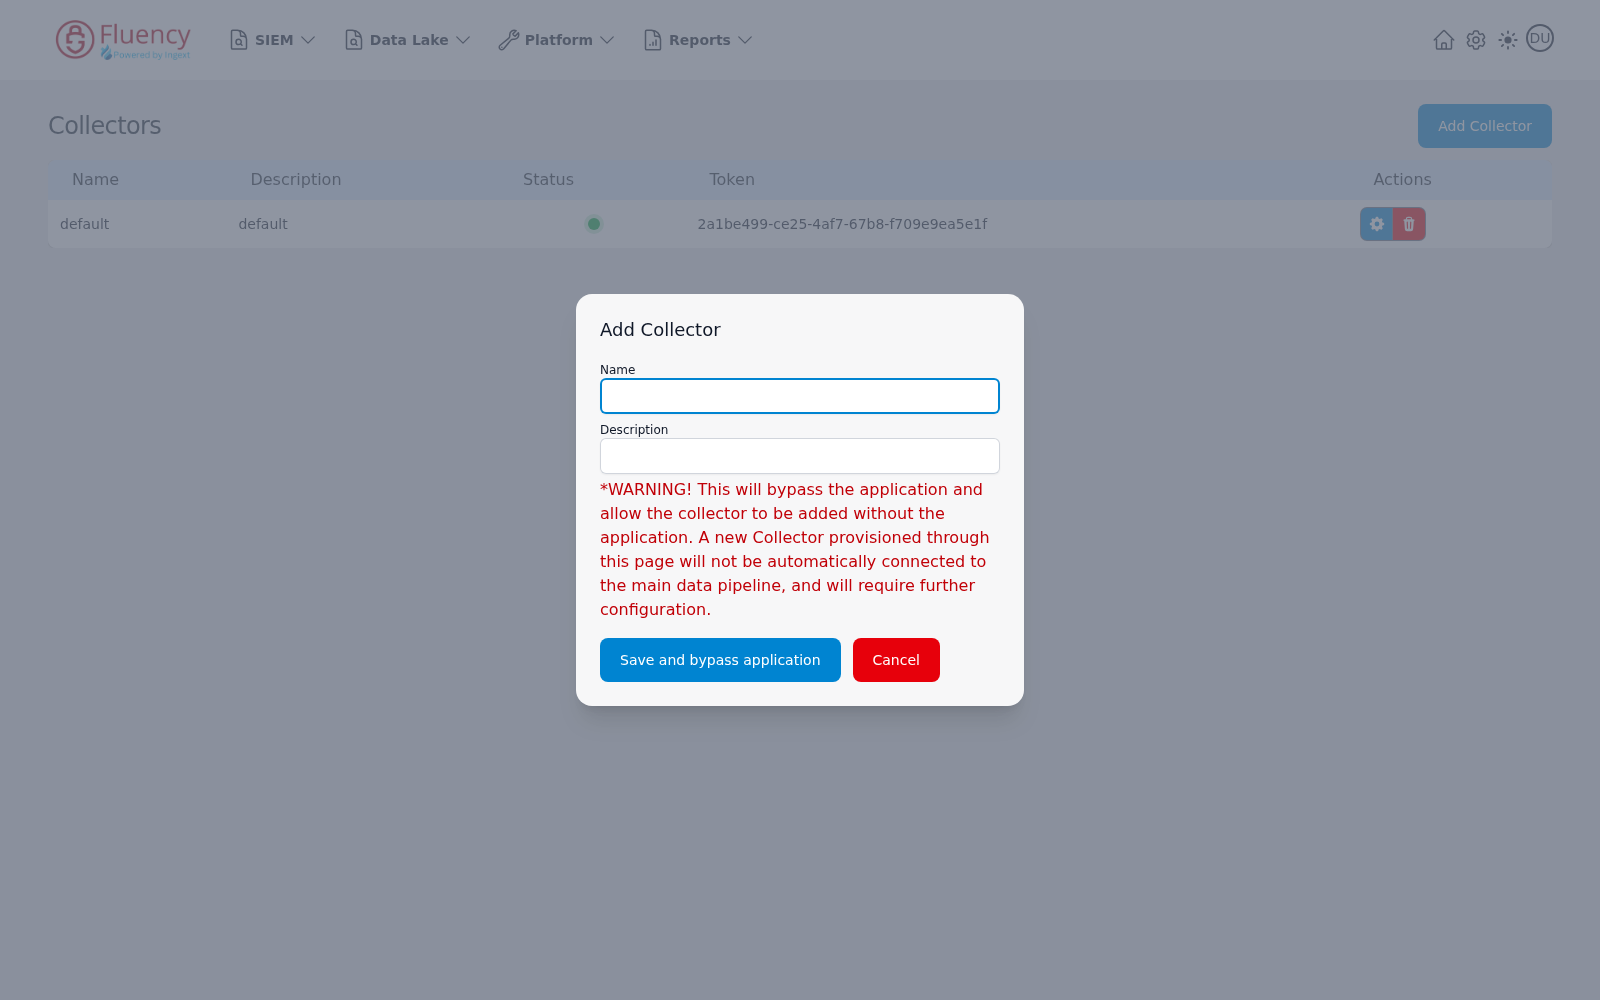
| Add Collector on the Collectors page | The manual route described below. The dialog itself warns that a collector added this way bypasses the application and is not automatically connected to the data pipeline. |
Both templates live under System Components in Platform → Applications → Install Application From Template:
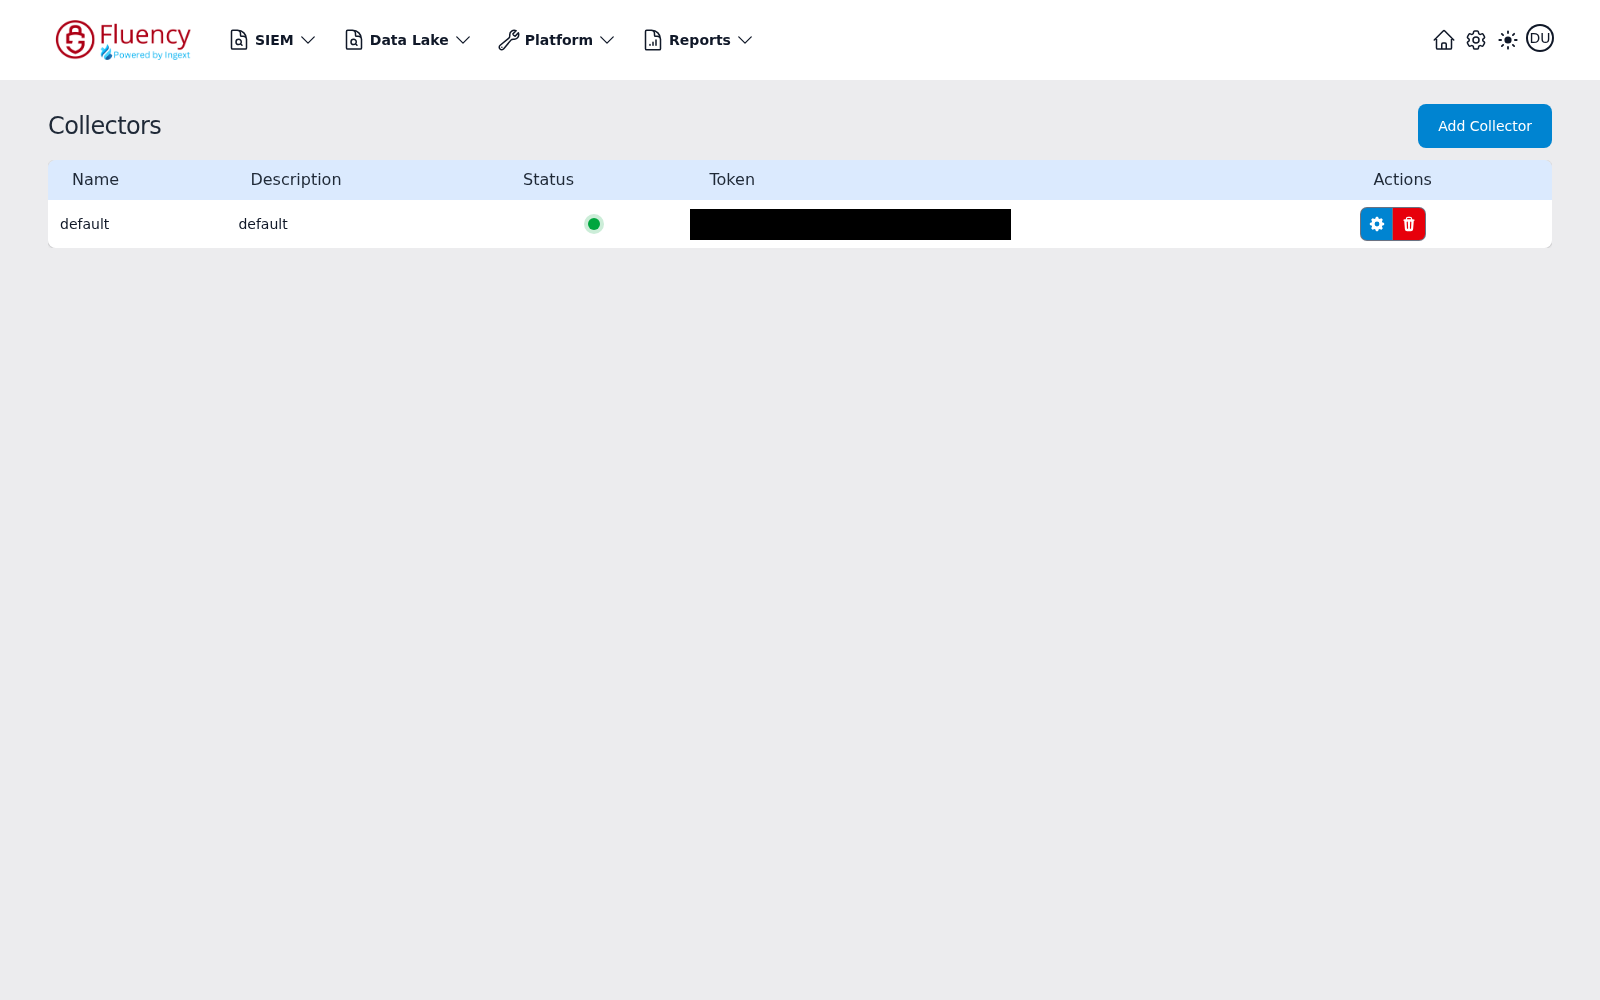
The Collectors page as it looks today. Platform → Administration → Collectors carries the Add Collector button in its header, and lists the registered collectors in a table with Name, Description, Status, Token, and Actions columns. Status is an indicator dot — green once the appliance is connected and reporting, grey until it checks in; Token is the collector's unique token.
Add Collector opens a dialog with two fields — Name and Description — above a warning in red text: a collector provisioned from this page is added without an application, is not automatically connected to the main data pipeline, and requires further configuration. The confirm button is labelled Save and bypass application; Cancel closes the dialog.
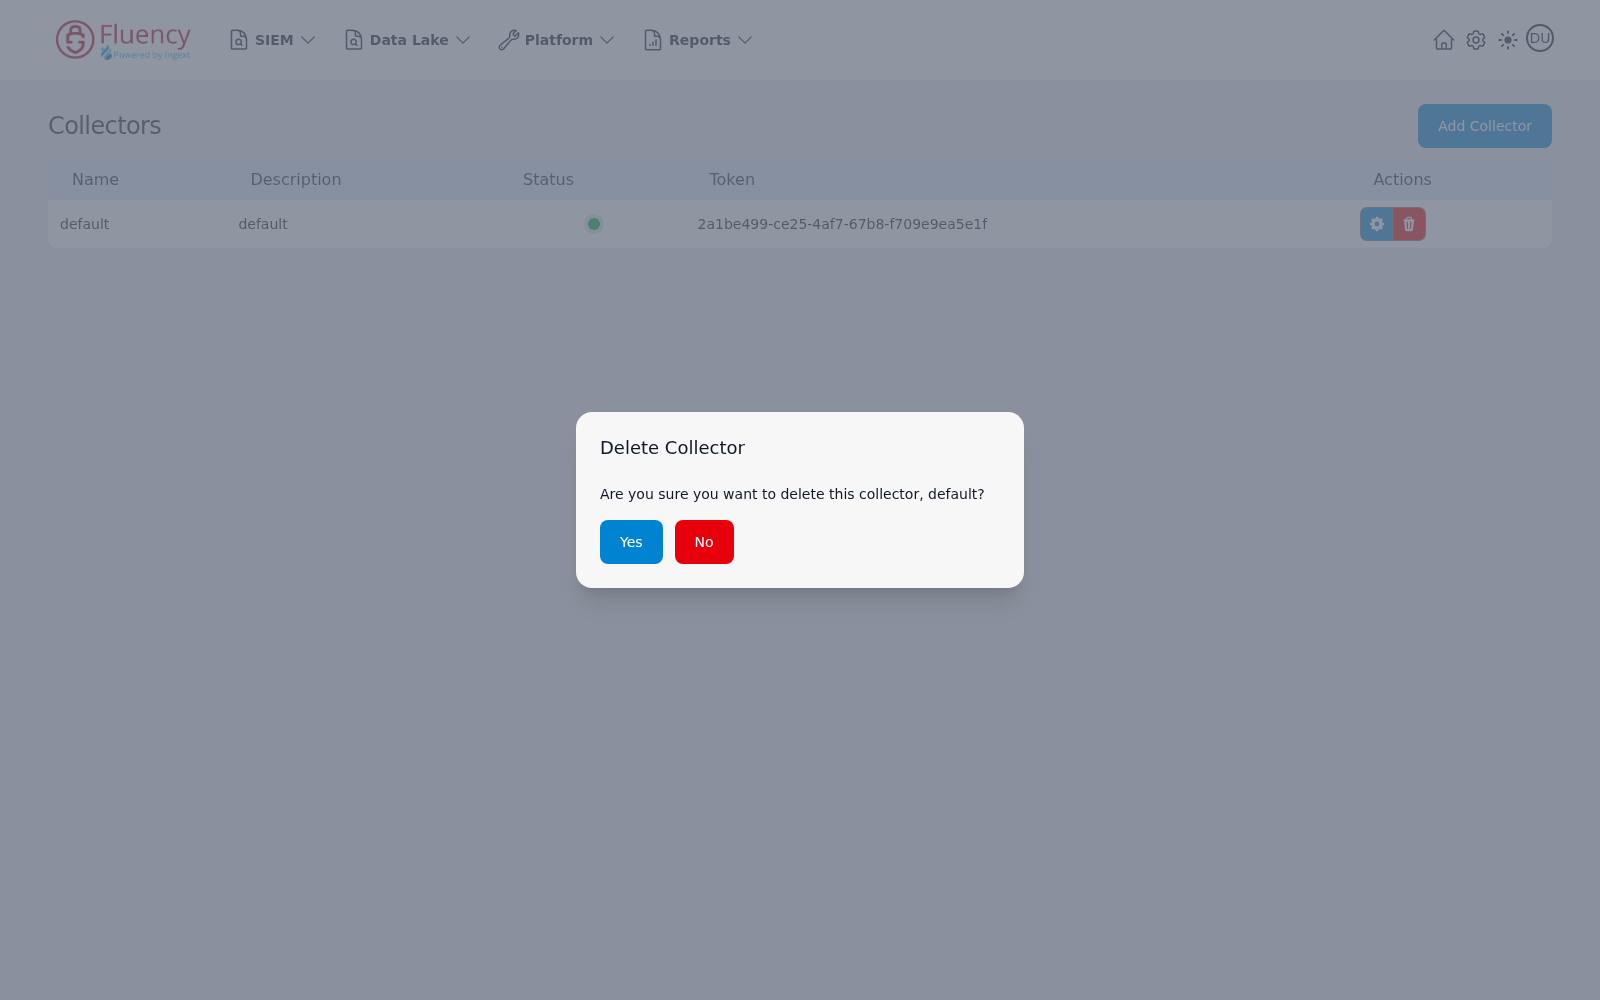
The Actions column holds two buttons: a blue gear that opens the collector's configuration, and a red trash. Clicking the trash opens the Delete Collector confirmation, which asks Are you sure you want to delete this collector followed by the collector's name — Yes deletes it, No keeps it.
Collector configuration
Event import on the collector side is configured per collector. Once the appliance is connected to the platform, open its settings from the Collectors page (Platform → Administration → Collectors) by clicking the blue gear button in that row's Actions column.
This opens Collector Configuration, headed by Collector name: and the collector's name, with three tabs: Syslog Ports, Network Settings and Management.
Syslog ports
The tab the configuration opens on. It lists the syslog listeners running on the collector appliance, with IP, Protocol, Port, Description and Actions columns.
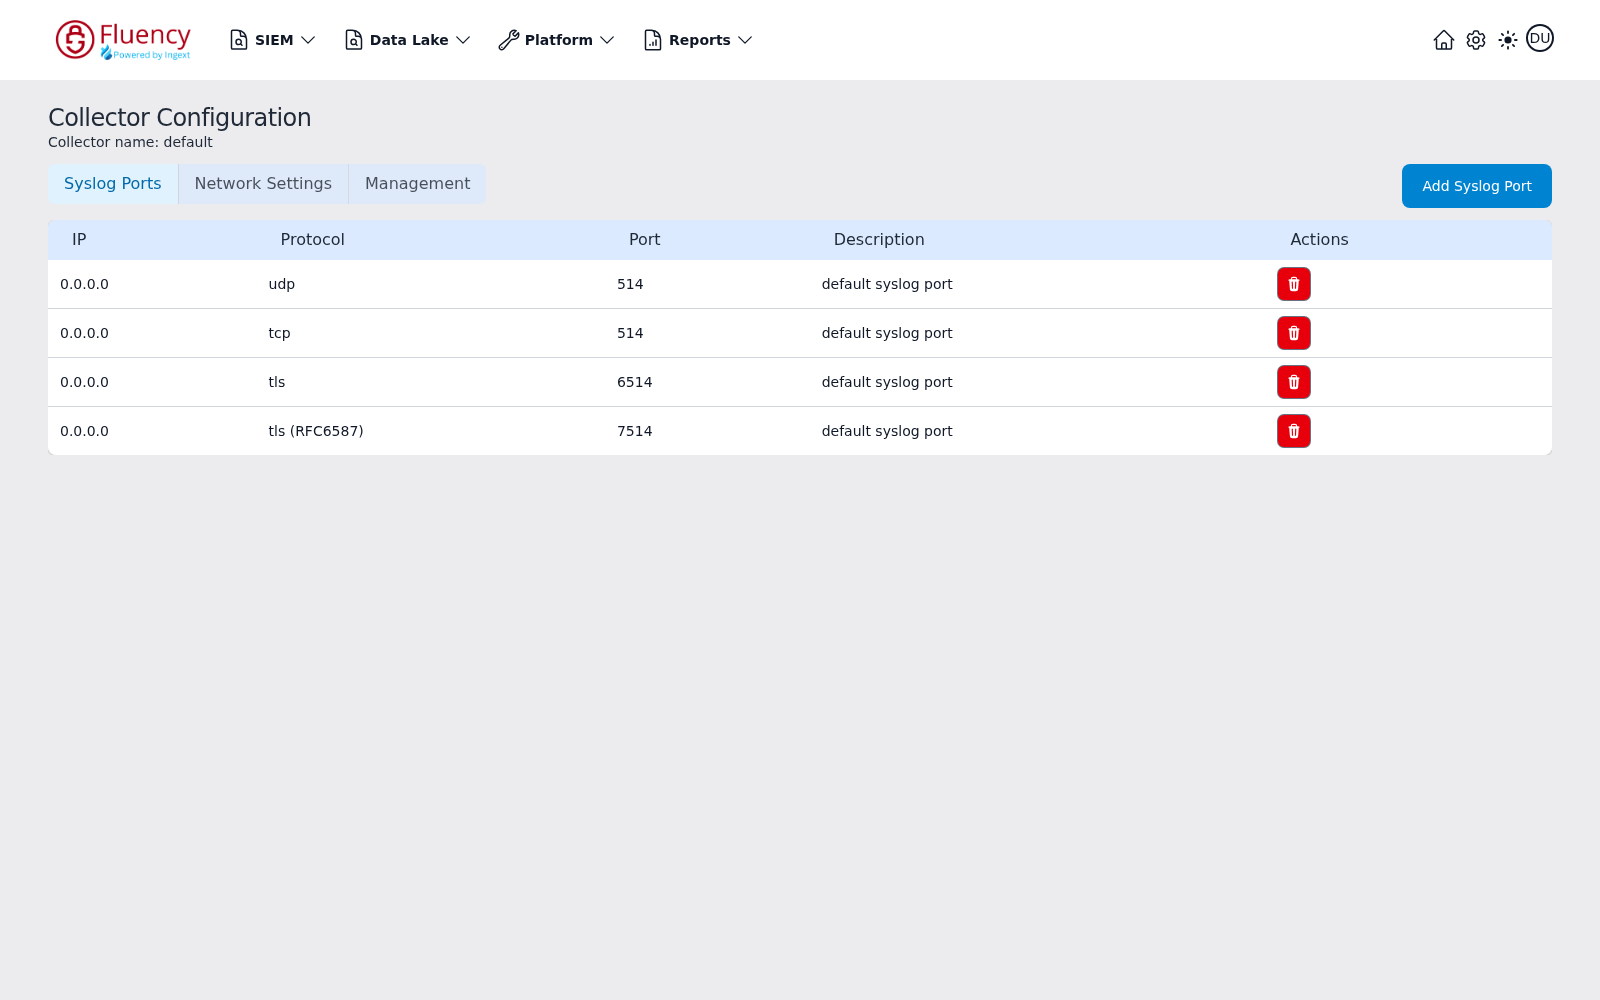
A default collector listens on four ports, all bound to 0.0.0.0:
| Protocol | Port |
|---|---|
udp | 514 |
tcp | 514 |
tls | 6514 |
tls (RFC6587) | 7514 |
To add a listener, click Add Syslog Port and fill in the Add Syslog Port Configuration dialog:
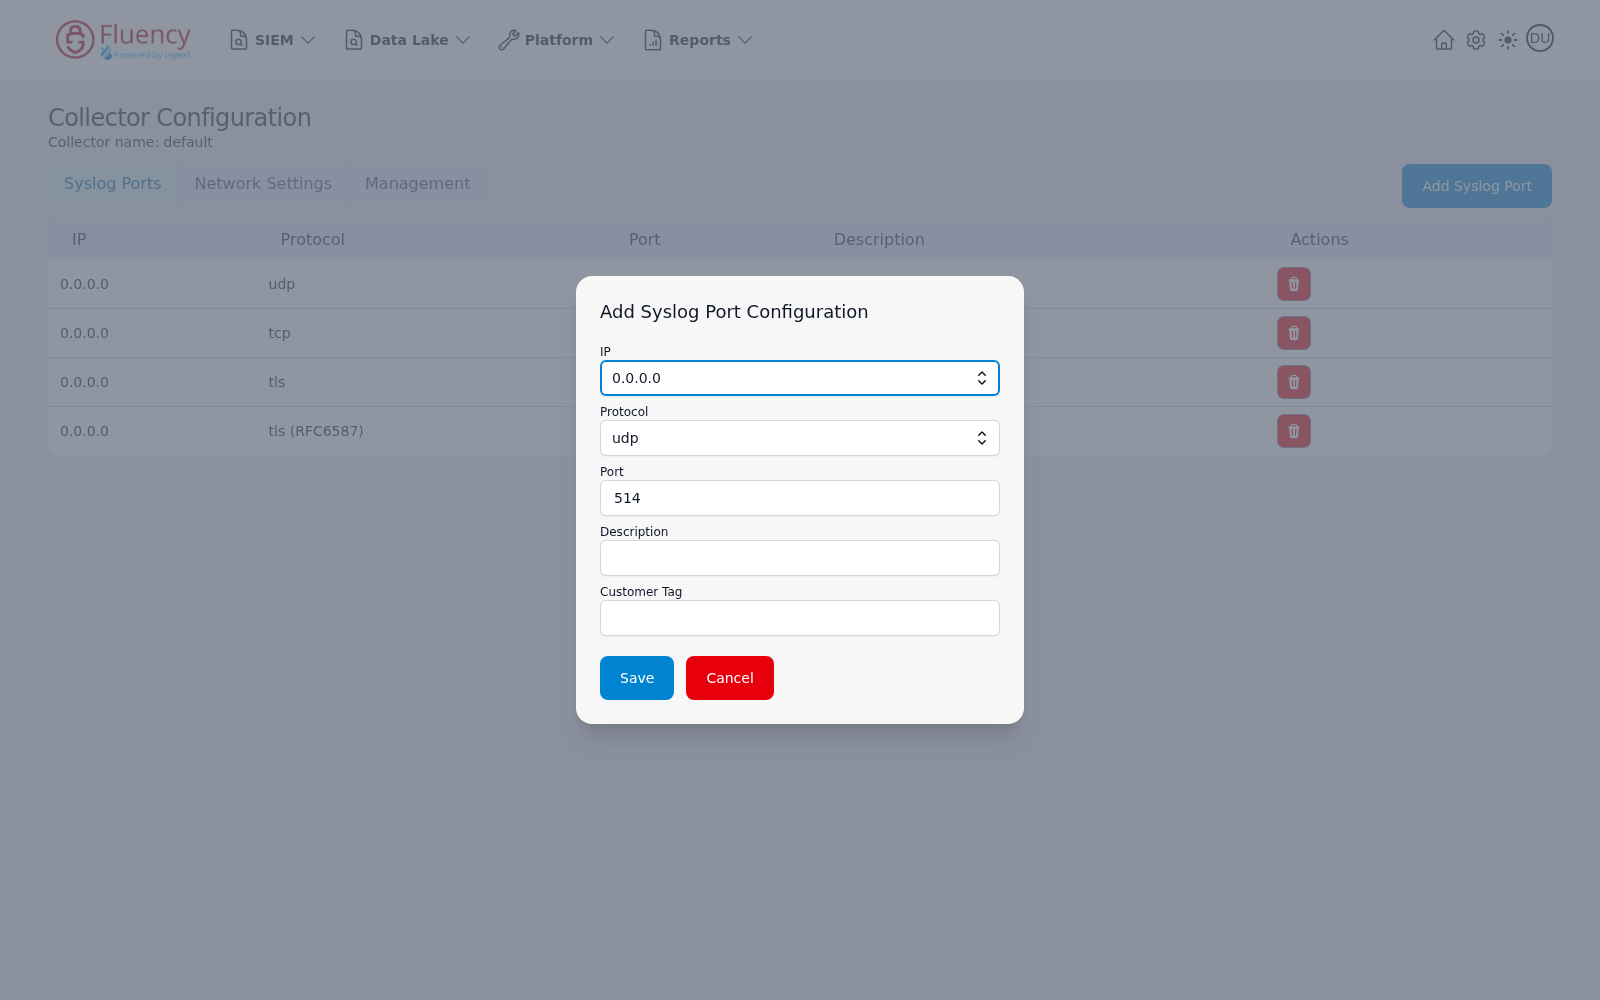
- IP — which address to bind to, defaulting to
0.0.0.0(all interfaces). - Protocol — the listener protocol, defaulting to
udp. - Port — the listening port, prefilled with
514. - Description — free text identifying the listener.
- Customer Tag — an optional tag applied to records arriving on this port, used to attribute them to a customer.
Click Save to create it. Repeat for each additional listener.
A listener's red trash button removes it, after a Delete Syslog Port confirmation that names the protocol and port being removed.
Note: the Fluency appliance can accept and parse a variety of input formats within the syslog protocol. Your device may already produce a format Fluency understands — when exporting, choose JSON (preferred) or CEF where the option exists.
These are the syslog listener ports on the collector appliance. For the platform-side syslog endpoint, see Syslog Ports.
Supported Protocols
Several protocols are supported for Syslog input:
- UDP - standard, default protocol w/o encryption
- TCP - standard, default protocol w/o encryption
- TLS - standard protocol w/ encryption, certificate file (provided) may be required
- TLS (RFC6587) - alternative protocol w/ encryption, may be needed for certain data sources, such as FortiGate NGFW devices certificate file (provided) may be required
Network settings
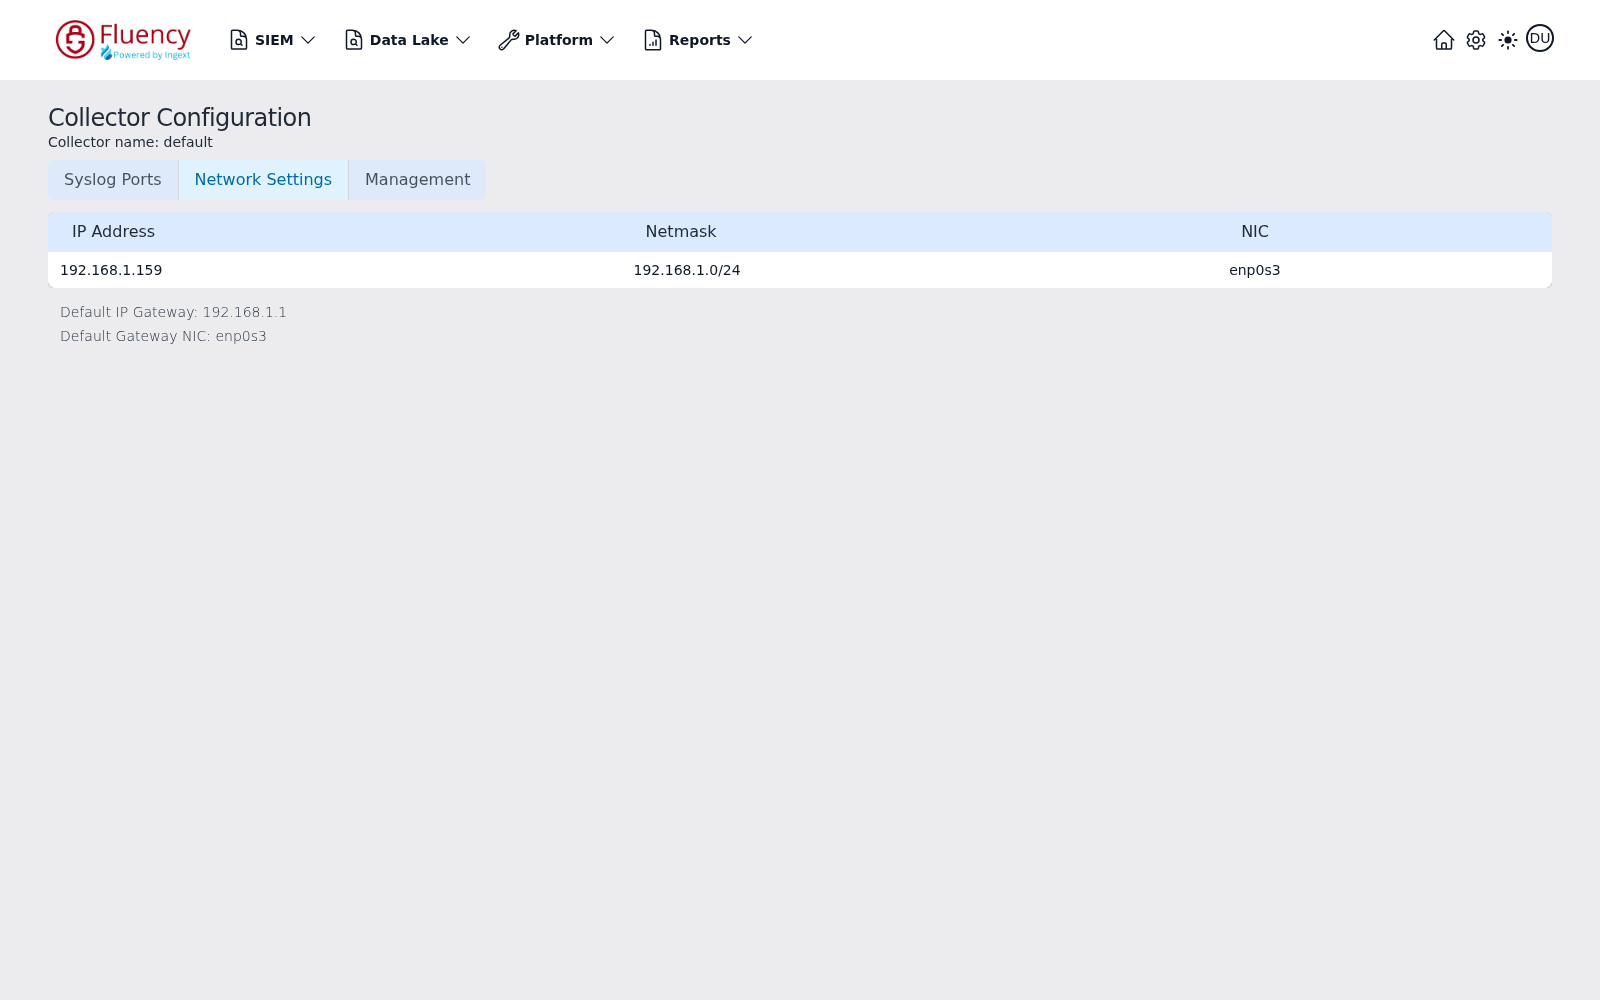
A read-only view of the appliance's network configuration: a table of interfaces with IP Address, Netmask and NIC, and beneath it the Default IP Gateway and Default Gateway NIC. Use it to confirm the address senders should point at.
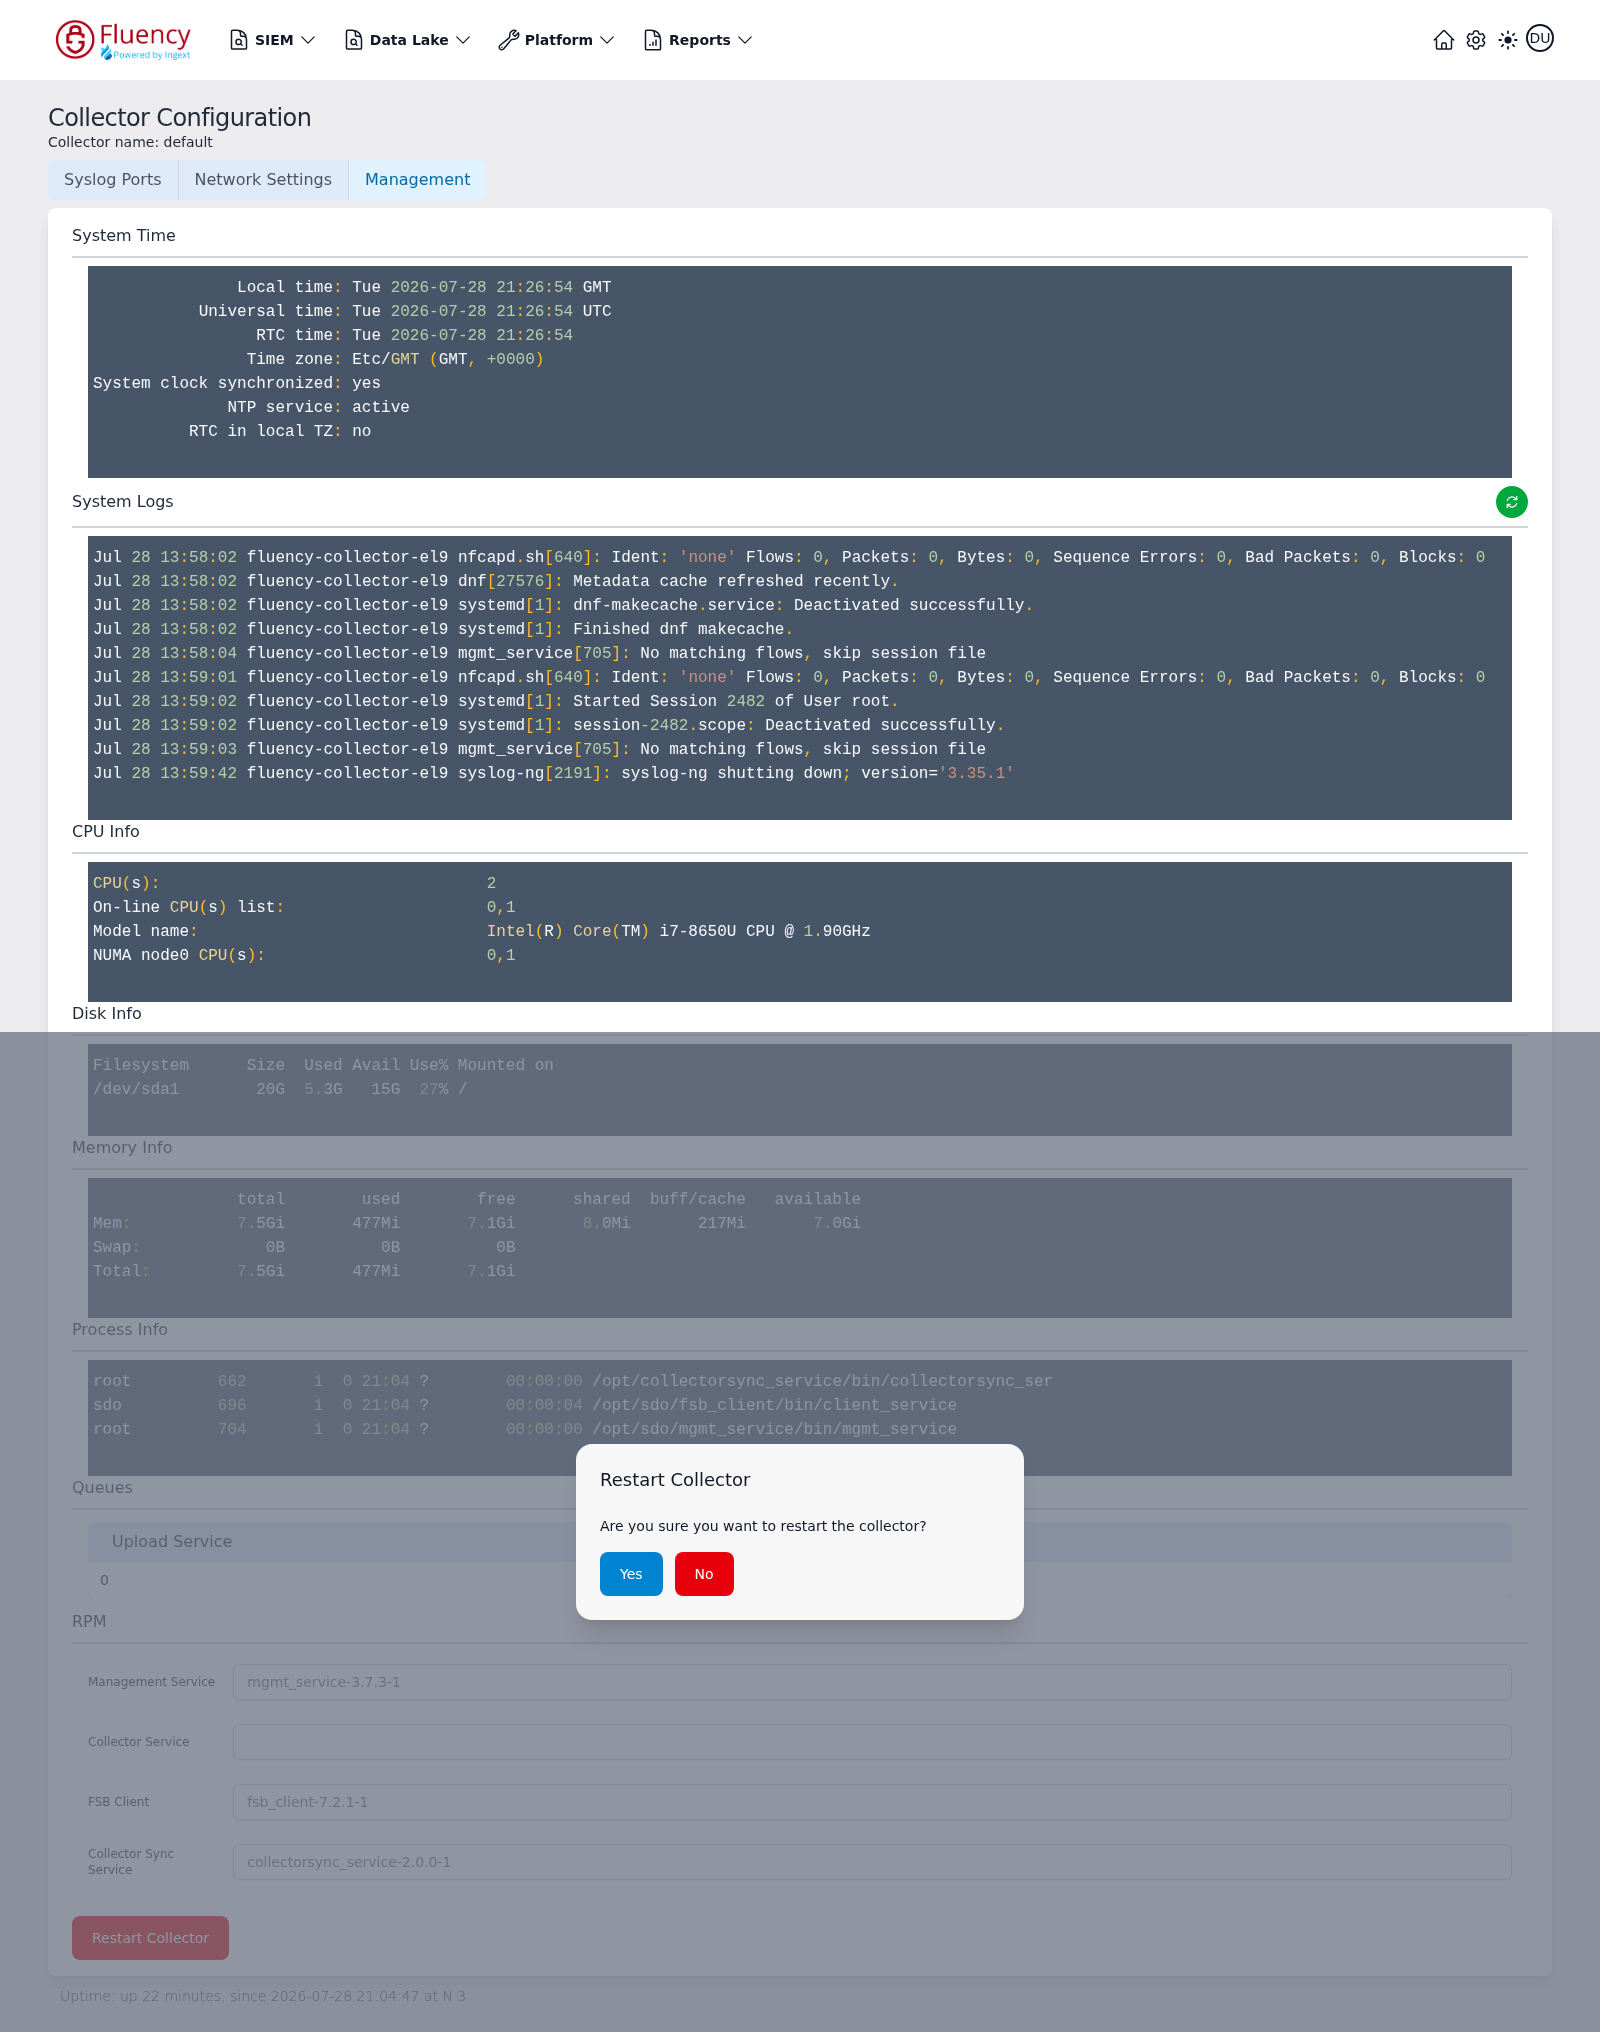
Management
The appliance's health and diagnostics, and the first place to look when a collector stops delivering data.
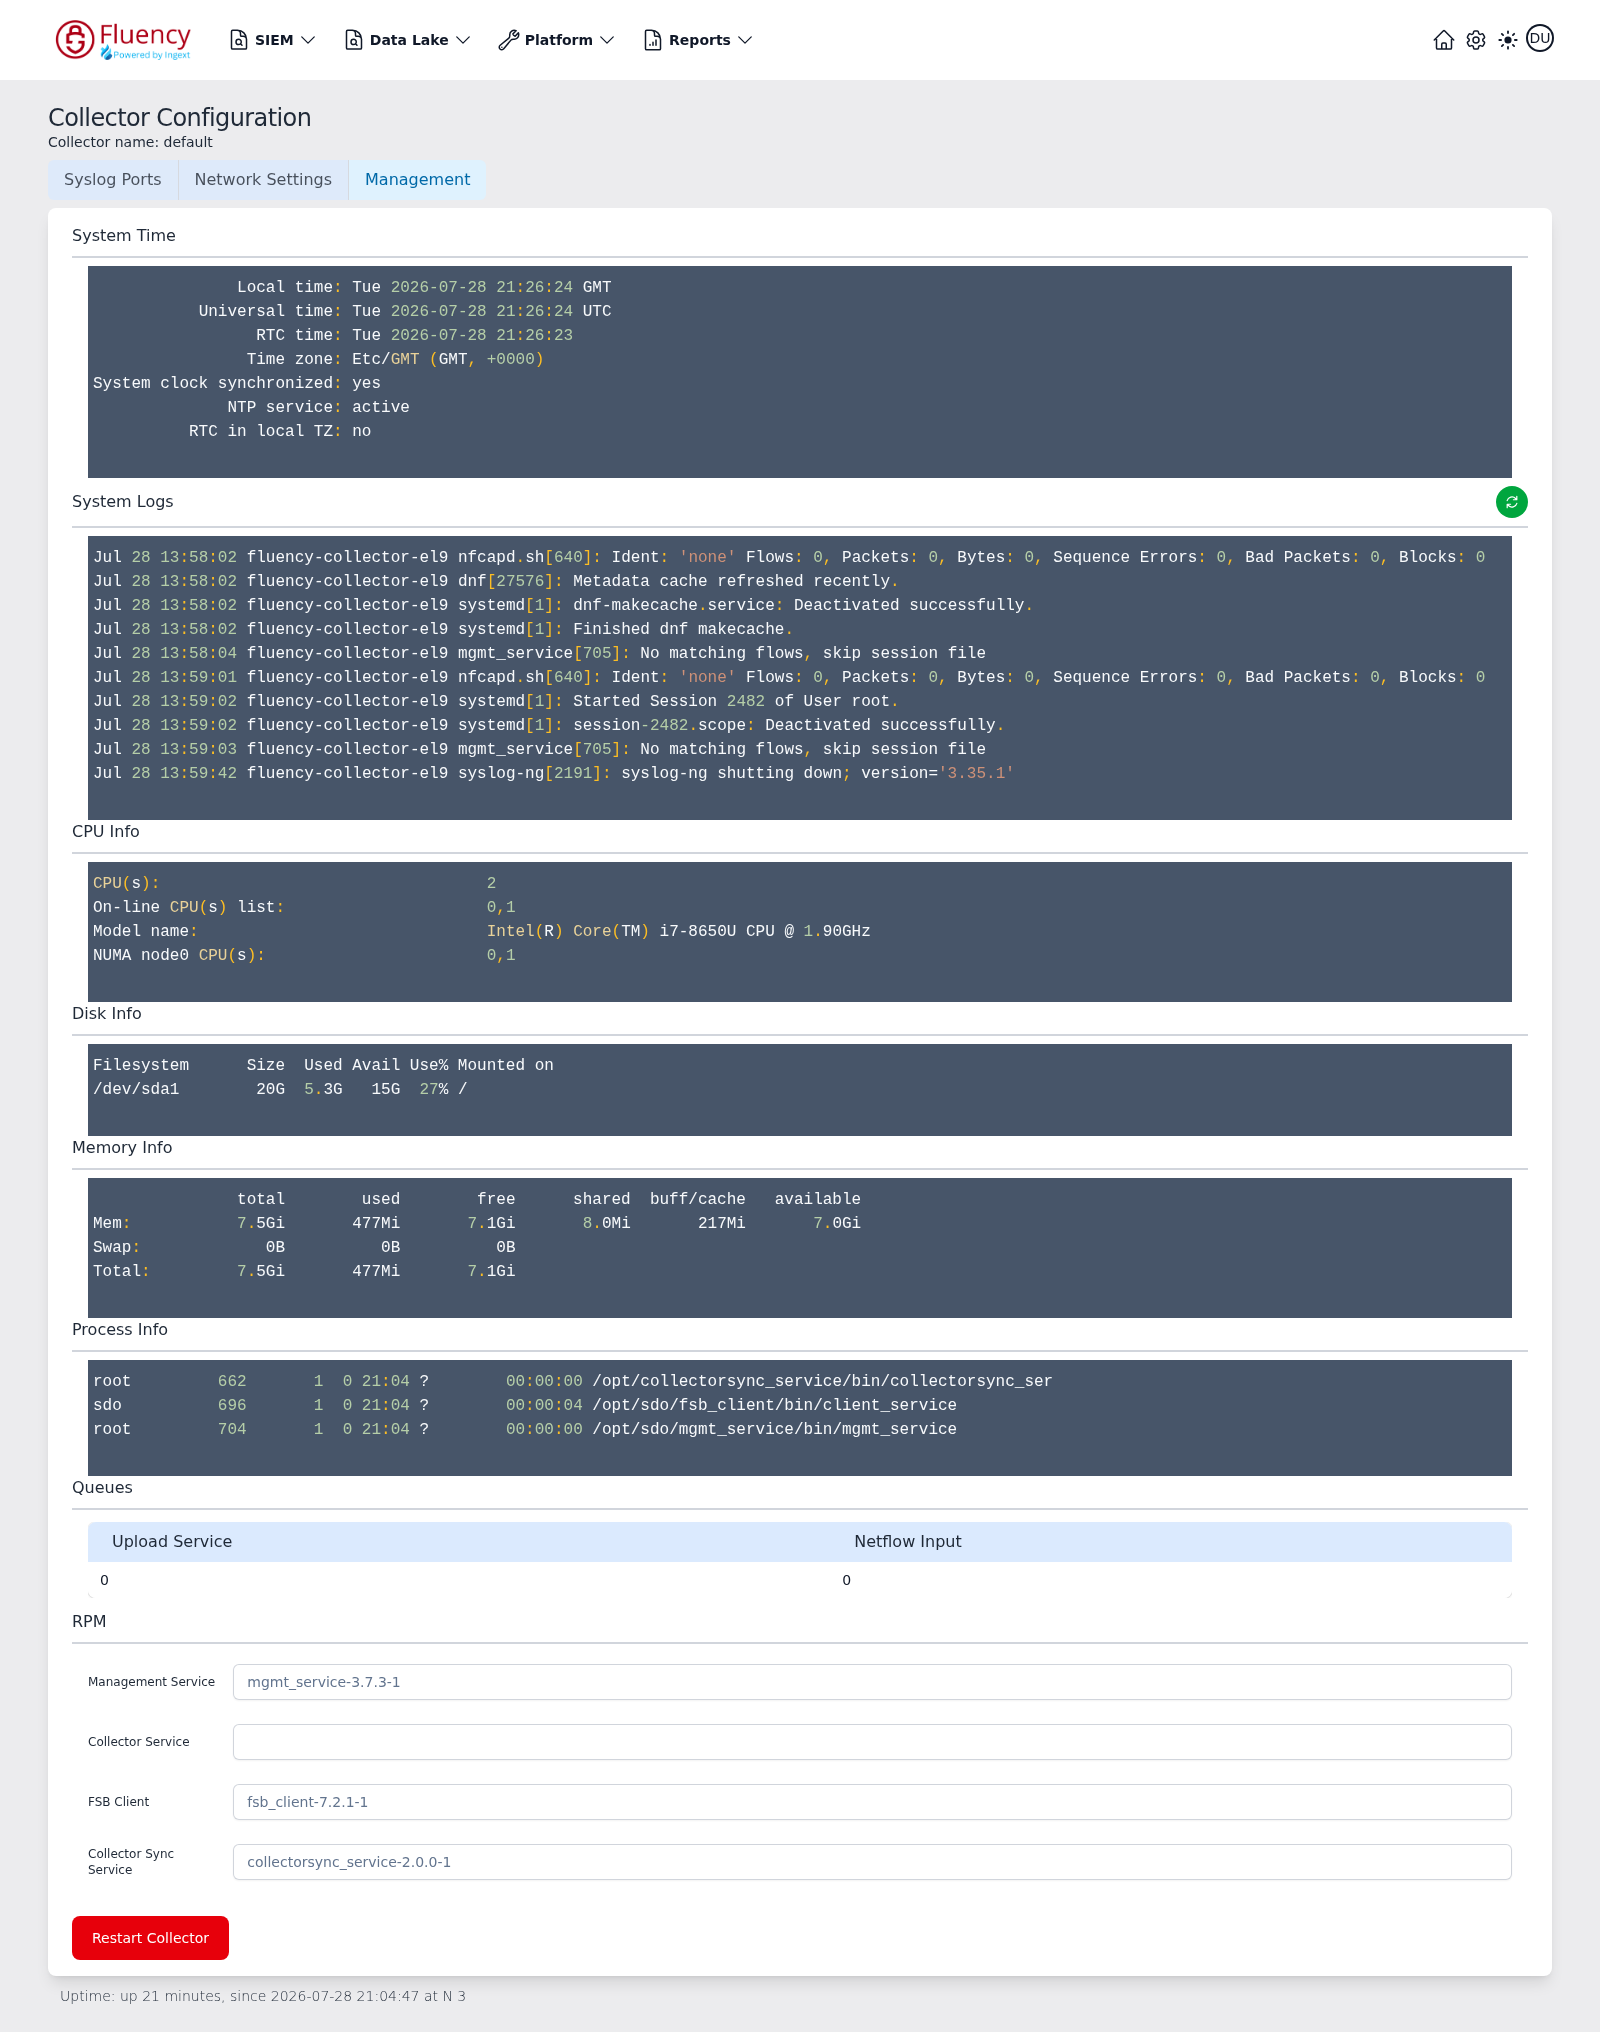
The tab stacks read-only panels covering System Time (including whether the clock is synchronized and NTP is active), a tail of the appliance's System Logs with a green refresh button, CPU, Disk, Memory and Process Info, the Queues depth for the upload and netflow inputs, and the installed RPM version of each collector component. A footer reports uptime.
Two checks are worth knowing:
- Queues should sit at zero. A rising Upload Service count means the collector is receiving data but cannot ship it to the platform.
- System Time should show the clock synchronized and NTP active. An unsynchronized collector clock is a common cause of records arriving with wrong timestamps — see Time Adjustment.
The red Restart Collector button at the bottom restarts the collector's services after a confirmation. Data arriving during the restart is not received, so prefer a maintenance window.
Demo
An interactive demo of adding a collector is available here: Adding a Collector (Storylane)