Audit Logs
The Audit Logs page is the record of what users and API clients have done in the Fluency portal: sign-ins, token requests, and administrative changes such as adding or deleting a user. It combines a full-text search, a panel of facet filters, and a paged table of records, each of which opens into a detail panel.
Menu path: Admin console → Management → Audit Logs · URL path: /v2/admin/audit
Task guide: Audit: what actions are recorded, and how to review administrative activity.
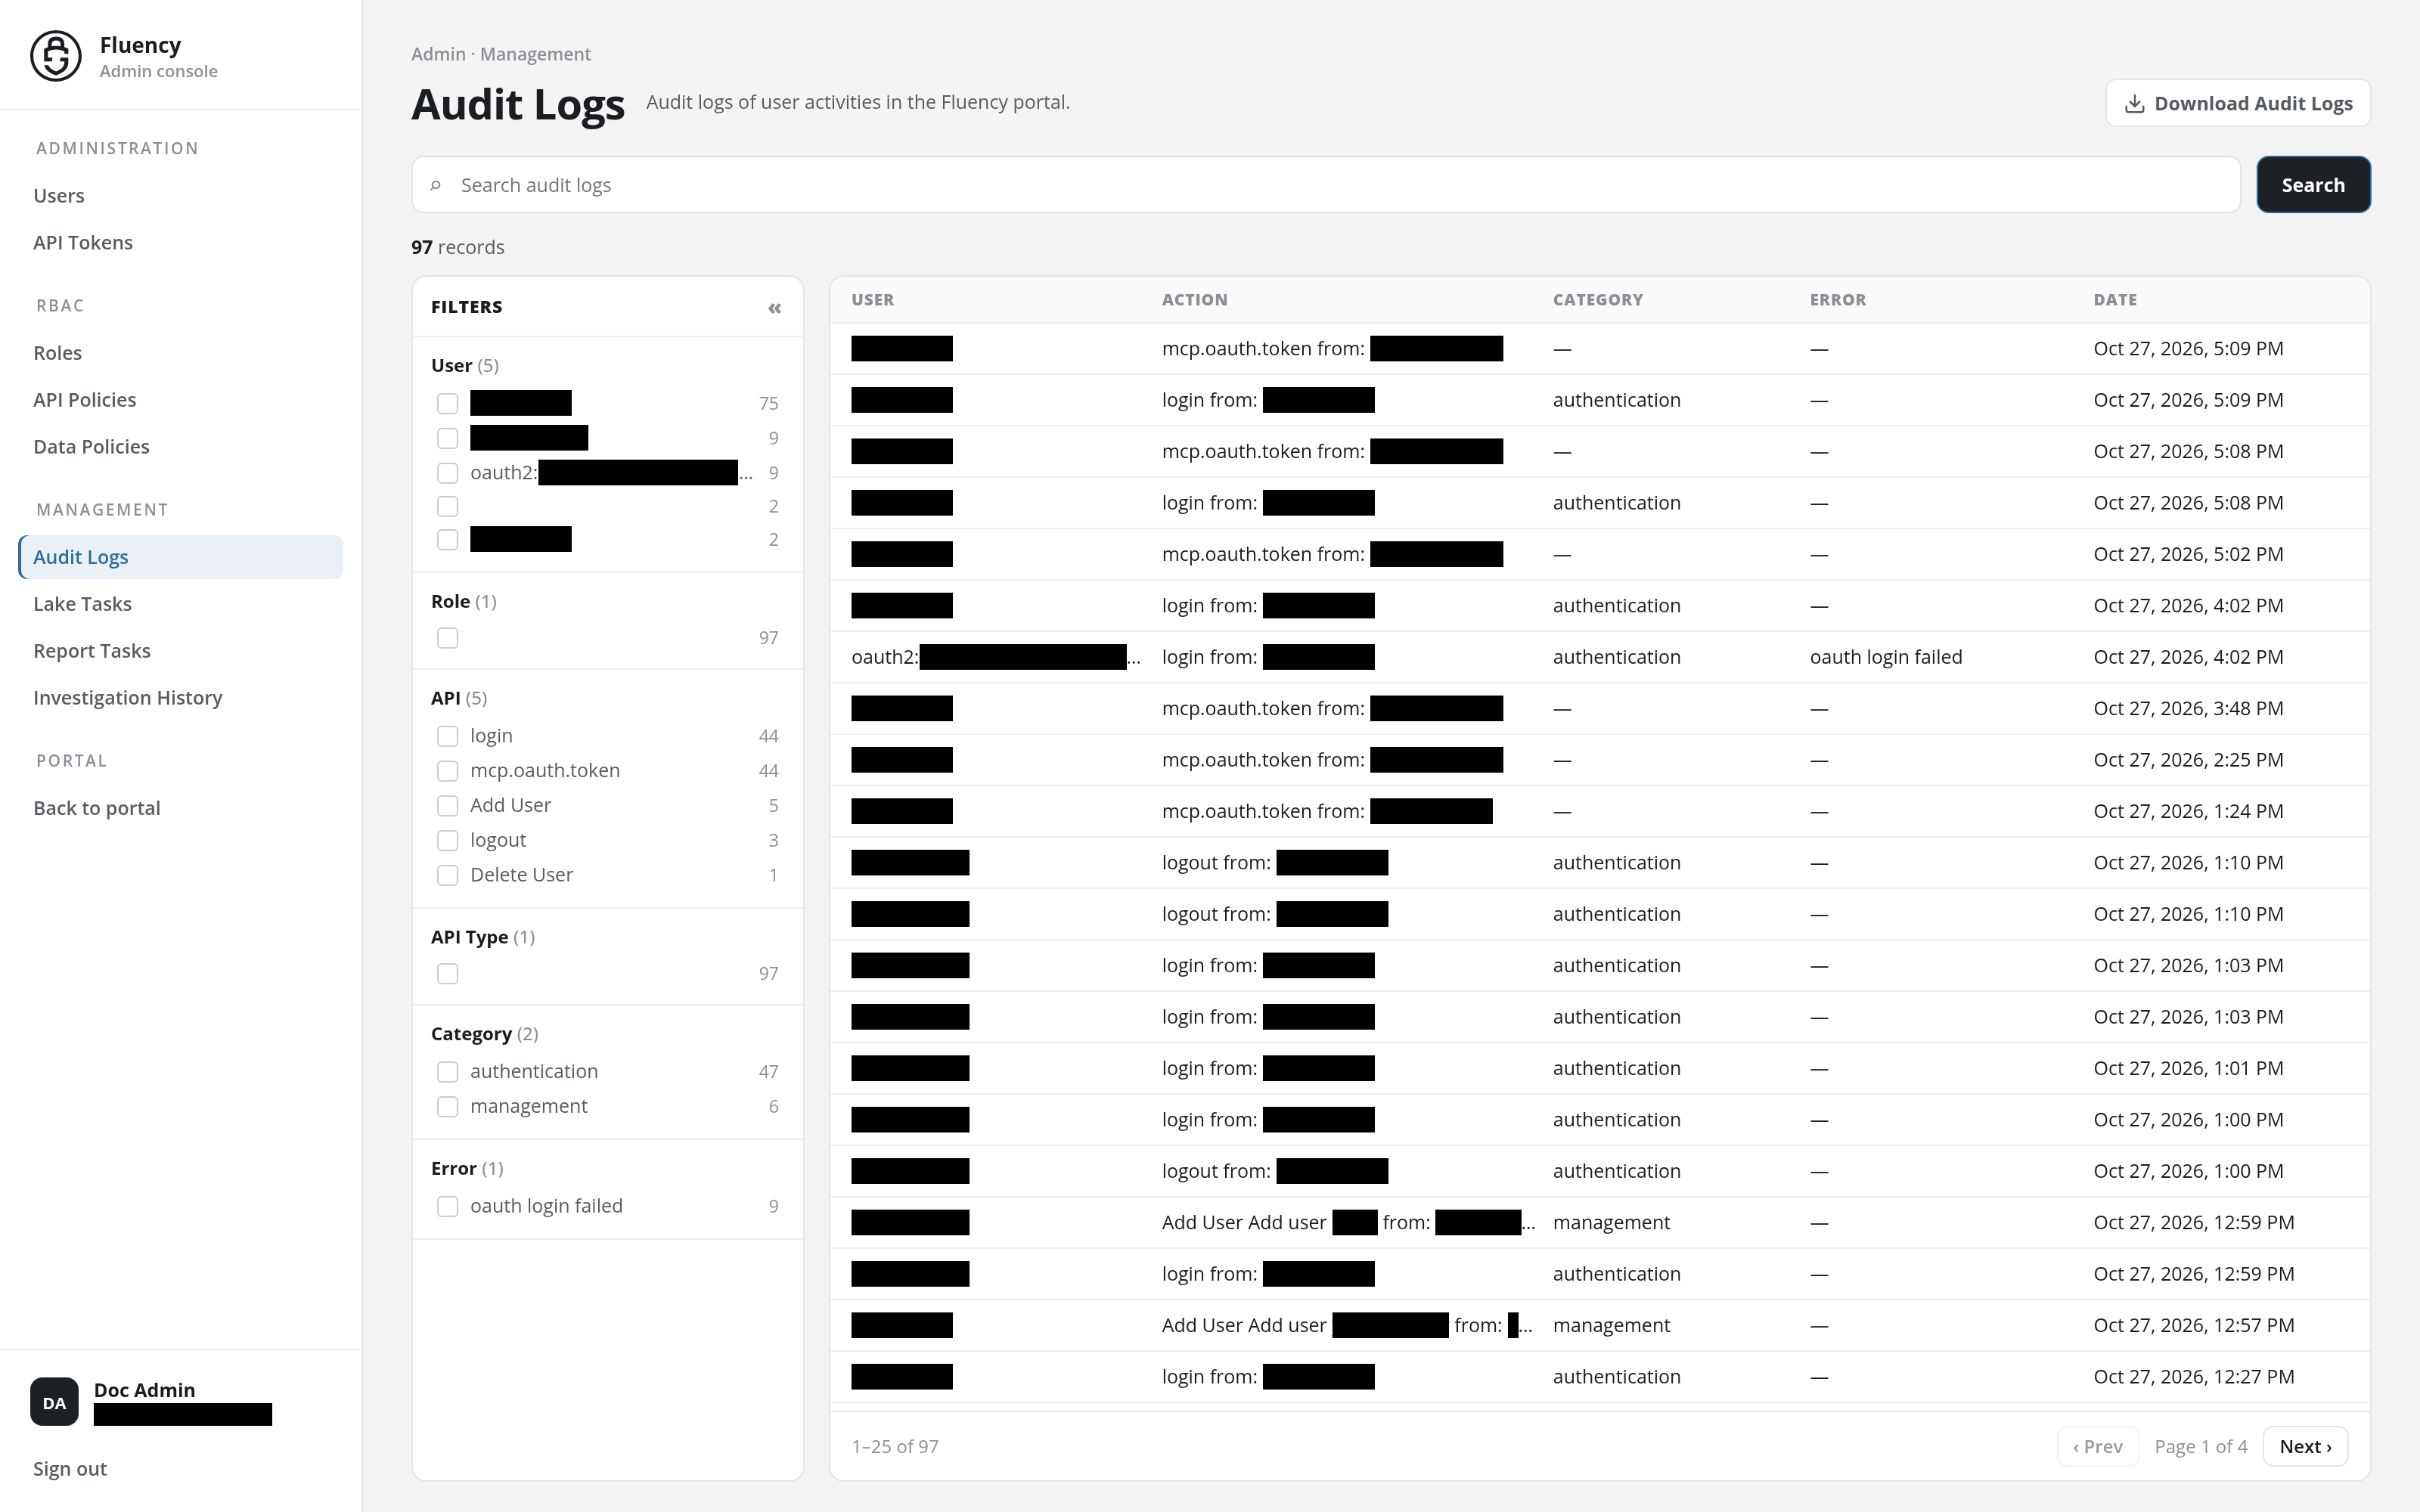
Page Layout
The page sits in the Admin console, with Audit Logs highlighted under Management in the side navigation.
- Header: the breadcrumb Admin · Management, the title Audit Logs with the subtitle Audit logs of user activities in the Fluency portal., and the Download Audit Logs button on the right.
- Search bar: a Search audit logs field with a Search button.
- Record count: the number of records that match the current search and filters, such as 50 records.
- Filters panel (left): facet groups for narrowing the records.
- Records table (right): one row per audit record, newest first, with a pager along its bottom edge.
Download Audit Logs
Click Download Audit Logs in the upper-right corner to download the audit log as a file.
The browser saves it as audit- followed by the date and time of the download and .txt. The file holds one JSON record per line, one line per audit record, with the fields username, email, role, clientIP, country, city, createdOn (the time, in milliseconds since 1970), dur, category, action, action_type, action_info, and data.
Search
Type in the Search audit logs field and click Search to narrow the records to those matching the text. The record count, the filter counts, and the table all follow the search.
Filters Panel
The Filters panel lists one group per audit field. Each group's heading carries, in parentheses, the number of distinct values it lists, and each value has a checkbox and the number of matching records:
| Group | What it narrows by |
|---|---|
| User | The user or API identity that performed the action. |
| Role | The role it acted under. |
| API | The action, such as login, mcp.oauth.token, Add User, or Delete User. |
| API Type | The kind of API call. |
| Category | The action's category, such as authentication or management. |
| Error | The error the action ended with, such as oauth login failed. |
Each click on a value moves it through three states:
- Included: the first click. The value's checkbox is checked, and the records narrow to those with that value.
- Excluded: the second click. The value is marked −, and the records narrow to those without that value.
- Cleared: the third click removes the filter again.
As the records narrow, the record count and the table follow, and the other groups recount (and drop the values that no longer occur) for what is left. A group left with no values reads No values in this window. Filters in different groups combine: every record shown matches all of them.
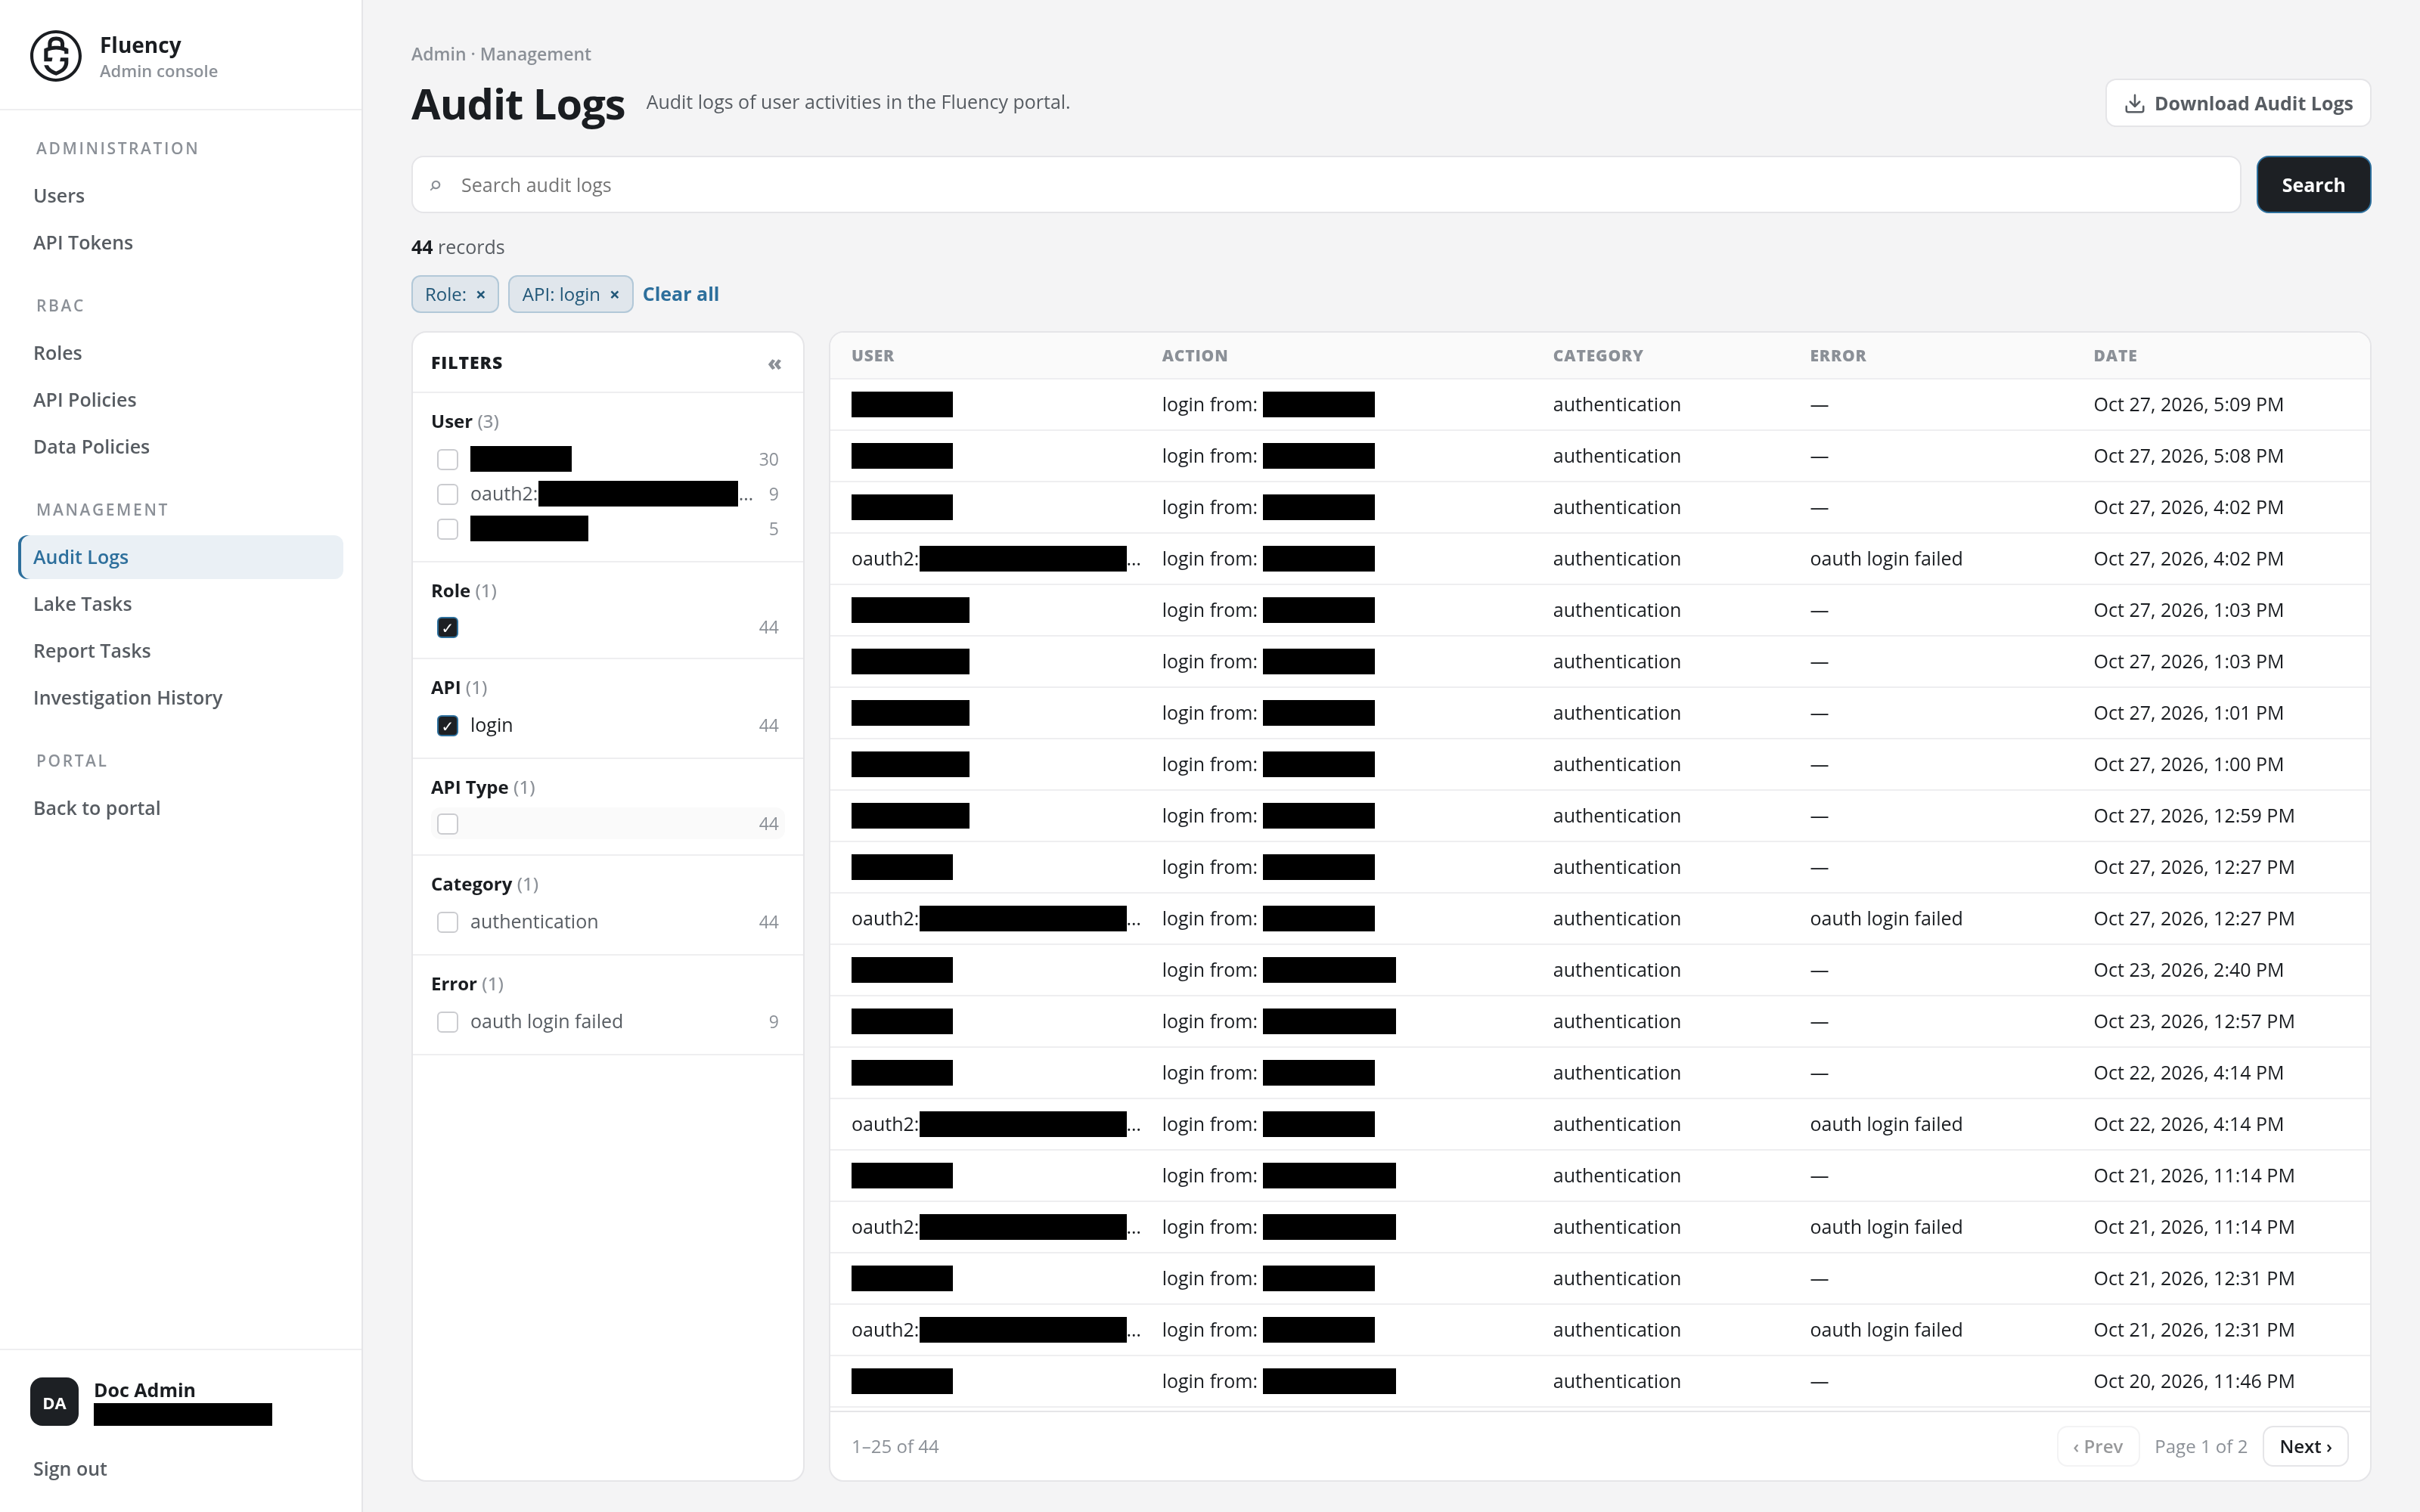
Each active filter appears as a chip below the record count, named by its group and value (API: login; an excluded value's chip starts with NOT), with an × that removes it. Clear all removes every filter at once.
The « button in the panel's header collapses the panel to a narrow strip headed » Filters, giving the table the full width; » expands it again.
Records Table
The table has five columns:
- User: the user or API identity that performed the action.
- Action: what was done and where from, such as login from: followed by the client's IP address.
- Category: the action's category, or – when it has none.
- Error: the error the action ended with, or –.
- Date: when the action took place.
The pager in the table's footer reports the rows shown and the total (1–25 of 50) and the page (Page 1 of 2), with ‹ Prev and Next › buttons to step through the pages.
Record Details
Click a row to open the record in a panel that slides in from the right edge of the page, over the table.
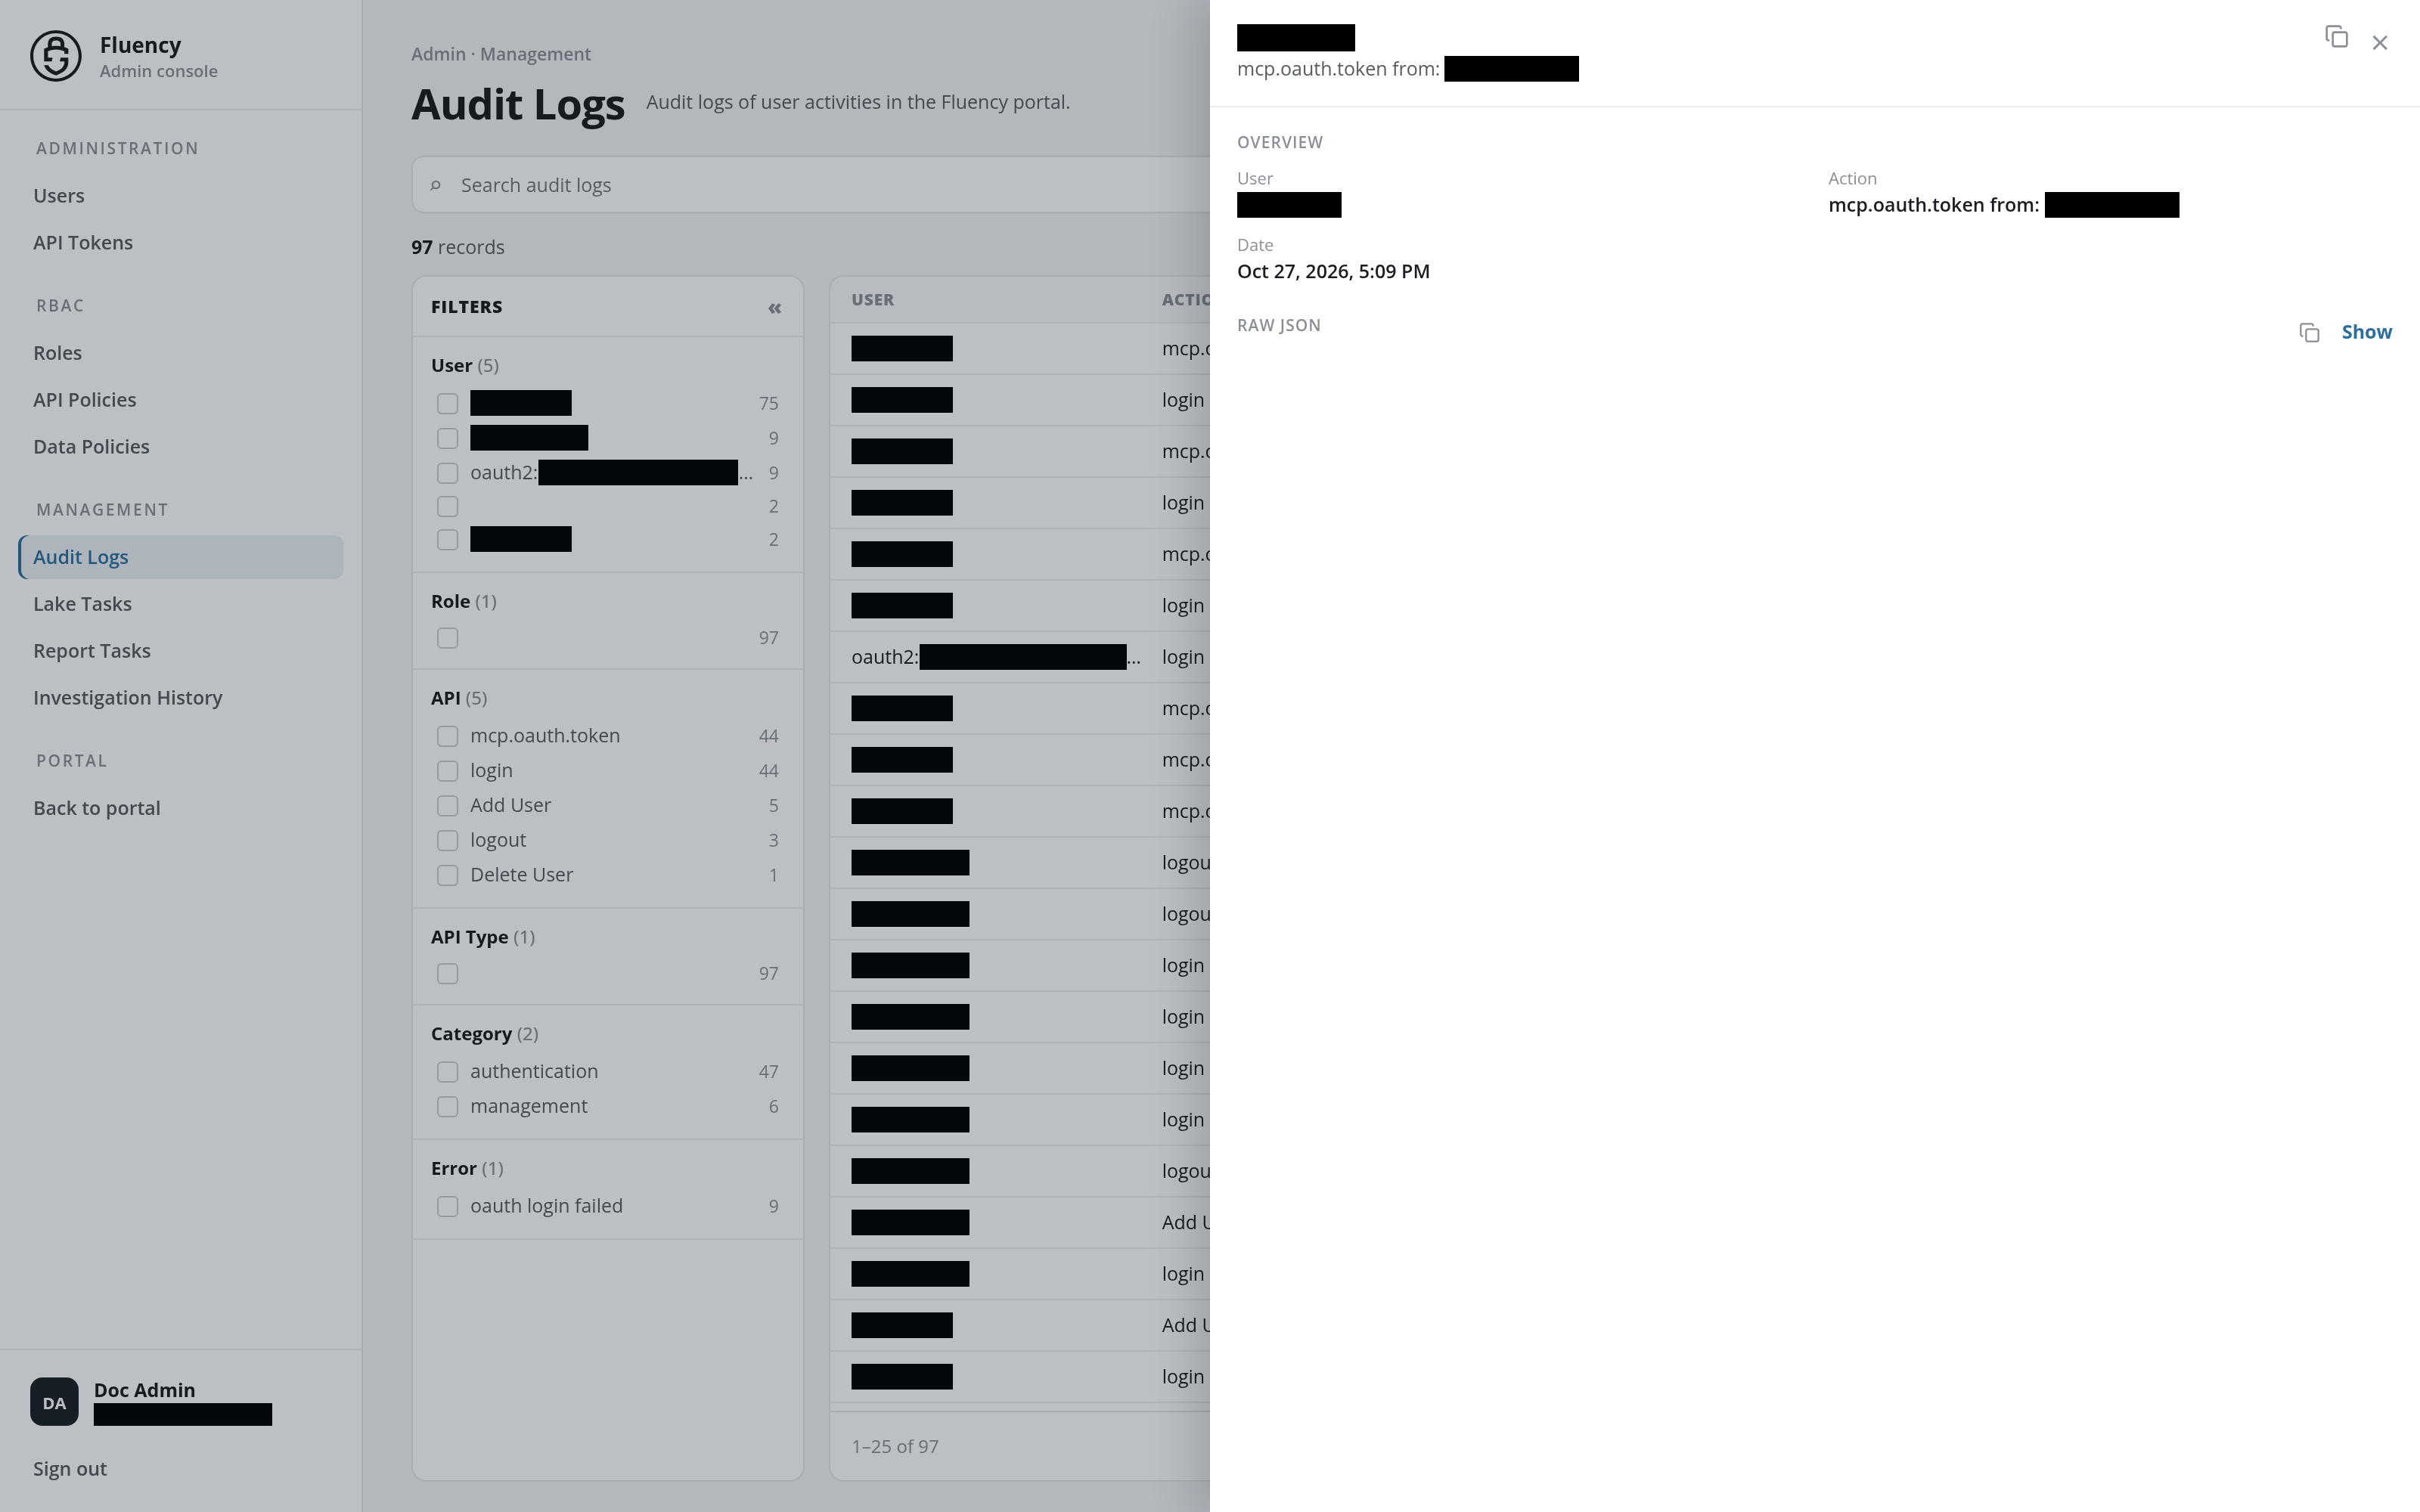
- Title: the record's user above its action. In the upper-right corner, the copy icon is Copy JSON, which copies the record's JSON, and the × closes the panel.
- Overview: the record's User, Action, Category, and Date. Category is left out when the record has none, and an Error row is added when the record carries an error.
- Raw JSON: the record's full JSON, hidden until you click Show. The Copy JSON icon beside Show copies it too.