Metrics Alerts
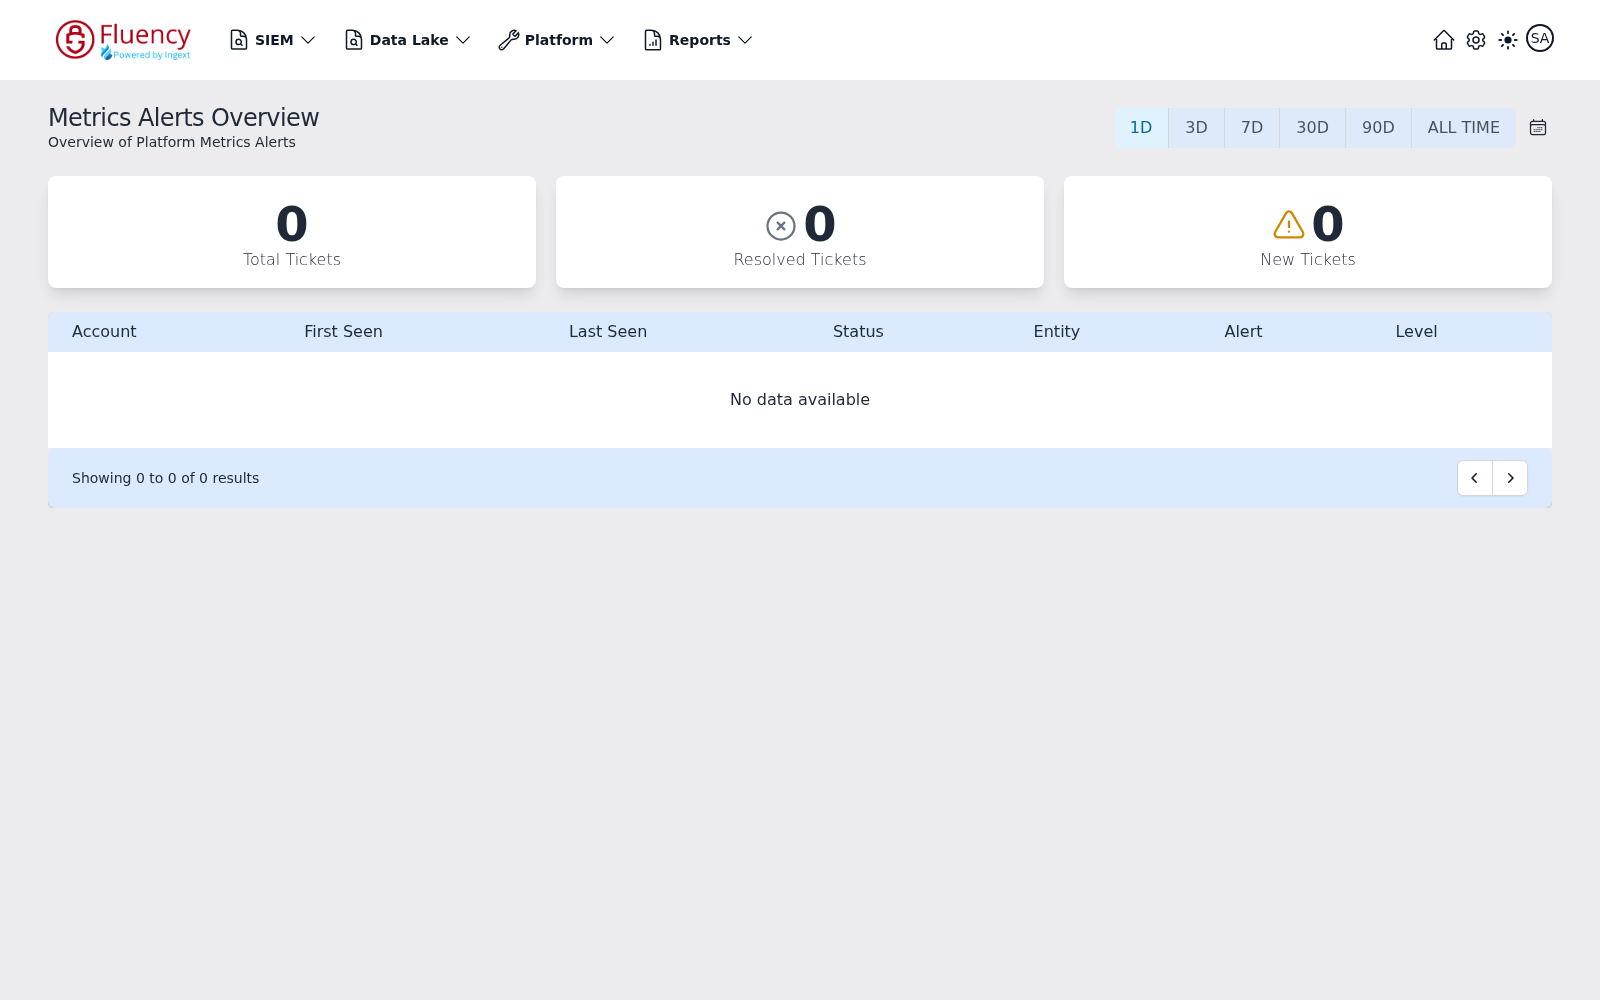
The Metrics Alerts Overview page summarizes the tickets raised by platform metrics alerts. It shows headline ticket counts and a table of individual alert tickets for the selected time range.
Menu path: Platform → Assets → Metrics Alerts · URL path: /platform/metrics/overview
Page Layout
The header shows the title Metrics Alerts Overview with the subtitle Overview of Platform Metrics Alerts, and a time range selector on the right. Below the header are three summary cards, followed by the alert ticket table with a result counter and pagination controls in its footer.
Time Range Selector
The button group at the top right sets the period the counts and the table cover:
- 1D (selected by default)
- 3D
- 7D
- 30D
- 90D
- ALL TIME
A calendar icon button sits at the end of the row.
Summary Cards
Three cards report ticket totals for the selected range:
- Total Tickets — the overall ticket count.
- Resolved Tickets — tickets that have been resolved, marked with a circled cross icon.
- New Tickets — newly opened tickets, marked with a warning triangle icon.
On an instance with no metrics alert activity, all three counts read 0.
Alert Tickets Table
Each row of the table is one alert ticket, with these columns:
- Account
- First Seen
- Last Seen
- Status
- Entity
- Alert
- Level
When there are no tickets in the selected range, the table shows No data available. The footer reports the result count (for example, Showing 0 to 0 of 0 results) with previous and next page buttons on the right.