5. See Your First Detection
The fifth step of the Quickstart: move from searching raw events to reading what the platform has concluded about them. This page is for the analyst. It introduces the ticket queue, the severity bands, and the behavior summary — together, where an analyst spends most of a working day.
Before You Begin
Data arriving and searchable (steps 3 and 4), and enough elapsed time for detection content to have evaluated it.
Set your expectations honestly: a brand-new instance with one source connected an hour ago may have no tickets at all, and that is a correct outcome. Detection here is not a per-event rule firing on arrival — behaviors accumulate against an entity, and a summary has to accumulate enough to be worth raising. A quiet queue on day one means your tenant has not done anything unusual yet.
If your instance has no tickets yet
Read this page against the screenshots, come back after a day or two of collection, or ask for access to a populated demonstration instance. Do not manufacture synthetic alerts to have something to look at: you will learn the wrong shape, and you will have to clean them up afterwards.
Every page below also works on an empty queue — the layout, the filters, and the facets are all visible and safe to explore with zero records.
The Ladder You Are Climbing
Four words describe the same activity at four levels, and this step walks up all four. Keeping them apart is the single most useful thing to take from this page:
| What it is | Where you see it | |
|---|---|---|
| Event | One stored record — one audit entry, one sign-in | Data Lake → Search |
| Behavior | A scored observation raised when a behavior rule matches, attached to an entity | SIEM → Behavior Timeline |
| Behavior summary | Every behavior for one entity over one day, carrying that entity's accumulated risk score | SIEM → Behavior Summary |
| Ticket | The queue item raised from a summary — the thing that gets worked and closed | SIEM → Overview Summary |
The score belongs to the entity and its accumulated behaviors, not to any single event. A sign-in from an unusual country is not, on its own, a critical incident; the same account also resetting MFA and granting an application consent within the hour is what a summary is for. See Risk Scoring.
Step 1 — Open the Ticket Queue
Open SIEM → Overview Summary.
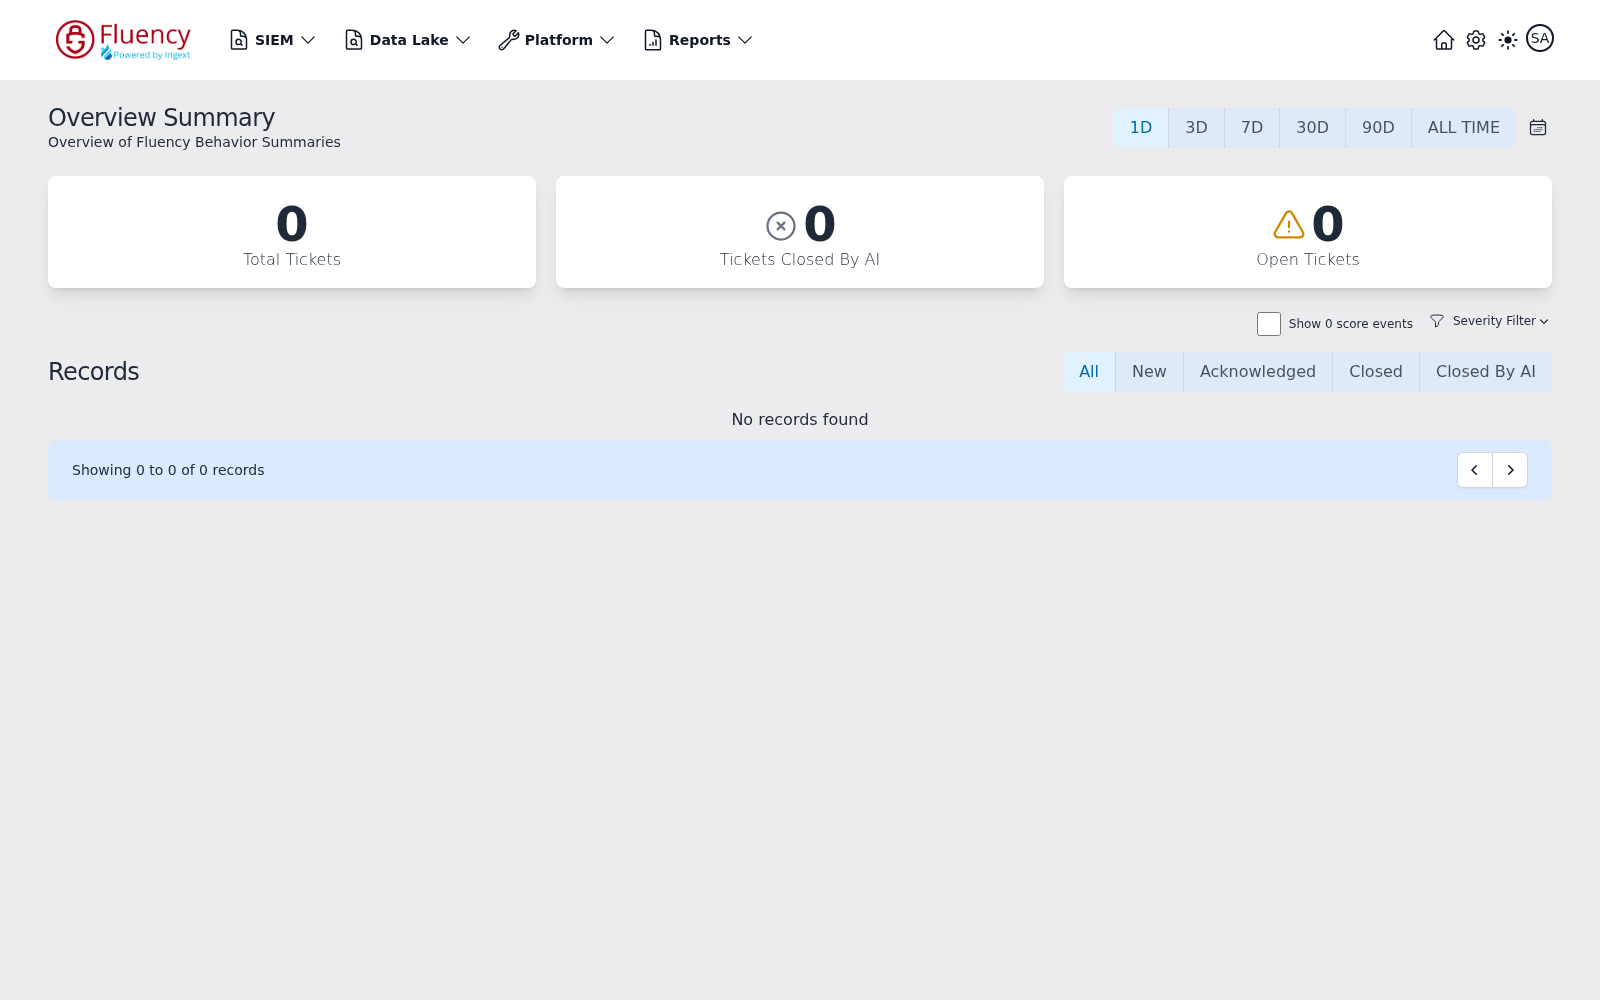
The page is subtitled Overview of Fluency Behavior Summaries and runs top to bottom as:
- A header with the time-range selector on the right.
- Three counter cards: Total Tickets, Tickets Closed By AI, and Open Tickets.
- A filter row on the right with the Show 0 score events checkbox and the Severity Filter dropdown.
- The Records section, with status filter tabs on the right and the record list below.
- A footer bar showing the record range — Showing 0 to 0 of 0 records, for example — with paging arrows.
On a fresh instance all three counters read zero and the list shows No records found. These are the same three counters shown on the Home dashboard, where View Tickets links here.
Step 2 — Set the Time Range
The button group in the upper right offers 1D (selected by default), 3D, 7D, 30D, 90D, and ALL TIME; the calendar icon to the right of ALL TIME is the Custom date range control for a specific window instead of a preset.
Choose a range that covers the period since your source was connected — 7D is a reasonable first choice on a new instance. Both the counters and the record list follow this range, so a zero counter with 1D selected tells you nothing about the week.
Step 3 — Read the Ticket Counters
- Total Tickets — every ticket raised in the period.
- Tickets Closed By AI — those resolved automatically, marked with a circled-x icon.
- Open Tickets — those still awaiting review, marked with a warning-triangle icon.
Read them as a workload and posture summary, not as a to-do list. Total against Open tells you how much of the period's activity is still unhandled; Closed By AI against Total tells you how much of it never needed a person. A high total with a low open count is a healthy instance, not a busy one.
The five severity levels
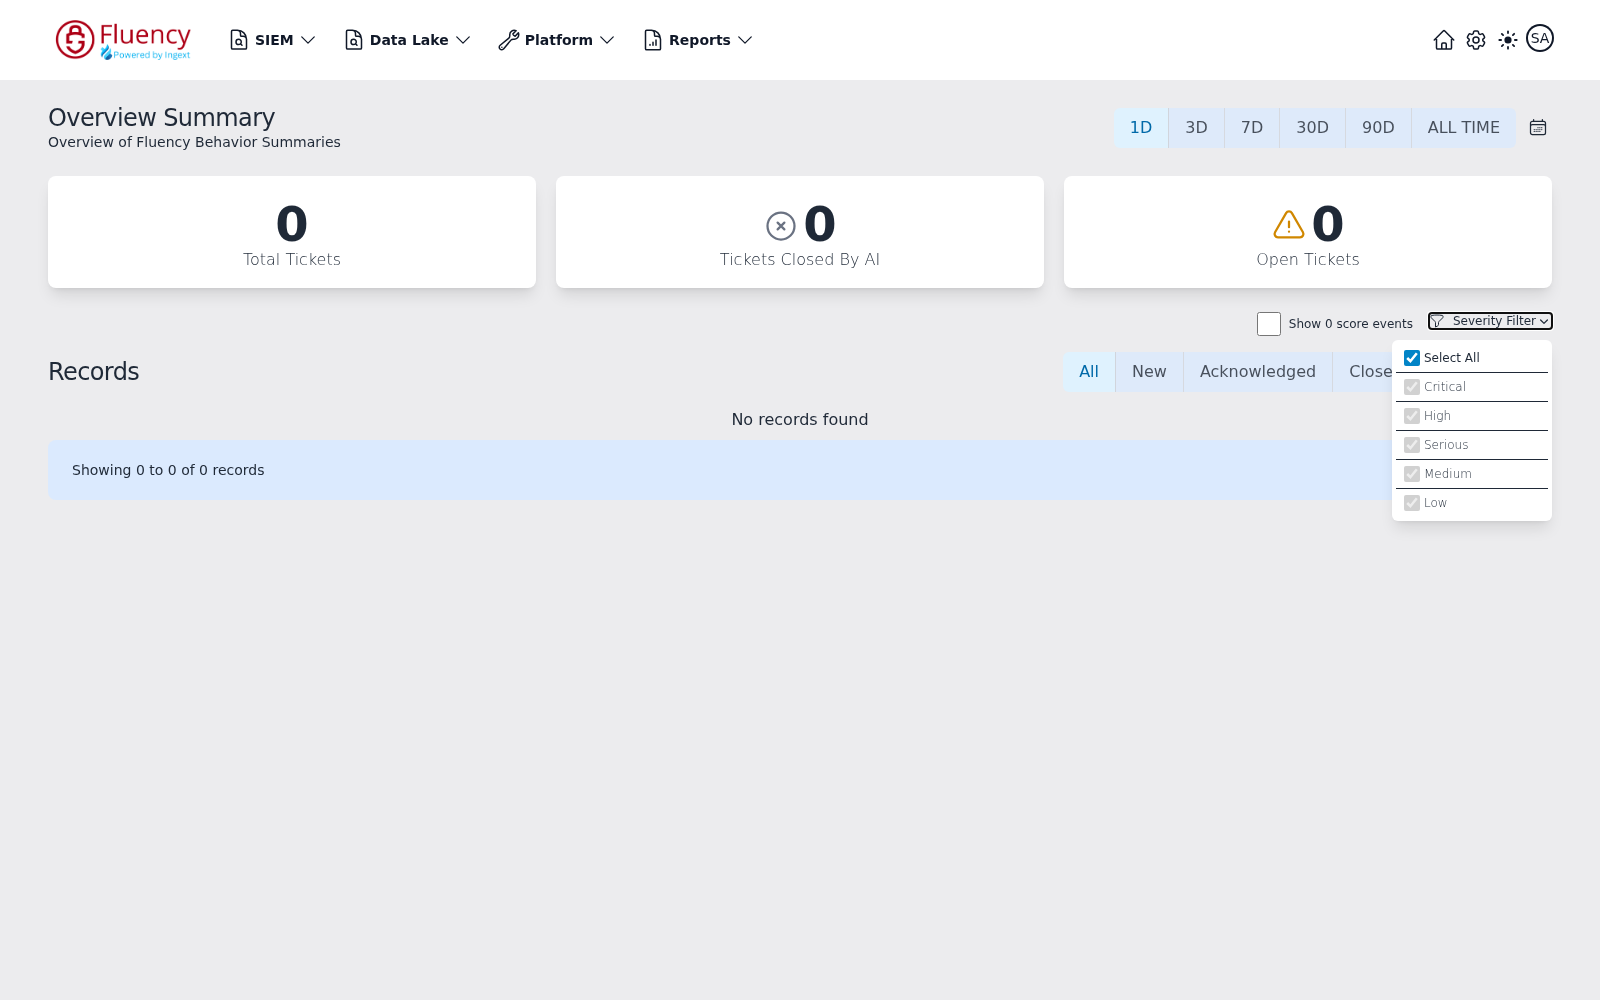
Critical, High, Serious, Medium, and Low. These are score bands rather than independent labels — a summary's severity chip follows its accumulated risk score, which is why the same rule can contribute to a Low summary on one entity and a Critical one on another. Risk Scoring covers the scoring model itself.
Step 4 — Filter the Record List
-
Open the Severity Filter and choose the levels you want to see. The dropdown is a Select All checkbox followed by one checkbox per level — Critical, High, Serious, Medium, Low — and Select All is checked by default.
-
Leave Show 0 score events unchecked. It is a checkbox, off by default; enabling it includes zero-score events, which on a new instance will bury the few records worth looking at.
-
Narrow by status with the tab bar on the right of the Records section: All (the default), New, Acknowledged, Closed, and Closed By AI.
-
Page through the list with the arrow buttons in the footer bar, which also reports the visible range.
The footer holds paging arrows only. Ordering the queue by score or age is done on SIEM → Behavior Summary, which is the next step and has a proper search over the same underlying summaries.
Choosing a good first record to read
Pick a mid-severity record with several contributing behaviors rather than the single highest-scoring one. The highest score is usually one loud rule firing repeatedly, which teaches you nothing about how the score is assembled; a Medium summary built from four different rules shows you the whole mechanism in one screen.
Step 5 — Read a Behavior Summary
Open SIEM → Behavior Summary. The ticket records on the Overview Summary and the summaries here are the same underlying objects — this page is where you search and read them.
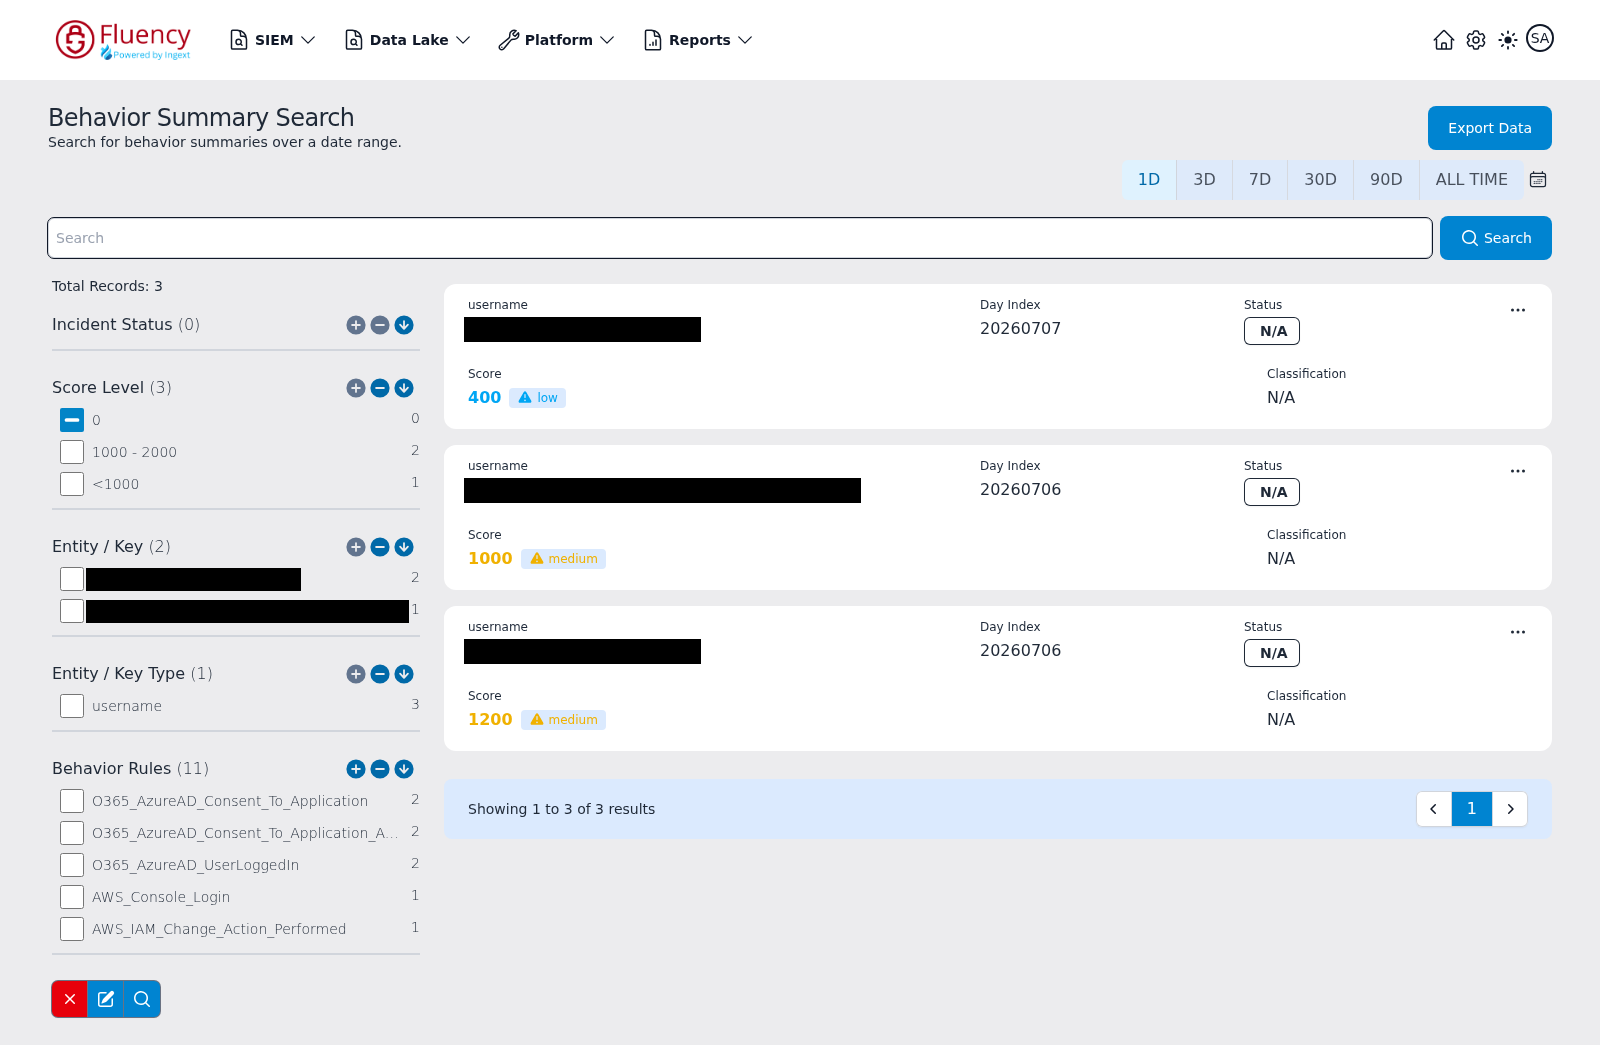
The page is headed Behavior Summary Search, subtitled Search for behavior summaries over a date range., with a full-width Search field, the same time-range presets as the Overview Summary, and an Export Data button.
The left sidebar shows Total Records and a stack of facets — Incident Status, Score Level, Entity / Key, Entity / Key Type, Behavior Rules, and Behaviors — each listing its values with a matching record count. Use Entity / Key to jump straight to a user, or Behavior Rules to see everything one rule contributed to.
The 0 bucket in Score Level starts excluded — its checkbox is in the minus state — so zero-score summaries do not appear until you clear that exclusion with the red X (Reset Facet) at the bottom of the sidebar. On a quiet new instance this is worth knowing before you conclude there is nothing there.
Each summary appears as a card showing:
- username — the entity the summary covers, such as an email address or an AWS ARN.
- Day Index — the day the summary belongs to, in
YYYYMMDDform. - Status — the ticket status badge (N/A when none is set).
- Score — the numeric behavior score with a severity chip, for example medium.
- Classification — the assigned classification (N/A when unset).
Read the card in that order and you have the whole triage question in one line: which entity, on which day, at what score, in what state.
Reading what the score is made of
The ellipsis (...) button in a card's upper-right corner opens a menu with one option, View JSON. That is the fastest way to see exactly what a summary is built from, and it is worth doing once on your first summary even though you will not do it on every one afterwards.
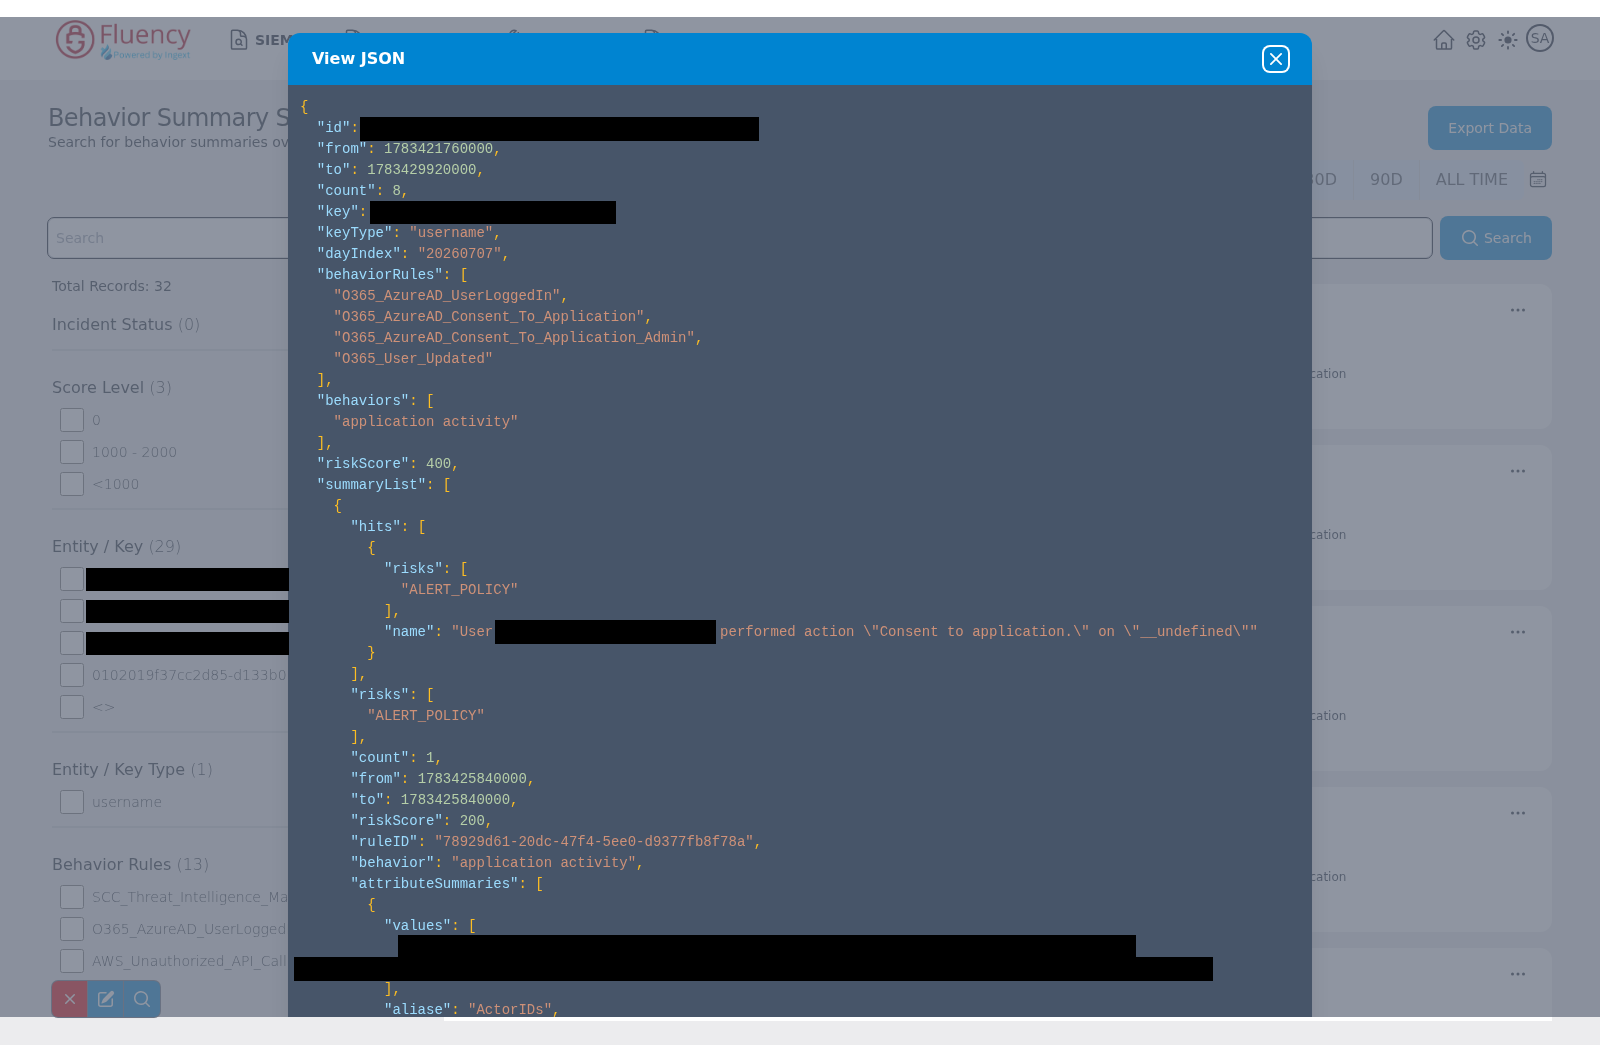
The record holds the identity and range fields — id, from, to, count, key, keyType, dayIndex — the behaviorRules and behaviors arrays naming what contributed, the overall riskScore, and a summaryList array that breaks the score down per rule, each entry with its own hits, risks, count, riskScore, ruleID, behavior, and attributeSummaries.
summaryList is the answer to "why is this score what it is". Close the dialog with the X in its title bar.
The Behavior Summary walkthrough works one of these end to end, and Investigating a Behavior Alert is the full triage procedure.
Step 6 — Trace a Behavior Back to Its Events
A summary tells you an entity accumulated risk. To see when and from what, open SIEM → Behavior Timeline and search or facet for the same entity.
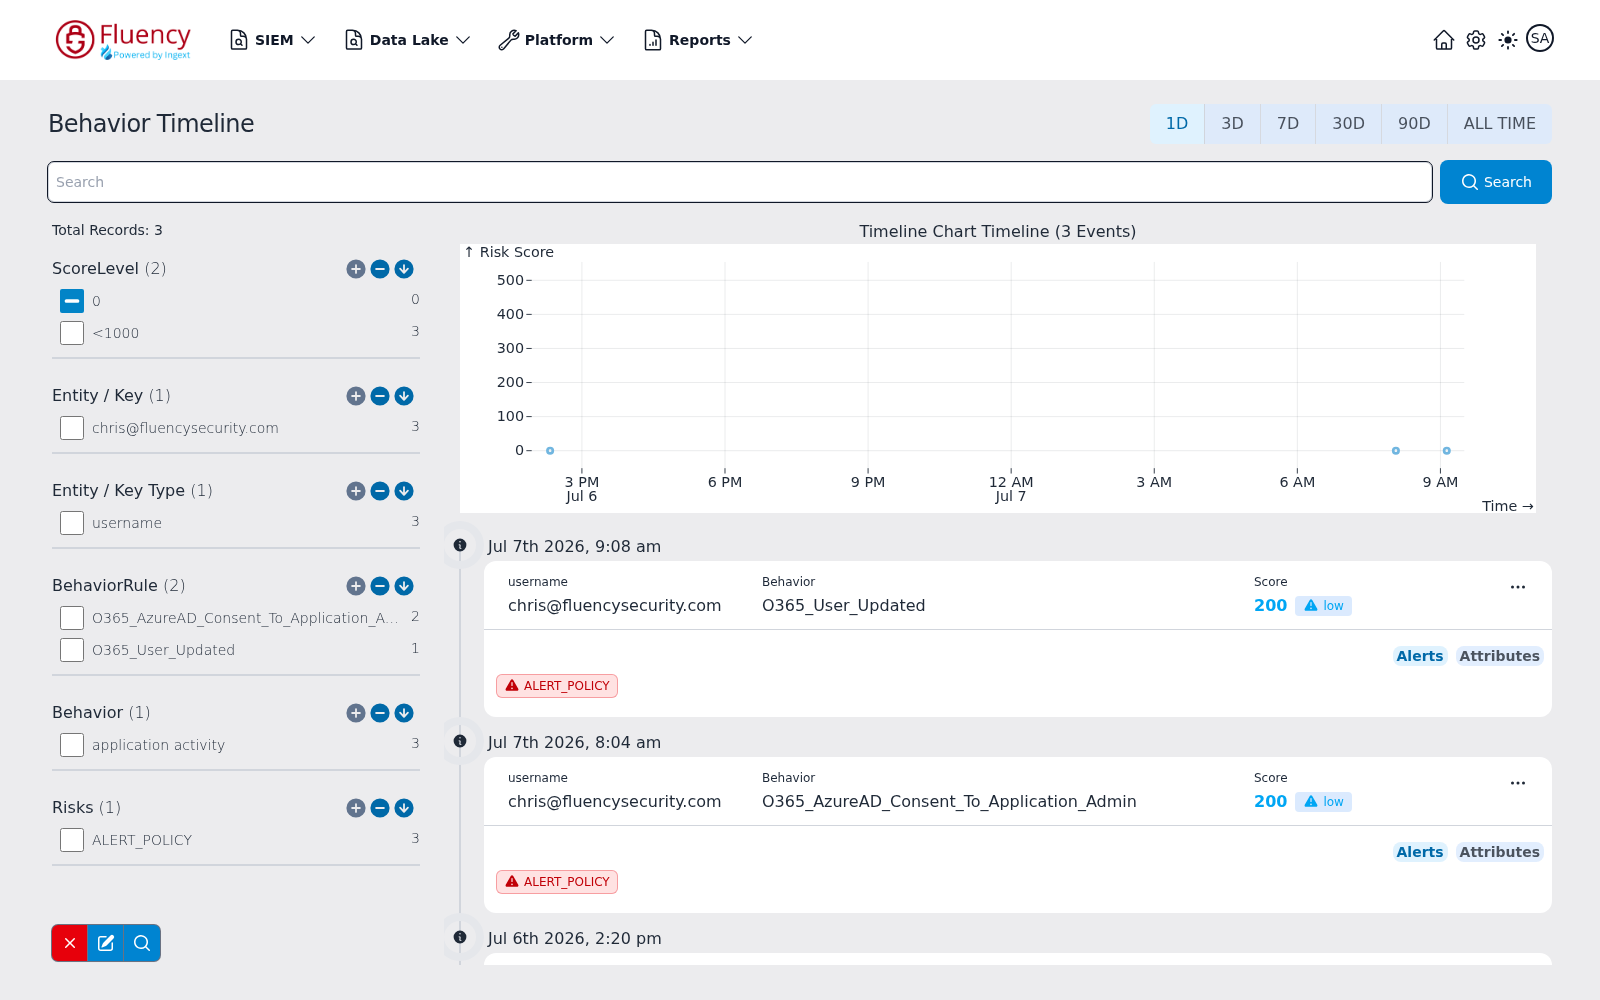
The chart at the top plots one dot per event, with Risk Score on the vertical axis and time of day on the horizontal, so the shape of an entity's day is visible before you read anything. Below it, events are listed newest first along a vertical timeline, grouped by timestamp. Each card shows the username involved, the Behavior (the rule the event matched), and the Score with a severity chip.
The sidebar facets mirror the summary page — ScoreLevel, Entity / Key, Entity / Key Type, BehaviorRule, Behavior, Risks — and the 0 score bucket is excluded here too by default.
Each entry's lower panel has two toggle buttons on its right edge:
- Alerts (the default) — tag chips for the alerts and risk tags the event raised, such as a red ALERT_POLICY.
- Attributes — the same panel replaced by the event's attribute fields as labelled rows. The fields depend on the source; an Entra ID sign-in event shows ActorIP, AuthType, BrowserType, City, ClientIP, Country, and so on.
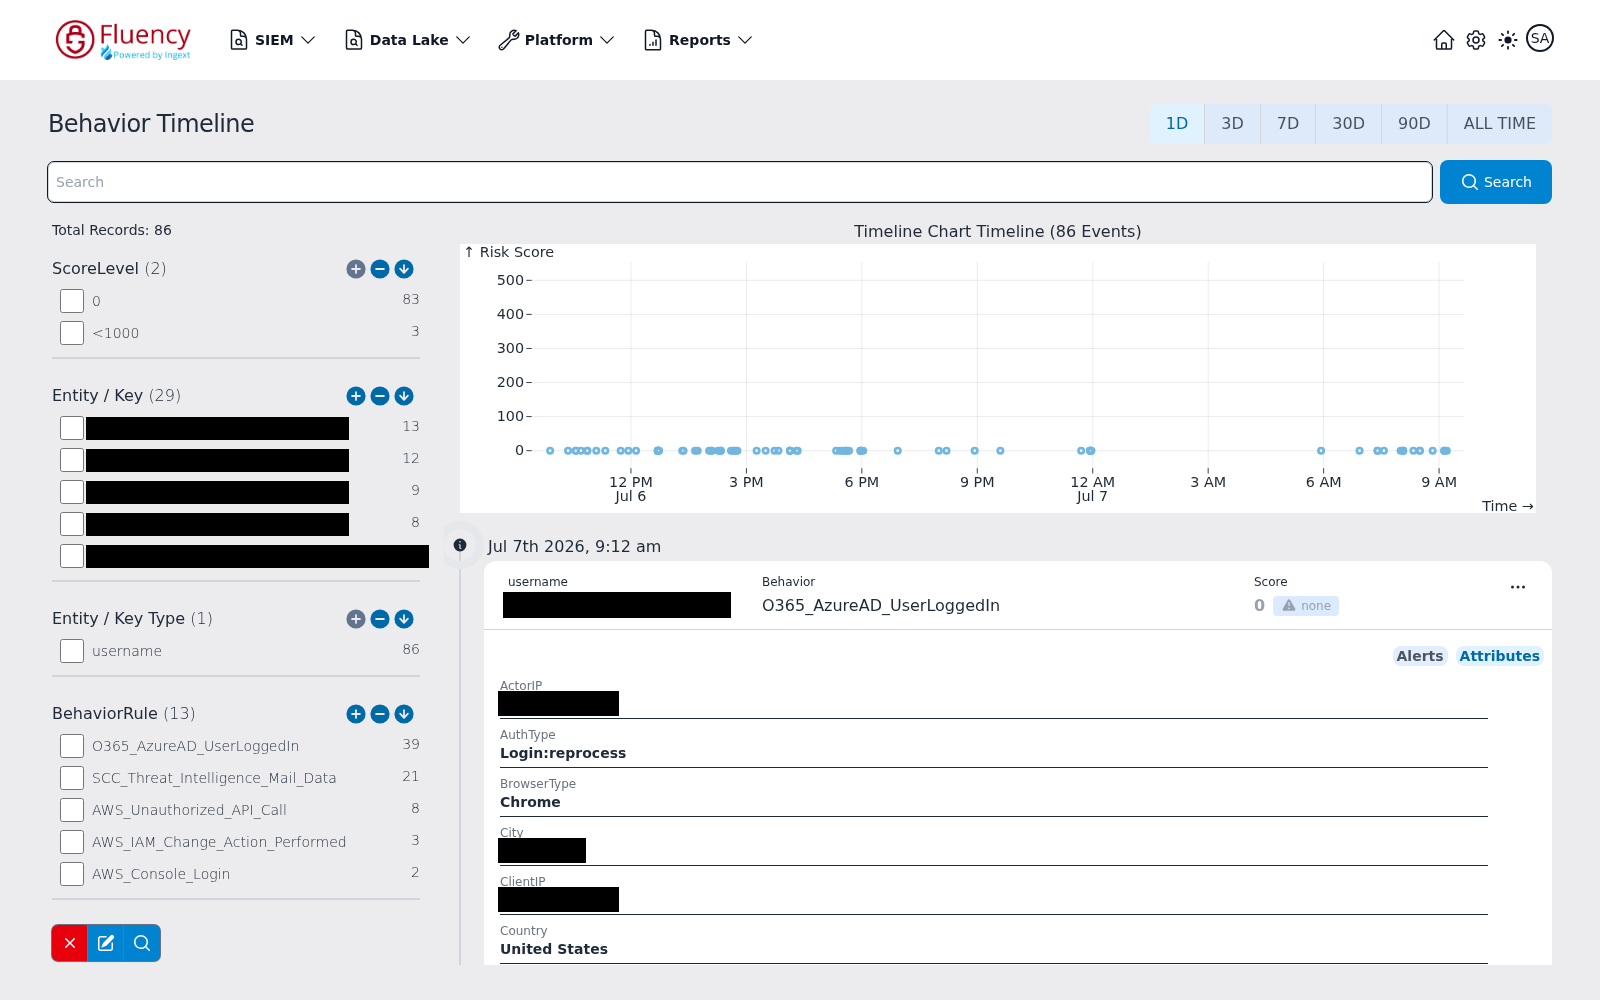
Attributes is the step that closes the loop. If your source is the Microsoft 365 application from step 2, those fields are the same sign-in details you were faceting on in step 4 — the same data, now attached to a scored observation rather than sitting in an index.
To go all the way to the original record, use the card's ellipsis (...) menu → View JSON. The event record carries sequence, timestamp, key, keyType, description, behaviorRule, behavior, riskScore, uuid, and ruleDescription, an AttributeMap object, and an attributes array that pairs each raw source field with its alias and value. That array is the point at which the detection stops being a claim and becomes the vendor's own record.
Step 7 — Look at the Rule Behind It
Open SIEM → Behavior Rules and find the rule that raised one of the behaviors you just read — its name is on the timeline card and in the summary's behaviorRules array.
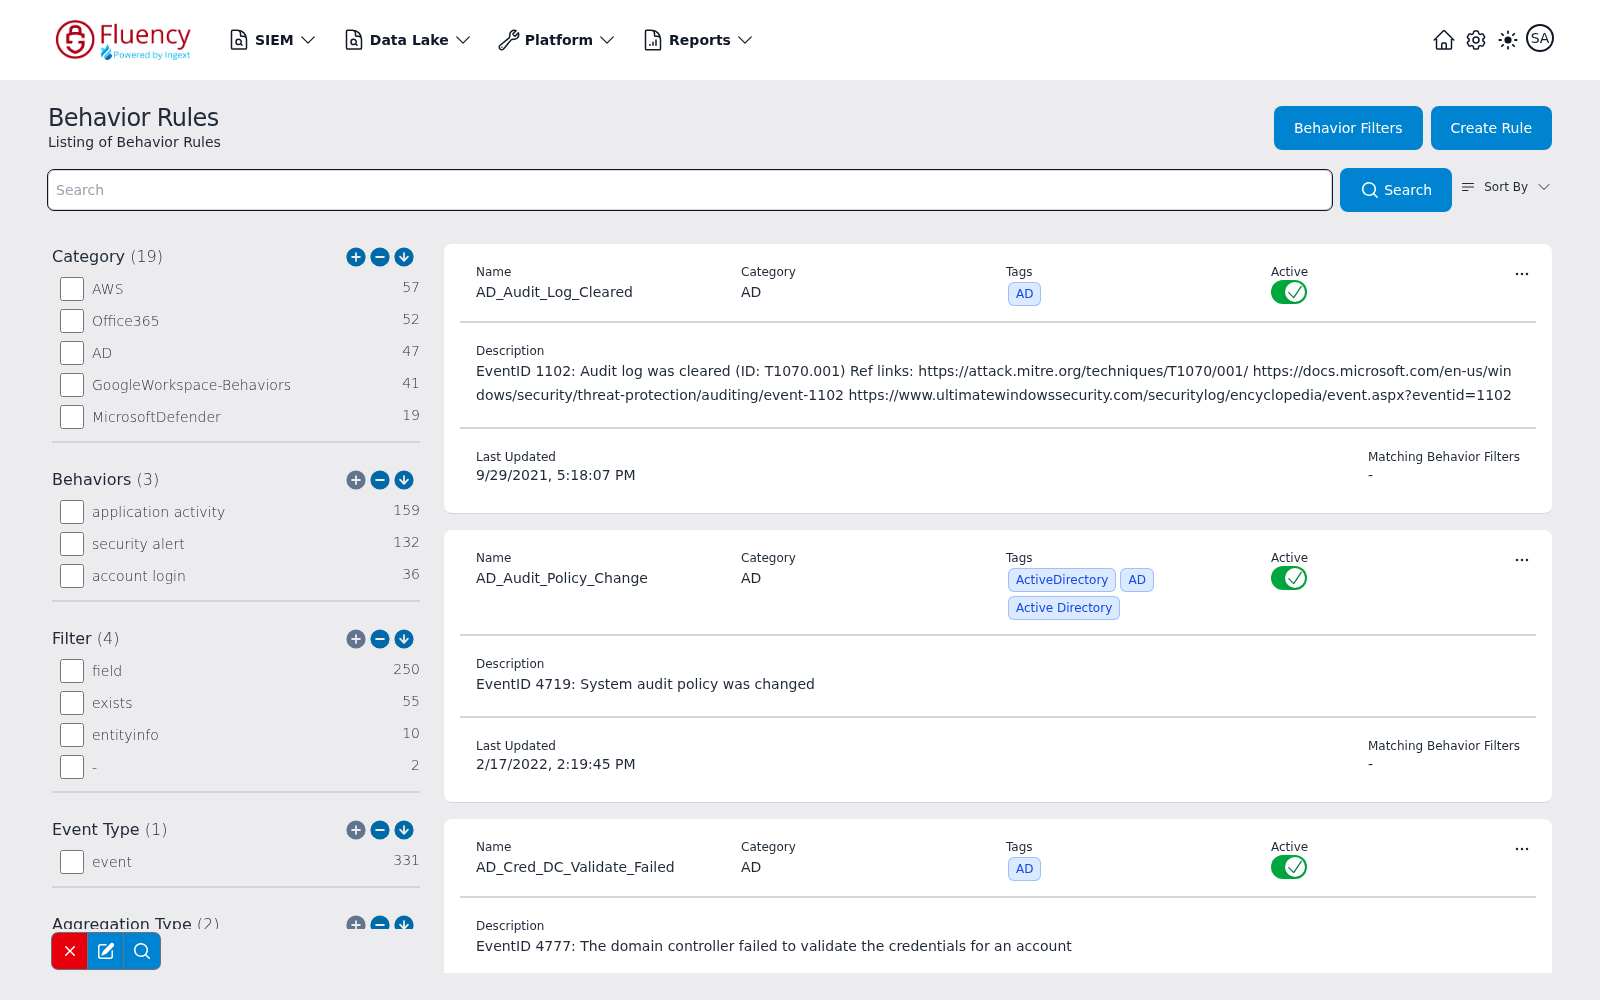
The page is subtitled Listing of Behavior Rules and carries two buttons on the right of its title bar: Behavior Filters and Create Rule. Below that sits a full-width Search field with a Sort By drop-down (Rule Name: A-Z, Rule Name: Z-A, Last Updated), a facet sidebar grouping the rules by Category, Behaviors, Filter, Event Type, and Aggregation Type, and the rule list itself — one card per rule showing its name, category, tags, active state, description, and update time.
Read the rule's description and category, and notice which Behaviors it is filed under. That is enough for now.
Where tuning happens — but not yet
Behavior Filters navigates to a separate page, subtitled Exceptions for Behavior Rules. It holds a table of filters with Enabled, Name, Description, Behaviors, Created On, and Actions columns, an Add Wildcard Filter button, and a red Return to Rules button to come back.
A behavior filter is an exception to a rule — the mechanism for saying "this rule is right in general, but not for this service account". It is the correct answer to a noisy rule and the wrong answer to a rule you have not yet understood, which is why this quickstart stops at reading. See Managing Rules when you are ready to change something.
How to Tell It Worked
- The Overview Summary loads, and its counters follow the time range you set.
- Filtering by severity and by status changes the record list in the way you expect.
- On Behavior Summary you can find at least one summary and name the entity it covers, its day index, its score, and its severity band.
- View JSON on that summary shows a
summaryListyou can read as an explanation of the score. - On Behavior Timeline you can reach one contributing event and see its Attributes.
- You can name the rule that raised it, and say in one sentence what a Behavior Filter would do to it.
On an instance with no tickets yet, being able to describe all six from the screenshots is a pass. Come back and do it for real once there is data.
If It Did Not Work
| Symptom | What it means | What to do |
|---|---|---|
| No tickets at all | Expected on a new instance with one source | Time and more data, not configuration. Re-check with a wider time range first |
| The record list is empty but the counters are not | The severity or status filters are excluding everything | Set Severity Filter back to Select All and the status tab back to All |
| Behavior Summary shows nothing, but you know there are records | The default exclusion of the 0 score bucket is hiding them | Click the red X (Reset Facet) at the bottom of the sidebar |
| Tickets exist, but none relate to your new source | Detection content for that source may not be enabled, or its data is not yet normalized into the fields the rules use | Managing Rules |
| A flood of low-severity tickets | Normal on a first connection, before any tuning | Note them and move on; tuning with Behavior Filters is a later activity |
| A ticket you cannot open | A permissions question, not a detection one | Check the role assigned to your user — Managing Roles |
Next Step
6. Set Up Your First Notification — so you do not have to watch the queue.
Related
- SIEM → Overview Summary, Behavior Summary, Behavior Timeline, Behavior Rules — the four pages this step visits, control by control
- Investigating a Behavior Alert — the full triage walkthrough
- Detections and Risk Scoring
- Managing Rules — rules and their exceptions
- Key Concepts — events, behaviors, summaries, and tickets