4. Run Your First Search
The fourth step of the Quickstart: find your own data in the data lake and read one record end to end. This page is for both administrators and analysts — it is the first step of the path everyone repeats daily, and the point where the data stops being a bar on a chart and becomes records you can read.
Before You Begin
You confirmed data arriving in step 3, and you know which index it landed in. For this quickstart's source that is one of Office365, AzureAudit, or AzureSigninLogs.
Searching an index with no data in the selected window returns nothing and looks identical to a broken search. That is exactly why step 3 comes first — if you skipped it, go back, because you will otherwise spend this step debugging a search that is working correctly.
Step 1 — Open the Search Page
Open Data Lake → Search.
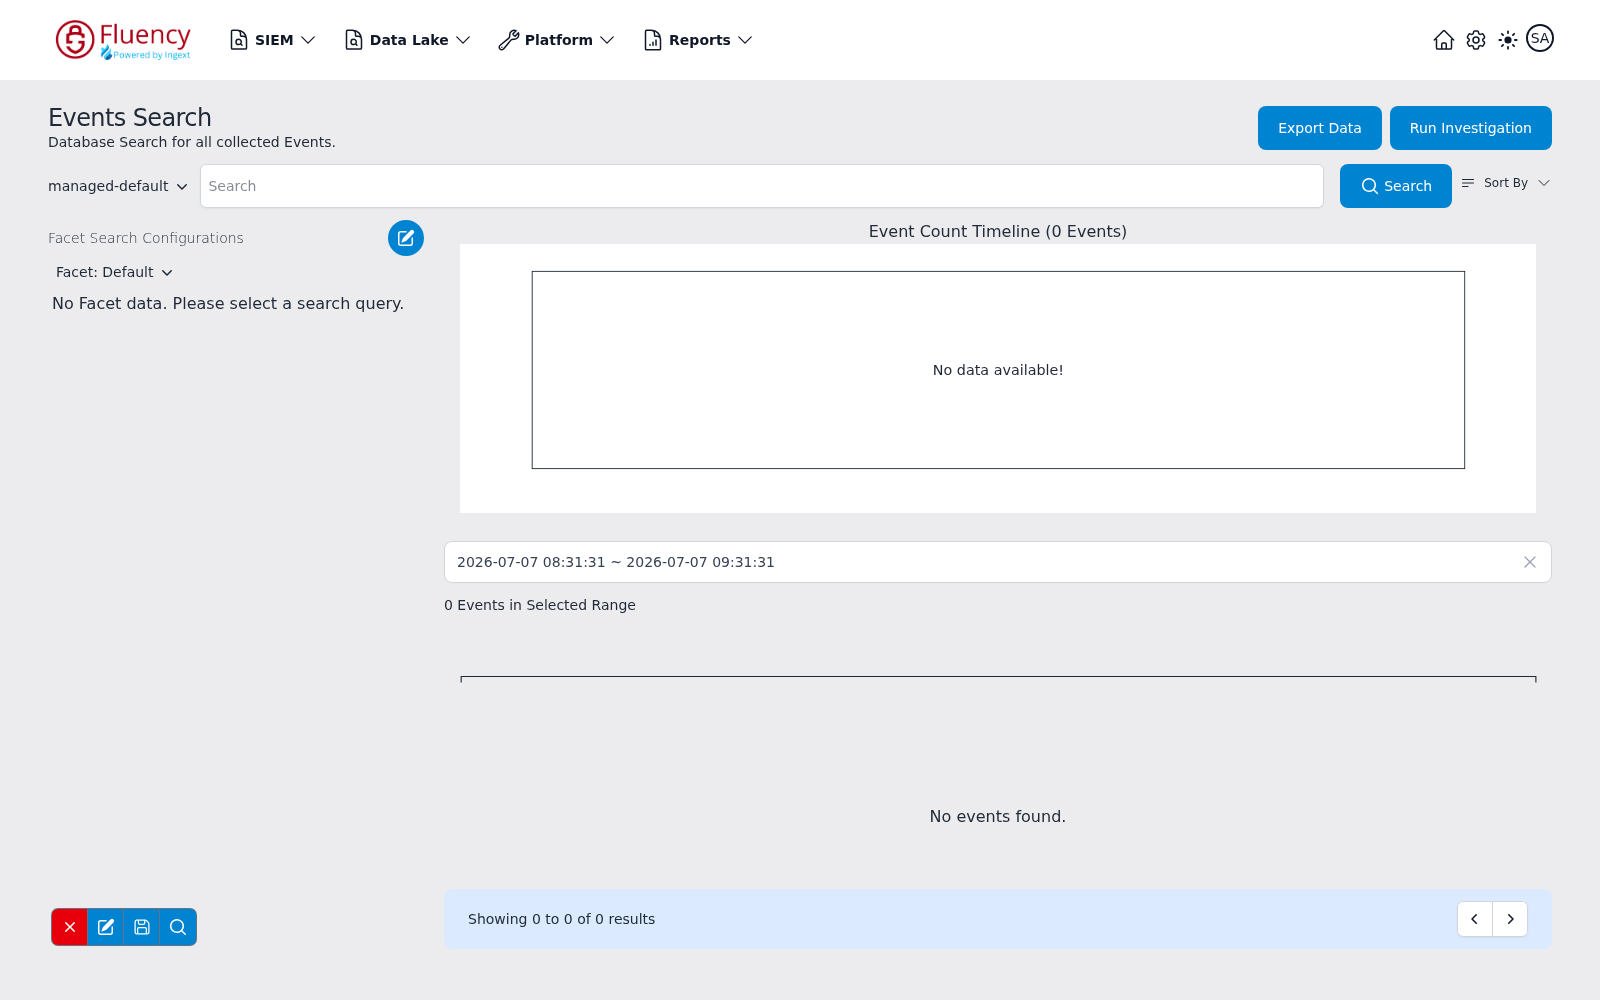
The page is headed Events Search, with the tagline Database Search for all collected Events. It is the platform's primary search surface and the page you will spend the most time on. From top to bottom it holds:
- Header — the title on the left, and the Export Data and Run Investigation buttons on the right.
- Search bar — an index selector, the query input, the Search button, and a Sort By menu.
- Facet Search Configurations (left column) — the facet configuration selector, the facet groups computed from the results, and a toolbar of four small icon buttons at the bottom left: a red X (Reset Facet), a pencil (edit the configuration's fields), a save button, and a magnifier (re-run the search).
- Event Count Timeline (main column) — a chart of event counts over the searched period, then the time-range field and an Events in Selected Range counter.
- Results list — the matching events, with a Showing X to Y of Z results footer and paging arrows.
Before any search has run, the facet panel reads No Facet data. Please select a search query. When a search matches nothing, the chart area reads No data available! and the results list reads No events found.
Step 2 — Select the Index
- Open the index selector — the leftmost control in the search bar, showing the index the search currently runs against.
- Choose the index your application writes to. Platform-managed indexes carry a
managed-prefix here: managed-Office365, managed-AzureSigninLogs, managed-default, and so on.
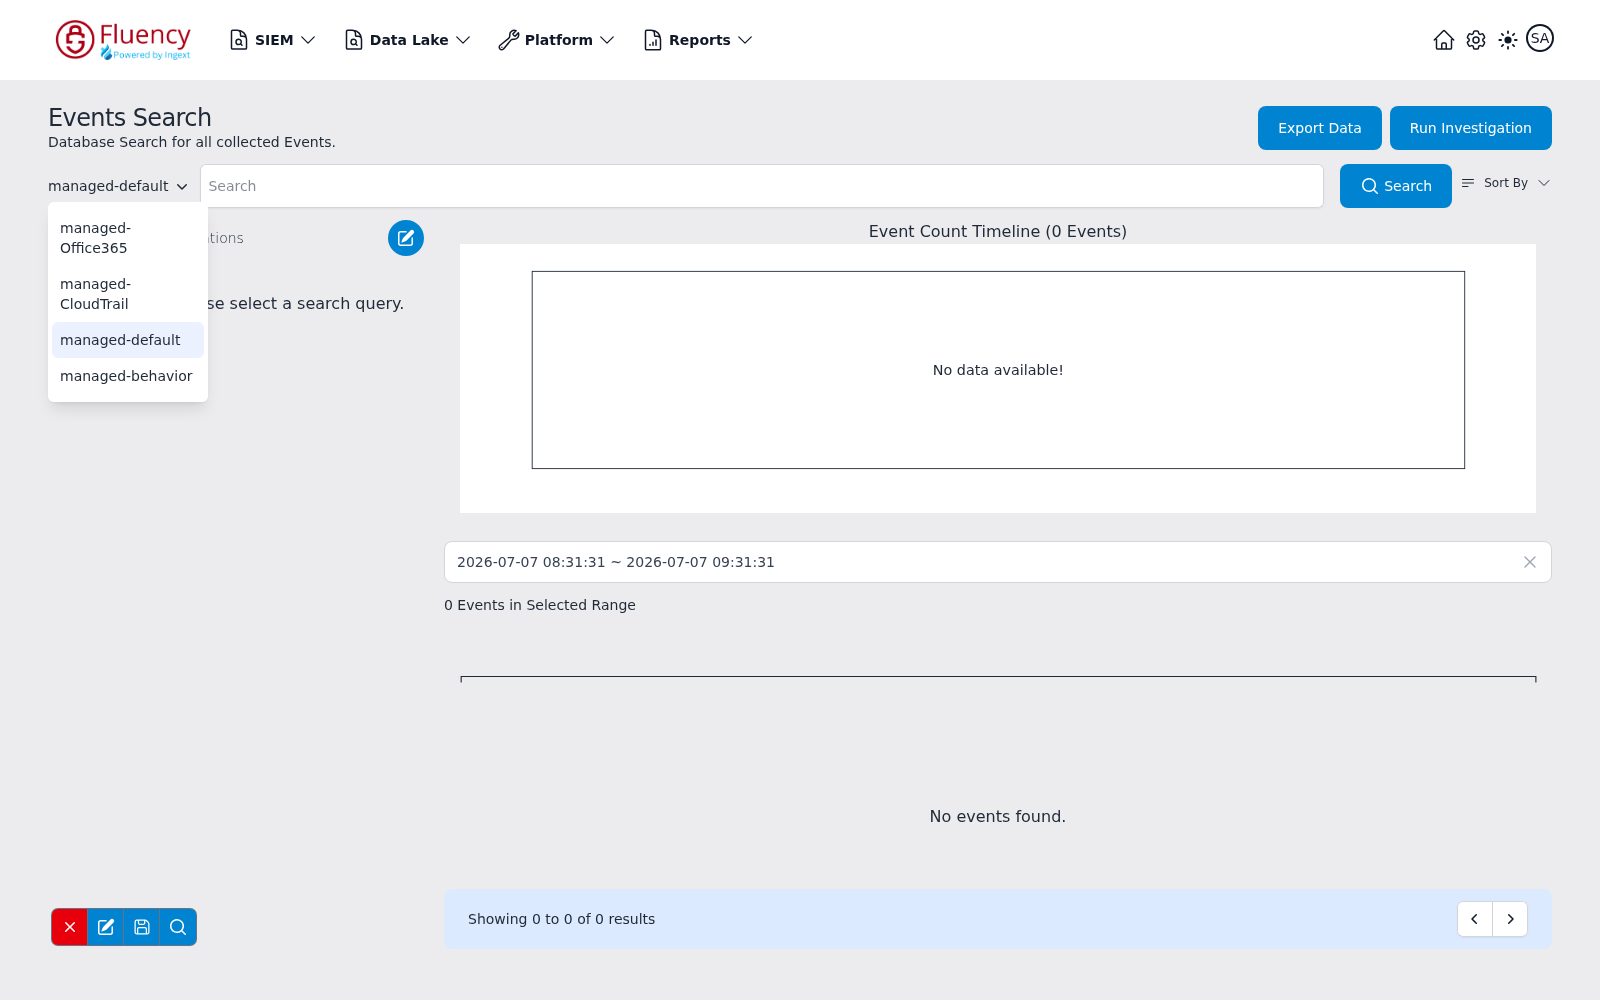
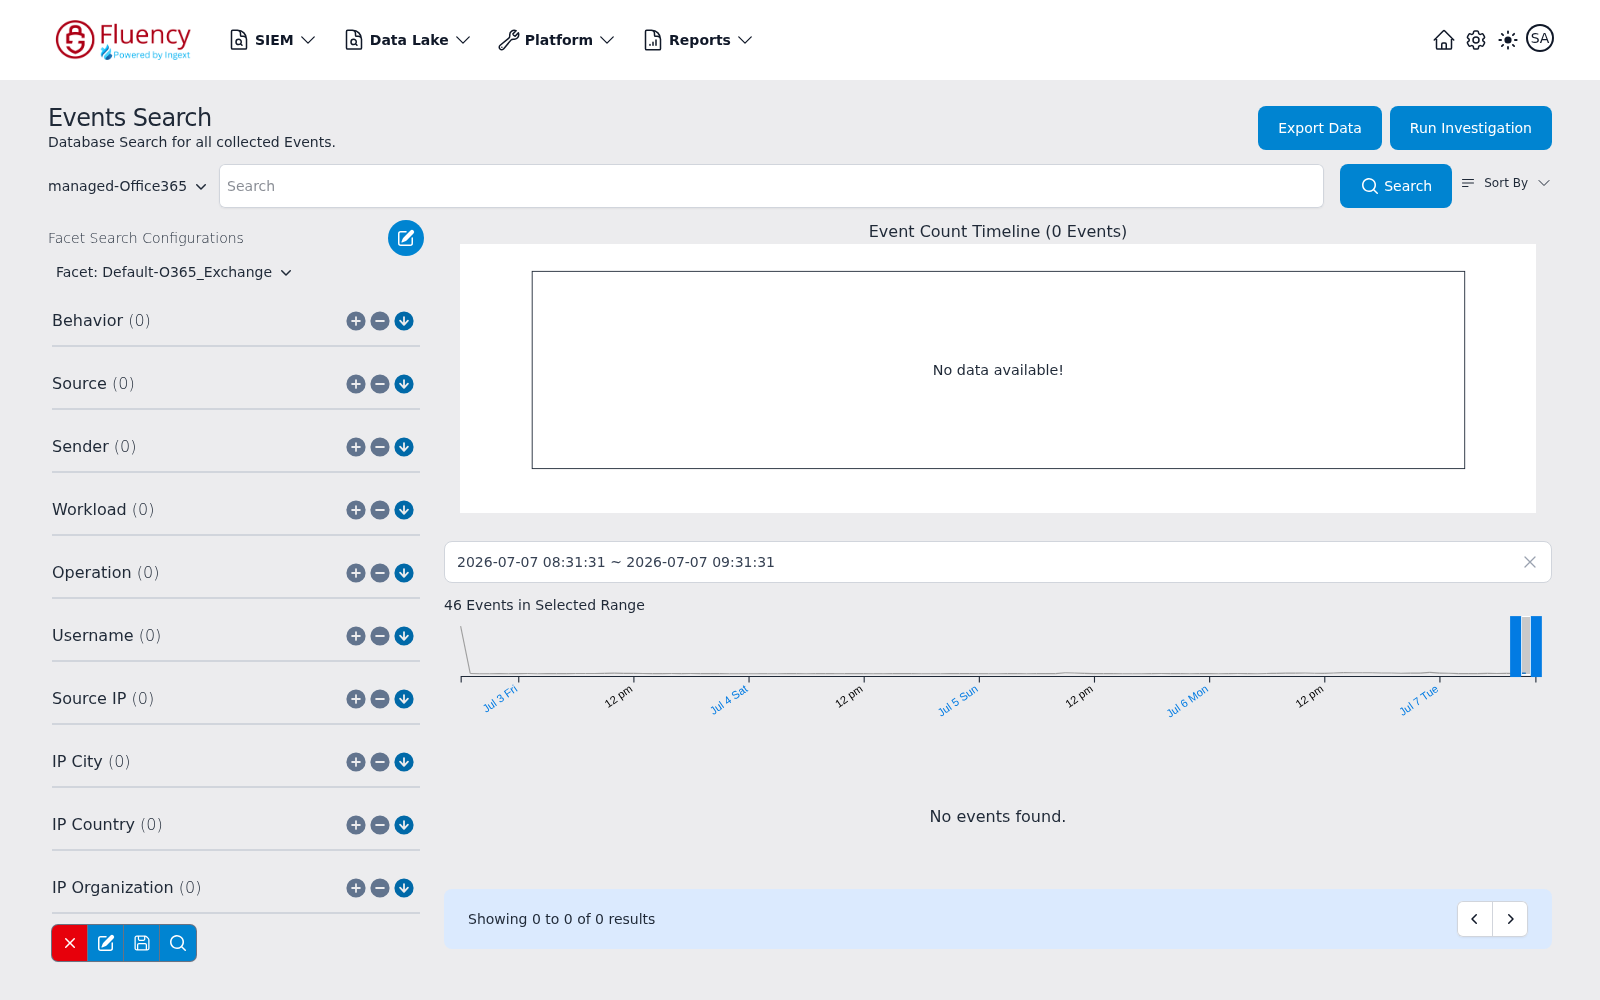
Picking a different index re-runs the search against it immediately, and switches the facet panel to the per-source facet configuration that matches. Choosing managed-Office365 loads the page with the Default-O365_Exchange configuration applied and redraws the range strip and the Events in Selected Range counter for the new index's events.
Why index selection comes first
The index decides three things at once: which records are in scope, which schema describes them, and therefore which fields the facet panel can break down. That is why the facets change when you change the index — they are not a fixed sidebar, they are computed from what the selected index actually contains.
It also decides cost. A search scans the indexes it is pointed at, so searching more than you need scans more data than you need. Start with one index and widen deliberately.
Step 3 — Set the Time Range
Set a window that certainly contains your data, and start wide — the last hour or the last day for a source connected this morning. The time-range field sits beneath the Event Count Timeline, and its x clears the range.
The timestamp used is the event's time, not the time it arrived. For a polled cloud source those differ: Microsoft aggregates unified audit log events across datacenters into content blobs and does not guarantee ordering, so events can arrive hours after they happened and a later blob can carry earlier events. Judge freshness over hours, not minutes.
Starting wide and narrowing
Confirm data exists in a broad window first, then narrow. Narrowing first is the single most common reason a new user concludes they have no data — the search is correct and the window is simply on the wrong side of the ingest lag.
Step 4 — Run a Query
- Start with an empty or minimal query, so the search returns everything in the selected index and window.
- Click Search (the magnifier in the search bar). The page navigates to a URL that records the whole search — the query (
q), the window (from,to), the filter terms (must,not), and the index (index) — so any search you can see, you can bookmark and share. - Read the result count in the Event Count Timeline heading and the Showing X to Y of Z results footer.
- Add one condition and watch both change.
Query input basics
The query, the index, and the time range together define what comes back; the query field is the only one of the three you type. For the syntax itself — field terms, boolean operators, wildcards, and ranges — see Queries and Lucene syntax rather than experimenting here.
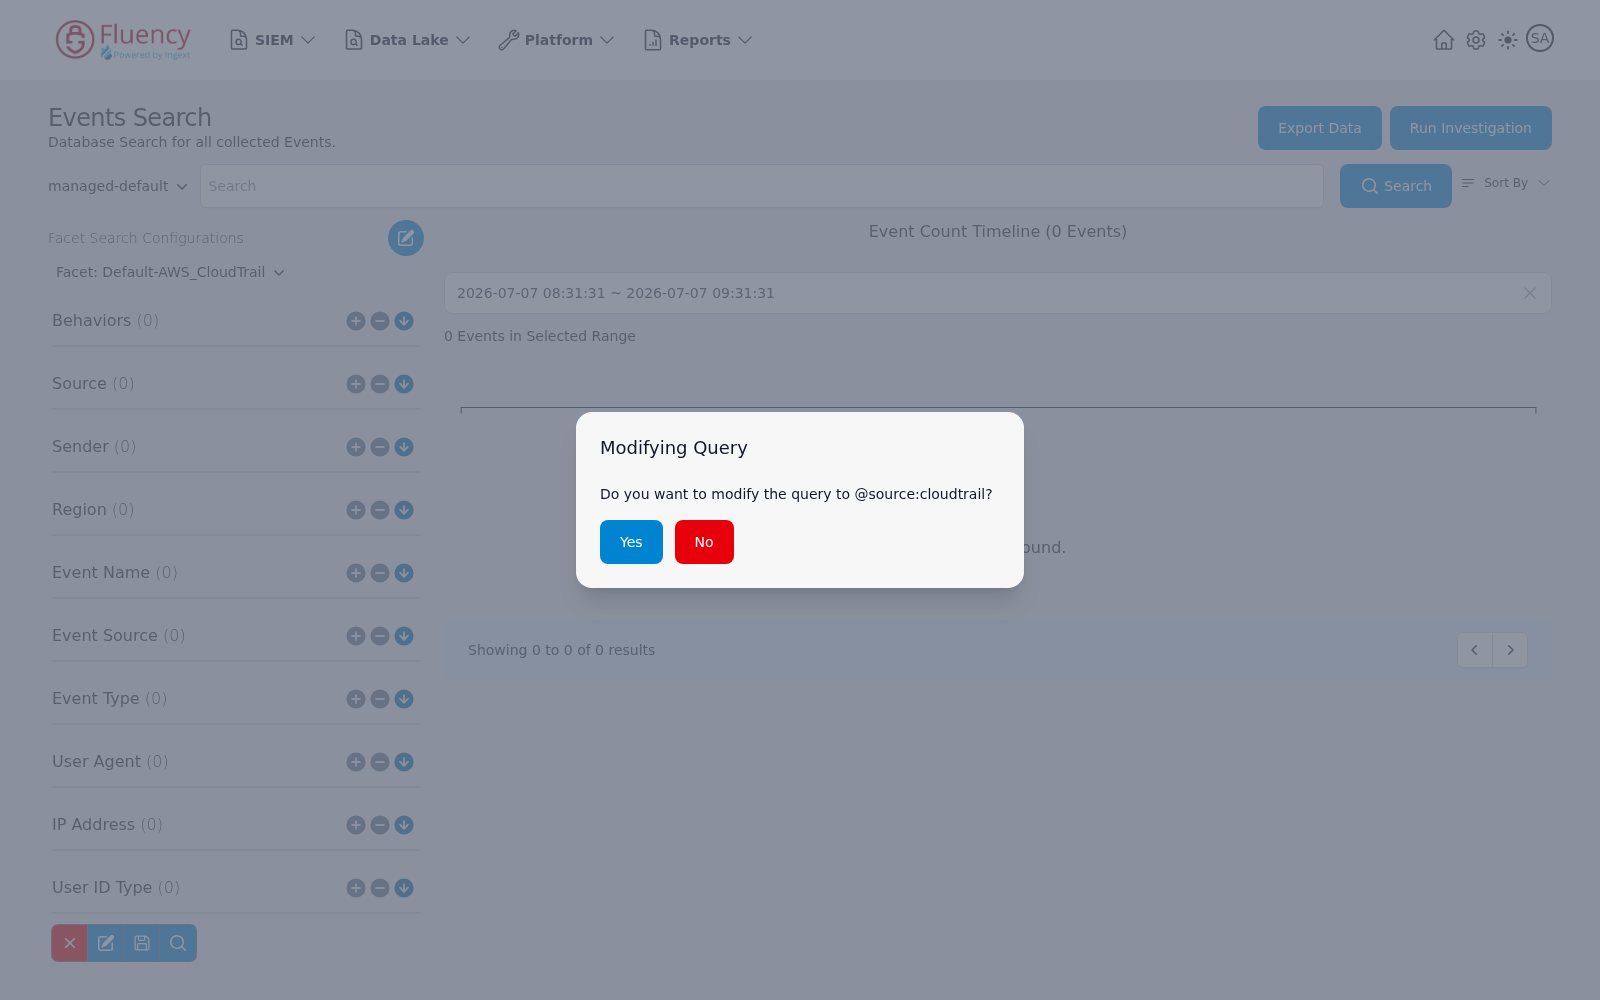
One shortcut worth knowing on day one: switching the facet configuration will offer to write a source filter for you. Selecting a per-source configuration opens a Modifying Query confirmation proposing the matching filter — Default-O365_Azure_AD proposes @source:Audit.AzureActiveDirectory, for example. Yes replaces the query with that filter; No keeps what you typed.
Sorting results
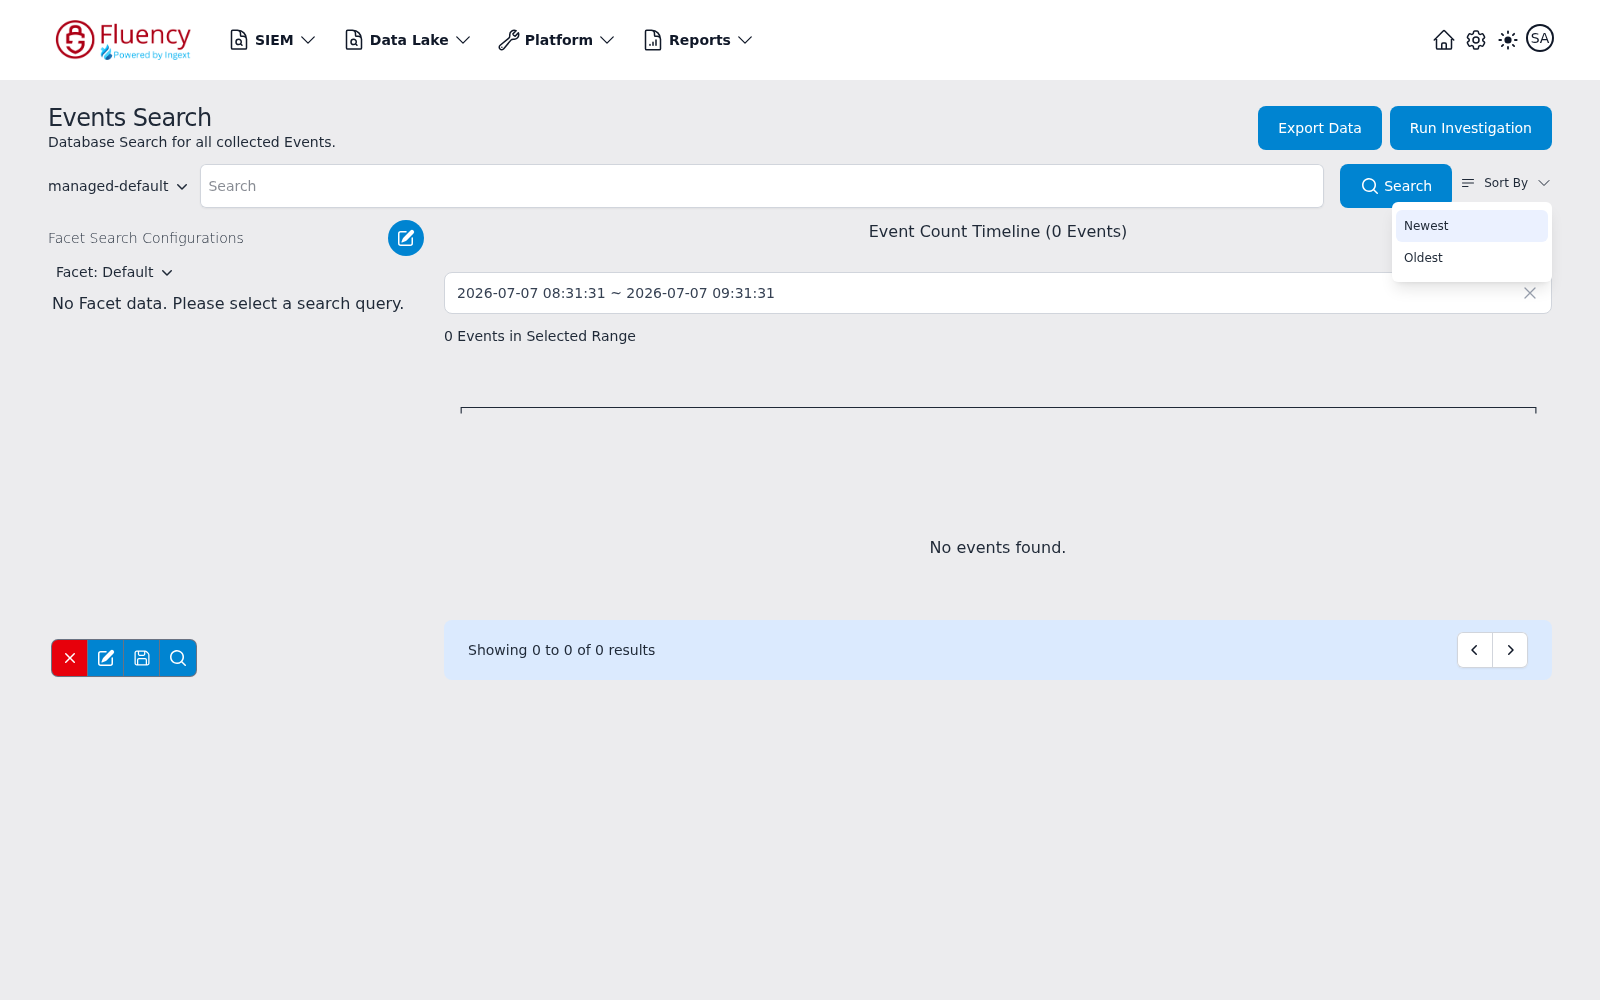
Sort By sits at the right end of the search bar and offers Newest and Oldest. Newest is the active order and applies in place; picking Oldest re-runs the search and reloads the results and facet groups in the new order. Newest-first is the sensible default for a first look, because the most recent records are the ones you can still corroborate from memory.
Step 5 — Use the Facets
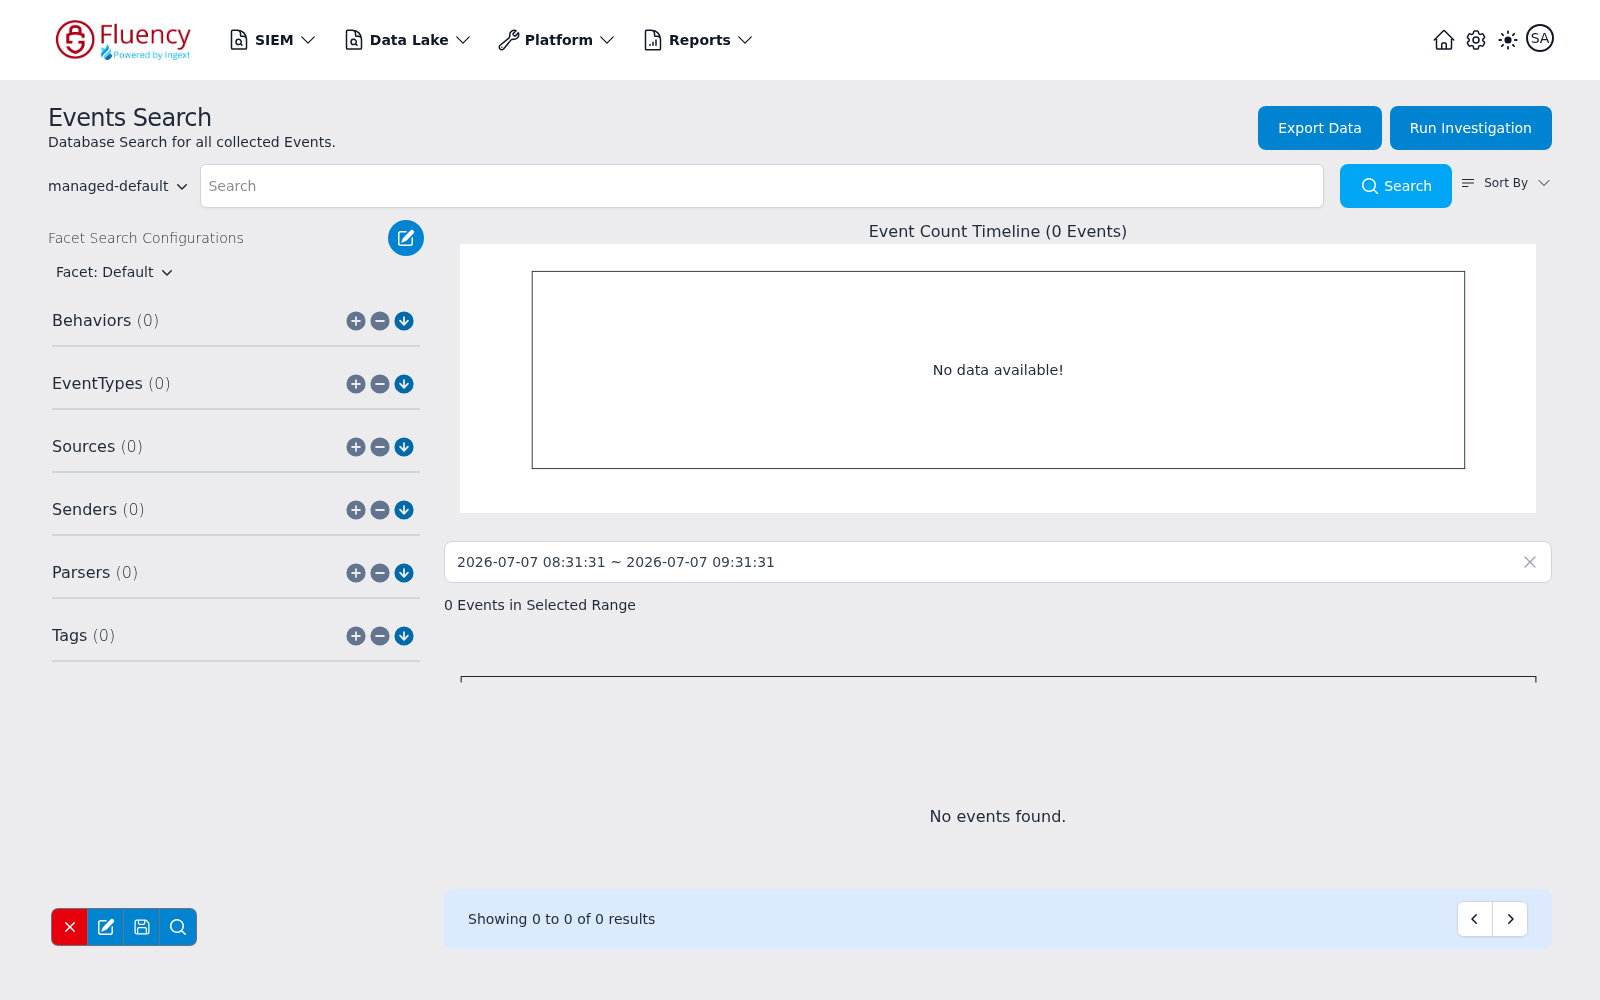
- Read the facet sidebar: one group per field in the selected configuration, each labelled with a value count in parentheses.
- Use the groups to see what is actually in your data — which workloads are represented, which users appear most, where sign-ins come from.
- Switch configurations from the Facet: selector when you want a different breakdown of the same results.
With the Default configuration the groups are Behaviors, EventTypes, Sources, Senders, Parsers, and Tags — a general-purpose view that works on any index.
The per-source configurations are more interesting. Default-O365_Exchange, the one that loads with managed-Office365, breaks results into:
Behavior · Source · Sender · Workload · Operation · Username · Source IP · IP City · IP Country · IP Organization
Every configuration defines its own groups, and the full list runs to 26 — a general Default plus a per-source default for each integrated source, including Default-O365_Azure_AD, Default-O365_OneDrive, and Default-O365_Security_Compliance_Center for the other Microsoft 365 workloads.
Why facets are the fastest way to learn a new data source
That list of ten groups is, in effect, an inventory of what a Microsoft 365 audit record contains and what real values those fields take in your tenant — which workloads are busy, which operations dominate, which countries your sign-ins come from. On day one that is worth more than any schema document, because it is your own data rather than an example, and it takes one click rather than a read.
Managing and grouping facets
The four-button toolbar at the bottom of the panel acts on the current setup: the red X resets it, the pencil edits the configuration's fields (each row a Title, a Field, and a Size), the save button stores the current setup as a named configuration, and the magnifier re-runs the search with it. The blue pencil beside the Facet Search Configurations heading opens the library of every saved definition. Data Lake → Search documents each control, and Facets covers the concept.
Step 6 — Read One Record in Full
Facets tell you what fields exist; at some point you need to see a whole record, with every field, in the order the platform stored it. The most direct route to that is the KQL Query Builder.
-
Open Data Lake → KQL Query Builder.
-
In the INDEXES panel on the left, click your index to select it and expand its schema in place. Note that index names here have no
managed-prefix — the same index that ismanaged-Office365in Events Search isOffice365here. -
Read the columns it lists with their types. The base columns are timestamp (INT64), size (INT32), doc (BYTE_ARRAY), and labels (MAP).
-
Put a query in the editor that returns a handful of recent records, then click Run query:
Office365 | where timestamp > ago(24h) | take 100 -
The page switches to the Results tab, which reports the search range, the number of records searched, and the bytes searched above the records themselves. With nothing in range the body reads No results found.
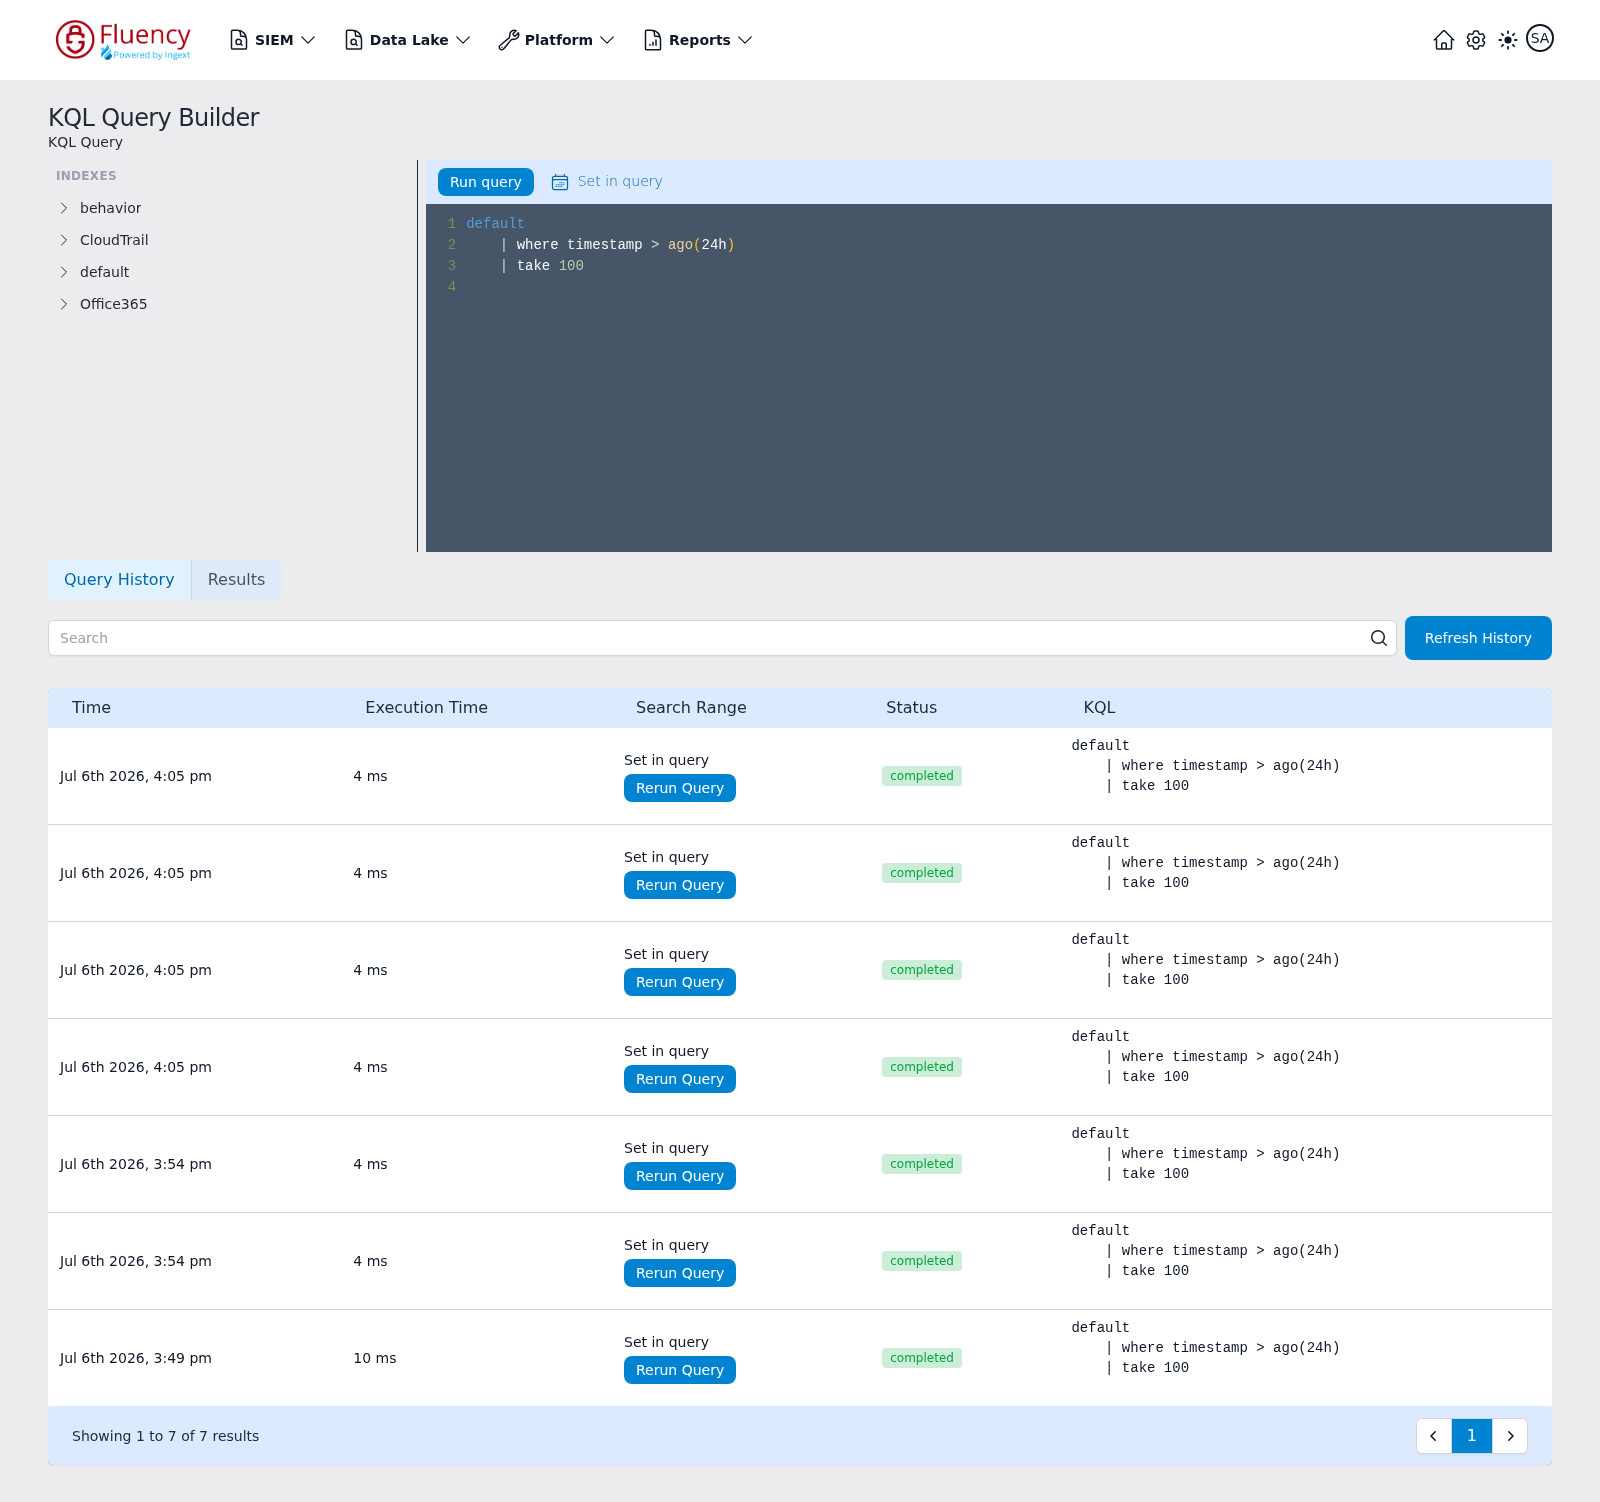
Every run is kept on the Query History tab with its execution time, status, and the KQL that produced it, and each row has a Rerun Query button — so a query that returns something useful is one click away for the rest of the session.
Expanding several indexes at once is worth doing here: the panel does not collapse one when you open another, so you can put Office365, AzureAudit, and AzureSigninLogs side by side and see how differently the same tenant's activity is shaped in each.
As you read a record, look for the normalized field names — the ones behavior rules and reports depend on, as opposed to the vendor's own field names carried through from the source. Normalization explains the distinction, and it is what makes the same rule work across two vendors' logs.
How to Tell It Worked
- The index selector lists your index, prefixed
managed-. - A broad time range with an empty query returns a non-zero result count in the Event Count Timeline heading and the results footer.
- The timeline shows bars in the period since your source was connected.
- The facet sidebar lists groups with non-zero counts, and the values in them are recognisably yours — your own domain, your own users, your own workloads.
- The KQL Query Builder returns records for the same index and window.
If It Did Not Work
| Symptom | Likely cause | What to do |
|---|---|---|
| No events found, and the chart reads No data available! | The window is on the wrong side of the ingest lag, or the wrong index is selected | Widen the range to a day, confirm the index, and re-check step 3 |
| Results, but the facet groups are all zero | A search ran before the facet configuration loaded | Click the magnifier in the facet toolbar to re-run with the current configuration |
| Results, but the fields are not the ones you expected | The per-source facet configuration for that index is not the one applied | Switch it from the Facet: selector; the index selector normally does this for you |
| Results, but fields look unparsed or raw | The processor for that source is not matching the format | Parser cookbooks |
| The search is slow, or refuses to run | Too wide a window, or more indexes in scope than you need | Narrow both. Search volume is charted on Platform → Usage as Search Cost |
| Export Data shows a red No events data to download toast | The current result set is empty | Nothing to fix — run a search that matches first |
Next Step
5. See Your First Detection — from raw events to something worth acting on.
Related
- Data Lake → Search and KQL Query Builder — every control on the two pages this step uses
- Search and Events Search — searching in depth
- Facets, Queries, Lucene syntax
- KQL reference — the query language the KQL Query Builder uses
- Normalization — how fields are named
- What Is an Audit Log — background for reading a record