3. Confirm Data Is Arriving
The third step of the Quickstart: prove that the source you just connected is actually delivering data, before you spend time searching for events that were never ingested. This page is for the administrator who has just installed an application.
It is built around three independent checks in three different places — application health, ingress volume, and storage-side queueing — because each one fails differently, and knowing which of the three is wrong tells you where to look.
Before You Begin
You have completed step 2, and some time has passed. How much depends on the feed:
| Feed | Index | Expect first data |
|---|---|---|
| Entra sign-ins | AzureSigninLogs | Within about an hour |
| Entra directory audit | AzureAudit | Within about an hour |
| Office 365 unified audit log | Office365 | Up to 12 hours on a new subscription |
The Office 365 figure is Microsoft's own warning about newly created Management Activity API subscriptions, not a Fluency delay. It is the single most common reason a correct install is mistaken for a broken one. Run the three checks below now — they will tell you the pipeline is healthy — then come back for the data.
The Three Checks, and Why There Are Three
The application status tells you whether the platform is trying. The usage charts tell you whether bytes are arriving. The data lake tells you whether they are being written. A problem shows up in exactly one of the three, which is what makes the diagnosis quick: an application that is Aborted is a credential or configuration problem, an application that is Running with no ingress is a source-side problem, and ingress with a growing queue is a storage-side problem.
Check 1 — Application Status
- Open Platform → Applications. It opens on the Installed Applications view, one card per application.
- Locate your application. Cards are named application type: instance name —
Office365-Audit: Office365-Auditfor this quickstart,Microsoft Defender: Defaultfor another template — so the same template installed twice appears twice under different instance names. - Expand the card with the arrow at its left edge to see the pipeline the application built, and click the blue eye button at the card's right edge to open its details panel.
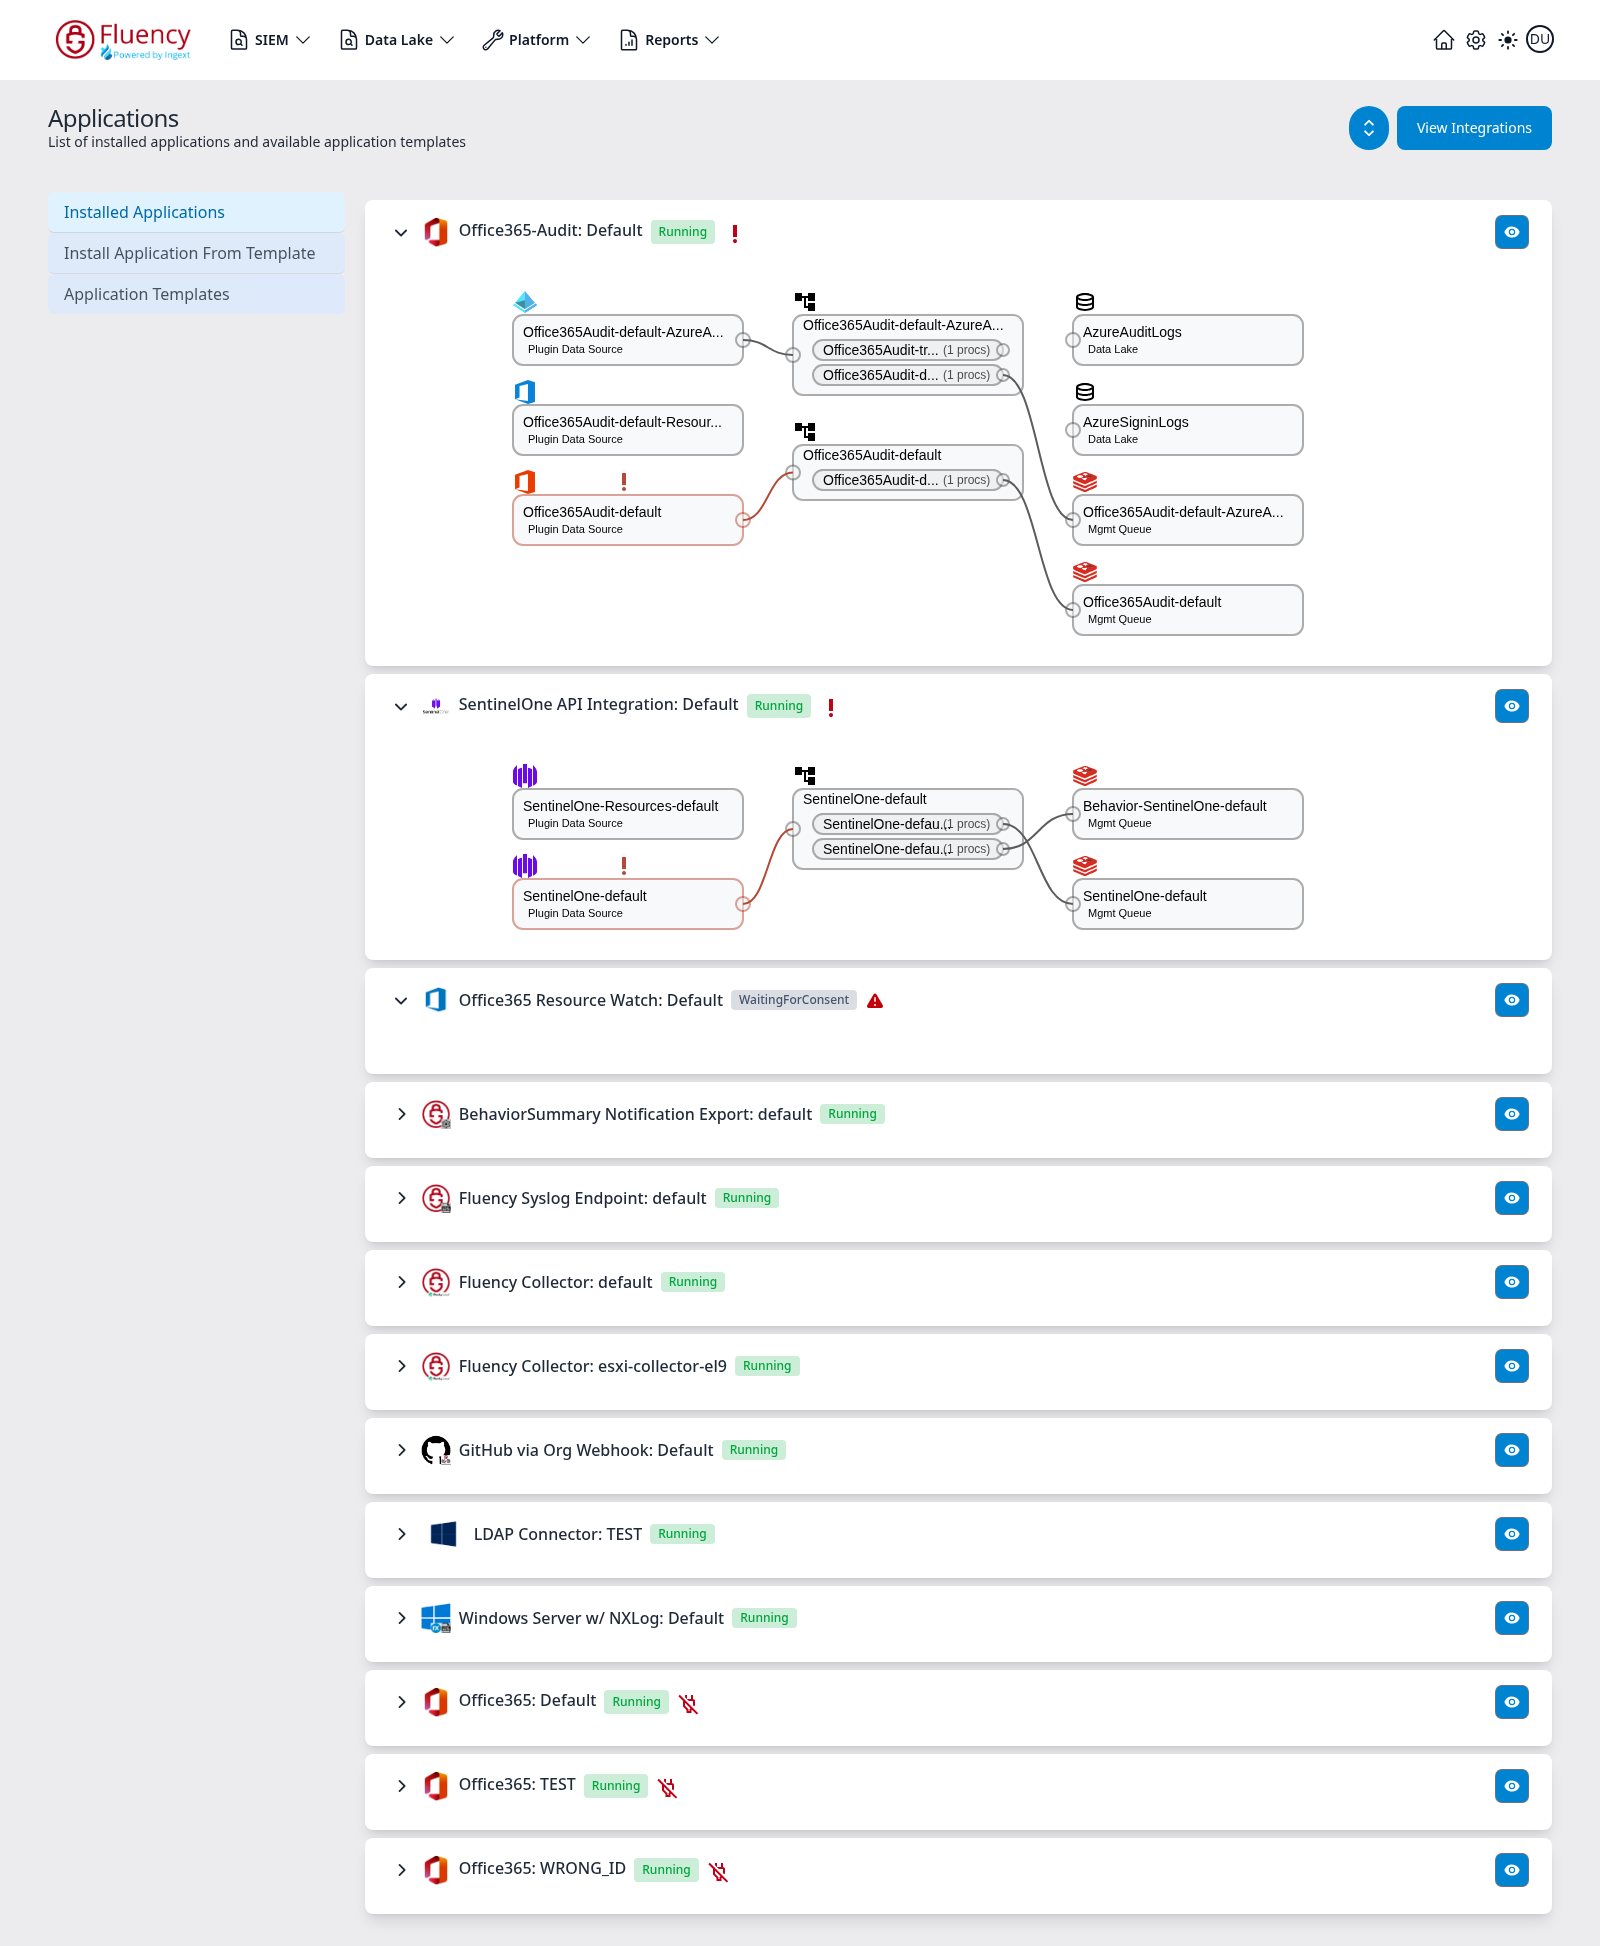
The round chevron button in the page header expands or collapses every card at once; its tooltip flips between Expand All and Collapse All.
What a healthy application looks like
A healthy application carries a green Running status badge. Expanding its card draws the pipeline it installed, left to right from source to destination, each node labelled with its object name and object type, most nodes carrying a small throughput sparkline of recent volume. Outlines and connectors are colour-coded: green where data is flowing, grey where the path is idle, red on a node that is in error.
For this quickstart's application the diagram has three Plugin Data Source nodes — one per collection path — feeding two routers, which fan out to Data Lake and Mgmt Queue destinations.
The details panel behind the eye button is titled Viewing Office365Audit Application. It opens with Details — Application (the template it was installed from), Name, Display Name, and the Status badge — followed by the Parameters the application was installed with, shown back as tenantID, clientId, clientSecret (masked), datalake, index, and azureAuditIndex, and an Actions list of every pipeline object the install created.
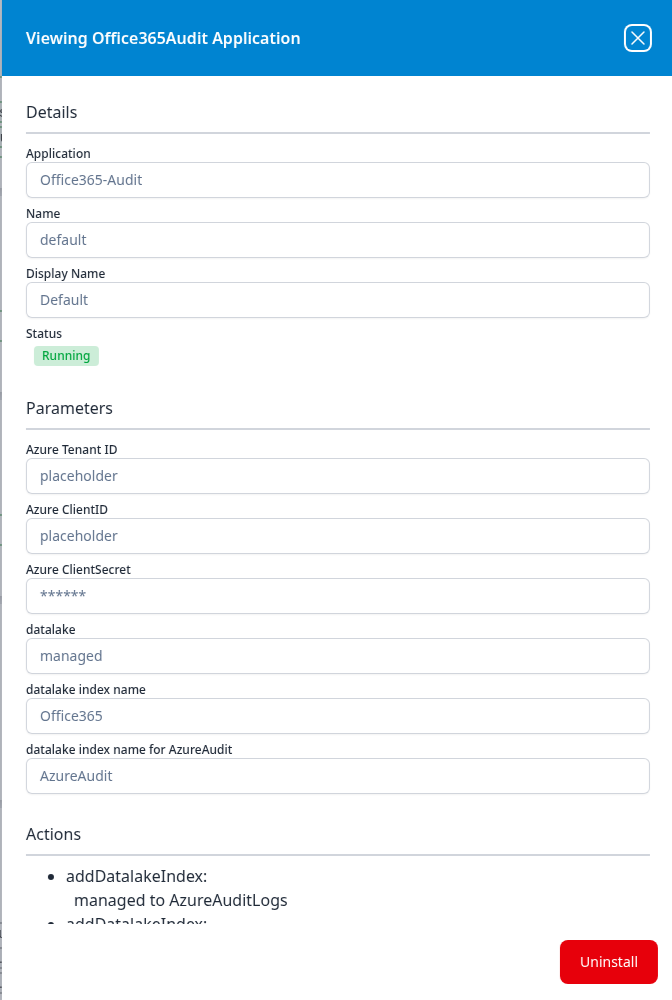
Every field in this panel is read-only. Changing a credential means uninstalling with the red Uninstall button and installing again.
What an unhealthy application looks like
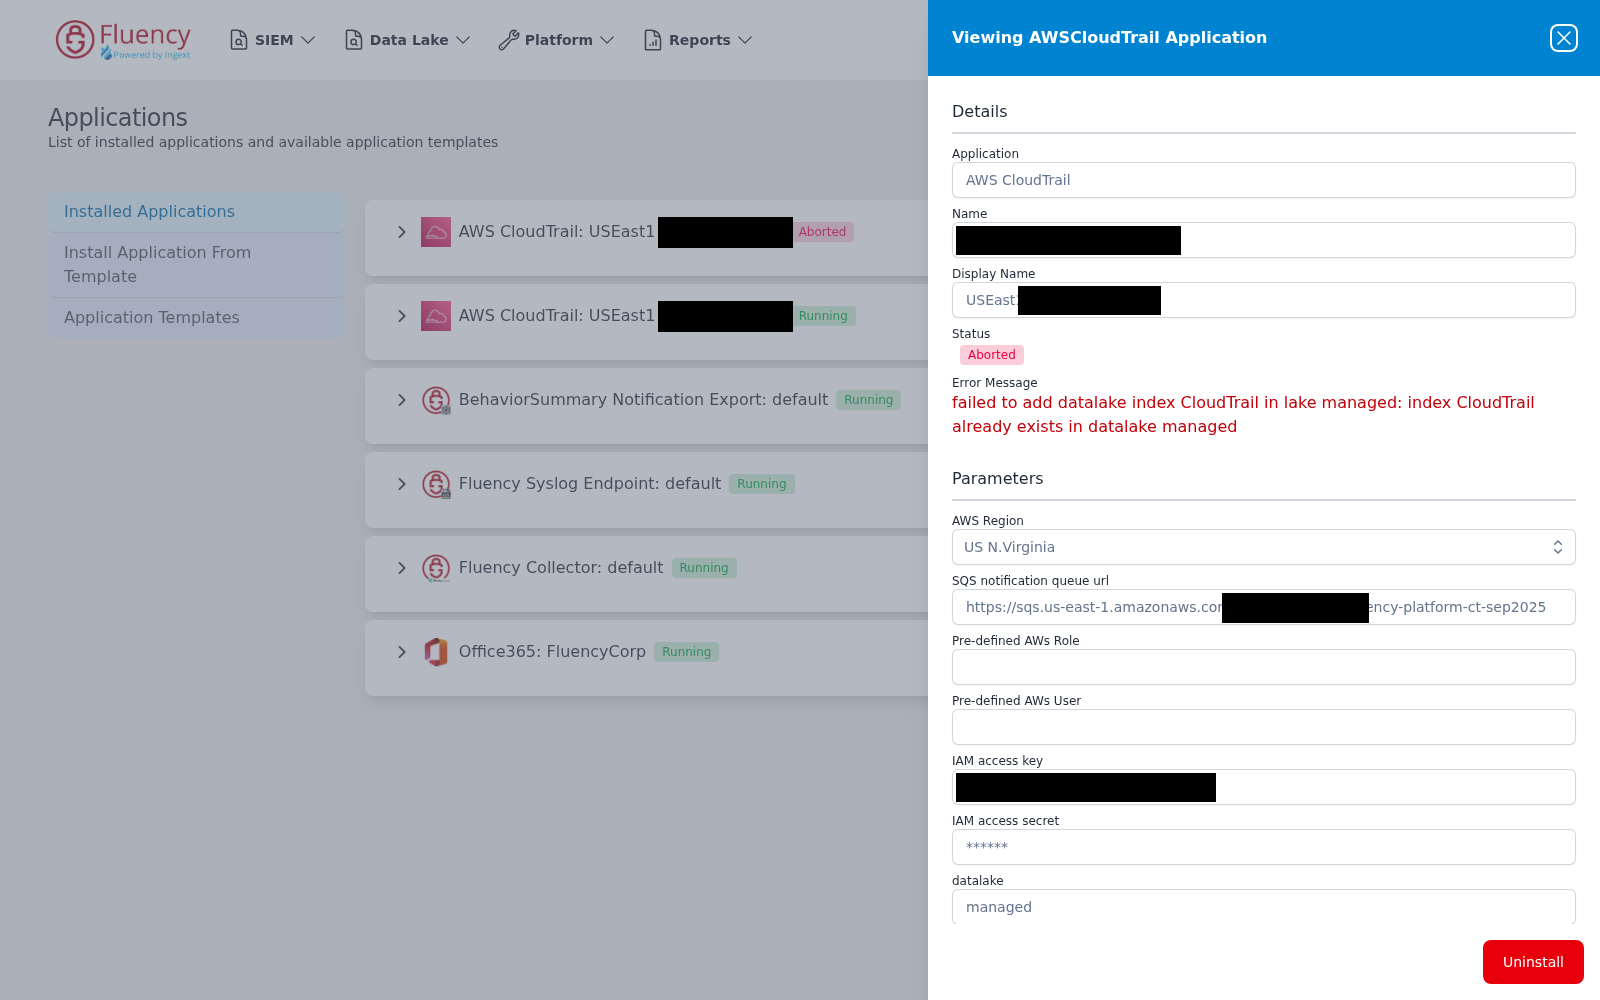
- A red Aborted badge means the application stopped on an error. Its details panel adds an Error Message in red under Details explaining why — a data lake index name already taken in that lake being the usual cause.
- A red exclamation mark (!) after an otherwise-Running badge marks a component that is not healthy even though the application as a whole is still running. It matches a red-outlined node in that application's pipeline diagram, which tells you which stage to look at.
- Running, no error, no green outlines, and no sparkline volume is the "running but idle" case: the application is trying and nothing is arriving. That is normal inside the first-content window described above. Once past it, move on to check 2.
Check 2 — Usage Ingress Charts
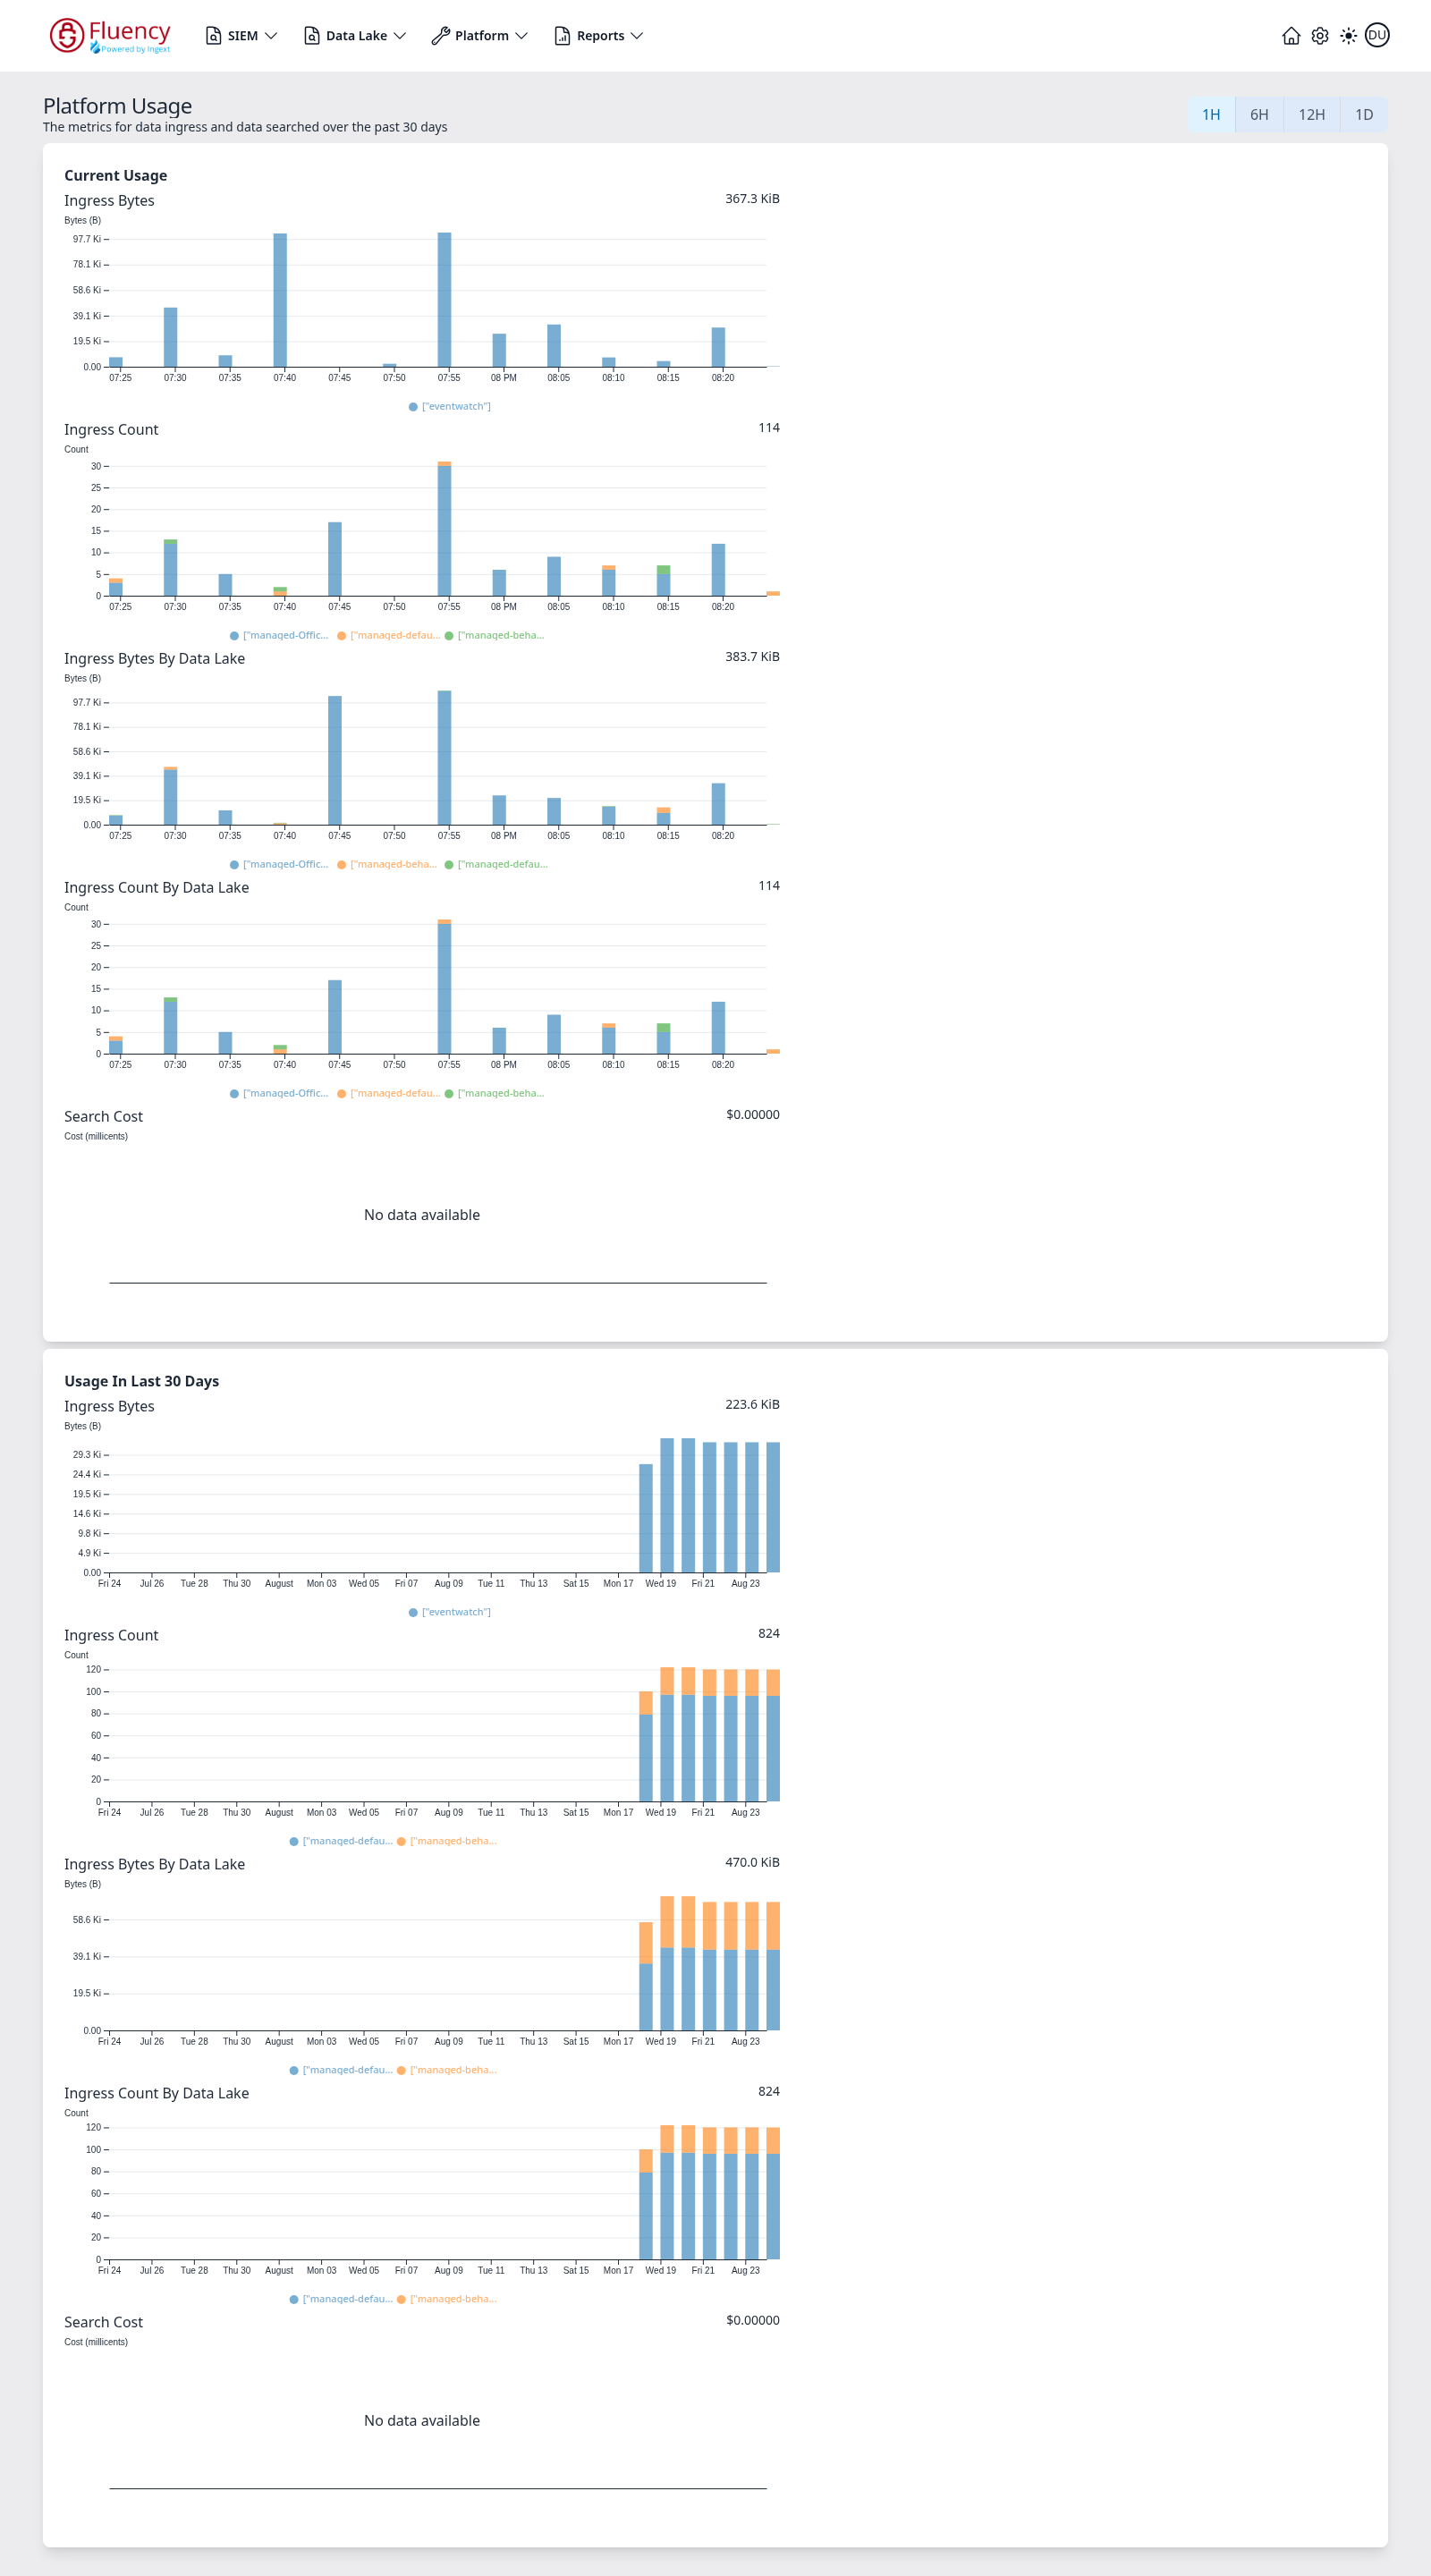
- Open Platform → Usage.
- Set the time range for the Current Usage panel with the 1H, 6H, 12H, or 1D buttons — 1H is the default and the right choice for a source connected minutes ago.
- Read the Ingress Bytes and Ingress Count charts.
- Read Ingress Bytes By Data Lake and Ingress Count By Data Lake to confirm the data landed in the indexes you expected.
Reading the charts
The page is titled Platform Usage, subtitled The metrics for data ingress and data searched over the past 30 days, and holds two panels of five bar charts each — Current Usage, which follows the time-range buttons, and Usage In Last 30 Days, which is fixed at thirty days. Every chart shows its unit beneath the title, its total for the window on the right, and a legend beneath identifying the series:
- Ingress Bytes — bytes ingested per interval (Bytes (B)).
- Ingress Count — events ingested per interval (Count), stacked with one legend entry per data lake index.
- Ingress Bytes By Data Lake and Ingress Count By Data Lake — the same two measures stacked by data lake index.
- Search Cost — the cost of bytes scanned by searches, in Cost (millicents).
Hovering over a bar shows a tooltip with the series name, the Time of the interval, and the Value — a bytes figure such as 14.7 MiB. Long index names in the legends are truncated with an ellipsis.
The by-data-lake charts are the useful ones here, because they answer a question the totals cannot: on a three-index application, they tell you which of Office365, AzureAudit, and AzureSigninLogs is actually contributing. Two of three filling while the third stays flat is the expected shape in the first few hours, and also the expected steady state on a tenant with no premium Entra licence.
What "no data available" means here
A chart with nothing to plot displays No data available in place of the bars. On a fresh instance that is the normal state of Search Cost — nobody has searched yet — and it is not a problem.
On the ingress charts, distinguish three cases before concluding anything is wrong: a time range too narrow to include the first delivery, a first poll that has not completed, and a source that is genuinely sending nothing. The first two are answered by widening the range to 1D — or reading the Usage In Last 30 Days panel — and waiting; the third is a source-side question.
Check 3 — Data Lake Index State
- Open Data Lake → Management.
- Find the lake and the indexes your application writes to —
Office365,AzureAudit, andAzureSigninLogs. - Read each index card.
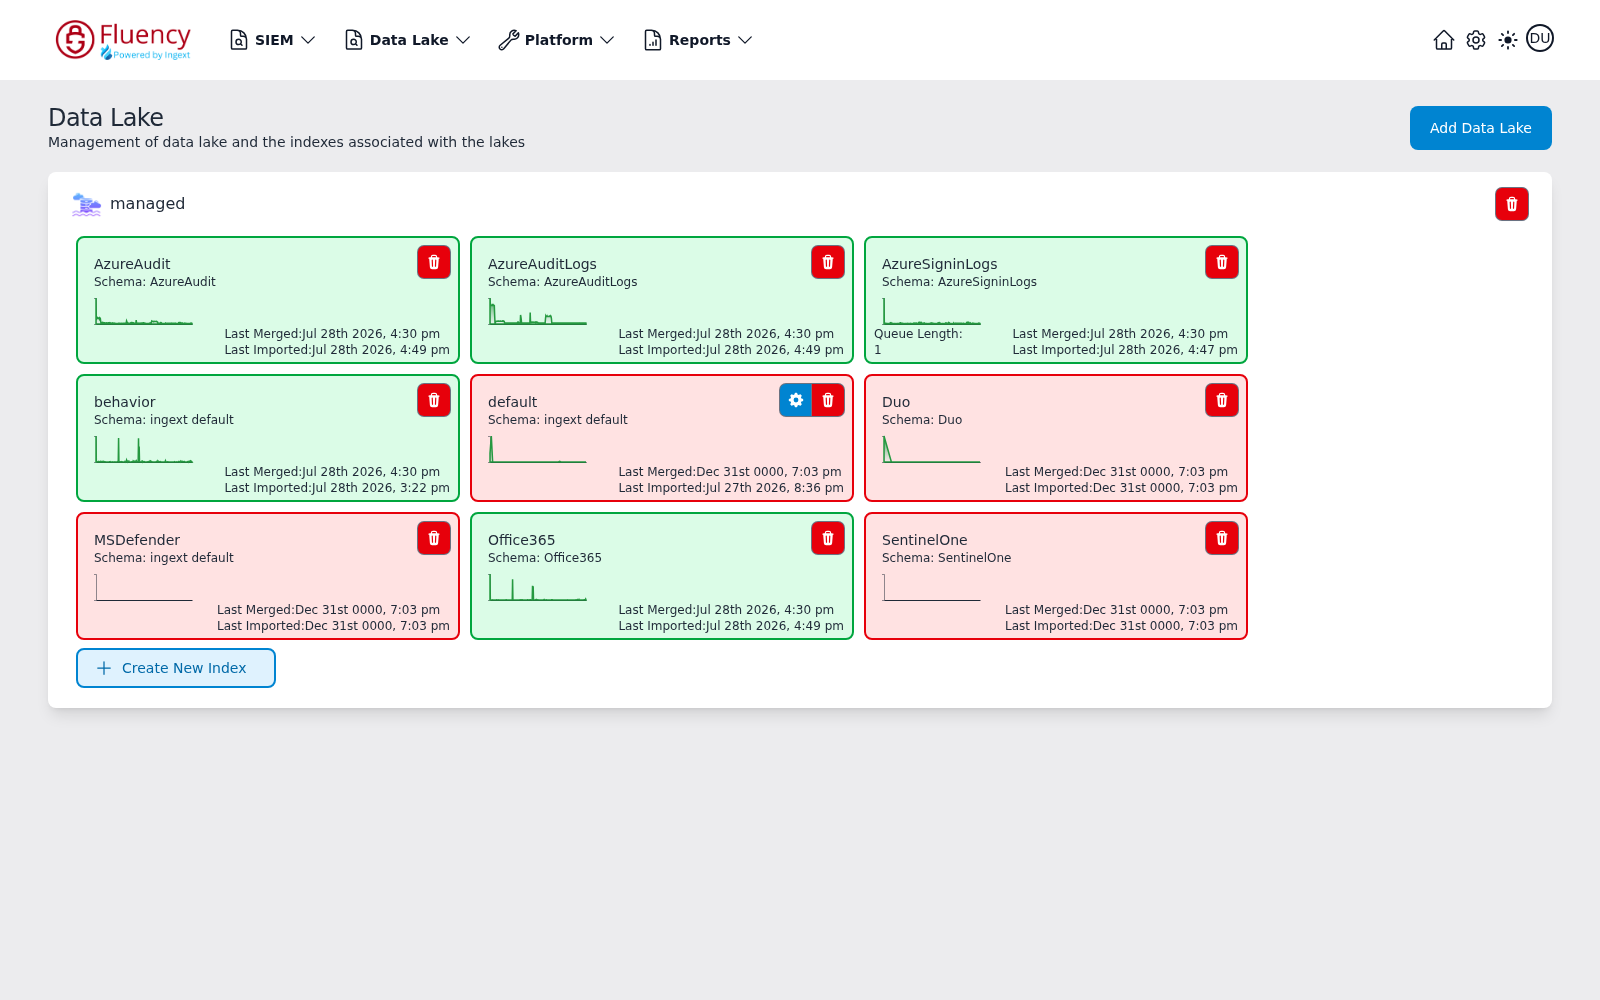
The page shows one panel per data lake, headed with the lake name, holding a grid of index cards listed alphabetically. Each card summarizes one index:
- The index name and the schema it uses (Schema: followed by the schema name).
- An activity sparkline of recent ingest volume.
- Last Merged and Last Imported timestamps.
- A Queue Length counter, shown only when events are waiting to be imported.
Reading the card colour — carefully
Card colour reflects merge state, not import state. A card is green once the index has been merged, and red while its Last Merged value is still the zero-date placeholder Dec 31st 0000.
A red card can carry a perfectly real Last Imported timestamp — that is an index where data has arrived but has not yet been merged into it. Reading red as "nothing arrived" and re-opening an ingest investigation that is already solved is the most common mistake on this page. Read the two timestamps, not the colour.
So for a brand-new install, the sequence you should expect to see on each index card is:
- Red, both timestamps at the zero date — the index exists, nothing has arrived yet.
- Red, with a real Last Imported — data is arriving. This is a healthy intermediate state.
- Green, with both timestamps recent — data has arrived and been merged.
What queue length tells you
The Queue Length counter appears only when events are waiting to be imported. A queue that appears during a burst and drains is normal, and on a first backfill it is what you want to see. A queue that only ever grows is the signal that ingestion is outrunning writing — capture the number and raise a support ticket rather than changing anything.
No counter at all is the normal steady state, meaning nothing is waiting. It is only good news if checks 1 and 2 also show activity: an index with an empty queue and no ingress is simply an index nothing is reaching.
How to Tell It Worked
All three checks agreeing is the pass condition:
- The application is installed, badged Running, with green outlines on its pipeline diagram.
- The Usage page shows non-zero Ingress Bytes and Ingress Count within the last day, attributed to the expected indexes.
- The Management page shows the three indexes, with a real Last Imported on at least one and no persistently growing queue.
Two of three passing is enough to continue if the third is the Office 365 index still inside its first-content window.
If It Did Not Work
| What you see | What it means | Where to go |
|---|---|---|
| Application Aborted | A credential or configuration error; the red error message names the cause | Back to step 2 |
| Application Running, no ingress, and it is past the first-content window | The platform is connected and the source is producing nothing it can read | Verify unified audit logging is on, and that the nine permissions all read Granted |
| Ingress present, but in the wrong index | A sink pointed at the wrong destination, or an index name changed at install | Check the application's Parameters in its details panel |
| Ingress present, queue only ever grows | A storage-side or capacity problem | Capture the counter value and raise a support ticket |
| Everything looks right, but the volume is implausibly small | Filtering in a pipe, or a source scoped more narrowly than intended | No data arriving |
AzureSigninLogs alone is empty | The tenant has no Entra ID P1 or P2 licence | Expected — nothing to fix |
Next Step
4. Run Your First Search — go find the events you just confirmed.
Related
- Platform → Applications, Platform → Usage, Data Lake → Management — the three pages this step uses, control by control
- No Data Arriving — the full diagnostic path when a source goes quiet
- Data Storage — how indexes and retention work
- Key Concepts — ingress, storage, and scanned volume defined
- FAQ