No Data Arriving
"We're not seeing logs from X" is the most common support case in any SIEM, and it is almost never one problem — it is any of eight or nine independent failures that all present identically. This page works down the layers between the source system and a queryable event, giving the check that confirms or eliminates each one. Do them in order; the value of the method is that each confirmed layer removes everything below it from consideration.
Work Down the Layers
Start at the source and work inward, confirming each layer before blaming the next:
- Is the source still generating and sending events? Check on the source system itself.
- Can the traffic reach the platform or collector — network path, port, and TLS?
- Is the collector healthy, registered and authenticated?
- Is the receiving port or endpoint configured to accept what is being sent?
- Is the application or integration running rather than aborted?
- Is the lake write succeeding, and is the queue draining?
- Is the search looking in the right index and time range?
Layers 1 and 2 are diagnosed on the source system and the network between it and the platform, and are outside what the interface can show you. The sections below cover the layers the platform itself reports on.
Collector Health
Is the Collector Online?
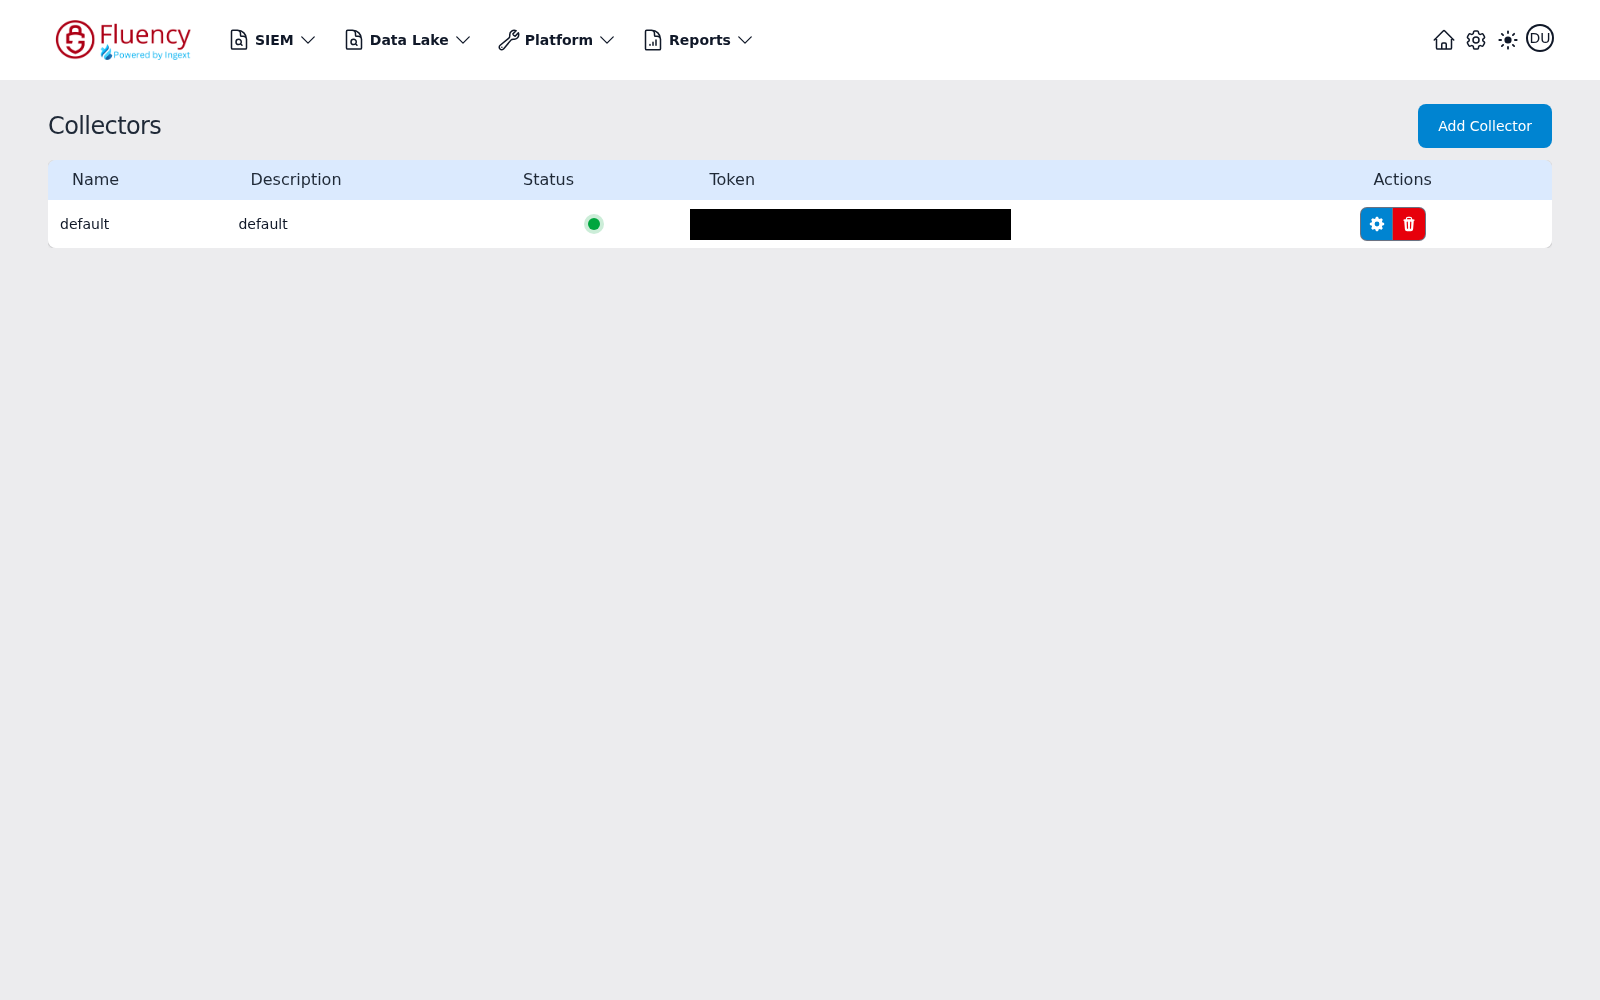
Check the collector's state from both ends: the platform's view on Platform → Administration → Collectors (/platform/collectors), and the collector console. The platform page is a table of the registered collectors with Name, Description, Status (an indicator dot showing the collector's current state), Token, and Actions columns.
Console access and the mgmt commands are covered in Collector Login.
Receiving Configuration
A listener has to exist for the port and the protocol the source is sending on. The failure worth naming explicitly is a protocol mismatch: UDP sent to a TCP listener, or the reverse, produces exactly the "nothing arrives" symptom with no error logged at either end. See Syslog Ports for the listener configuration and HEC for HTTP-delivered data.
Application and Integration State
The Status Badge
On Platform → Applications (/platform) each installed application is a card headed application type: instance name, carrying a status badge: green Running for a healthy instance, red Aborted for one that stopped on an error. A red exclamation mark (!) after the badge means the application is still running but one component inside it is not healthy — the matching node is outlined red in the card's pipeline diagram.
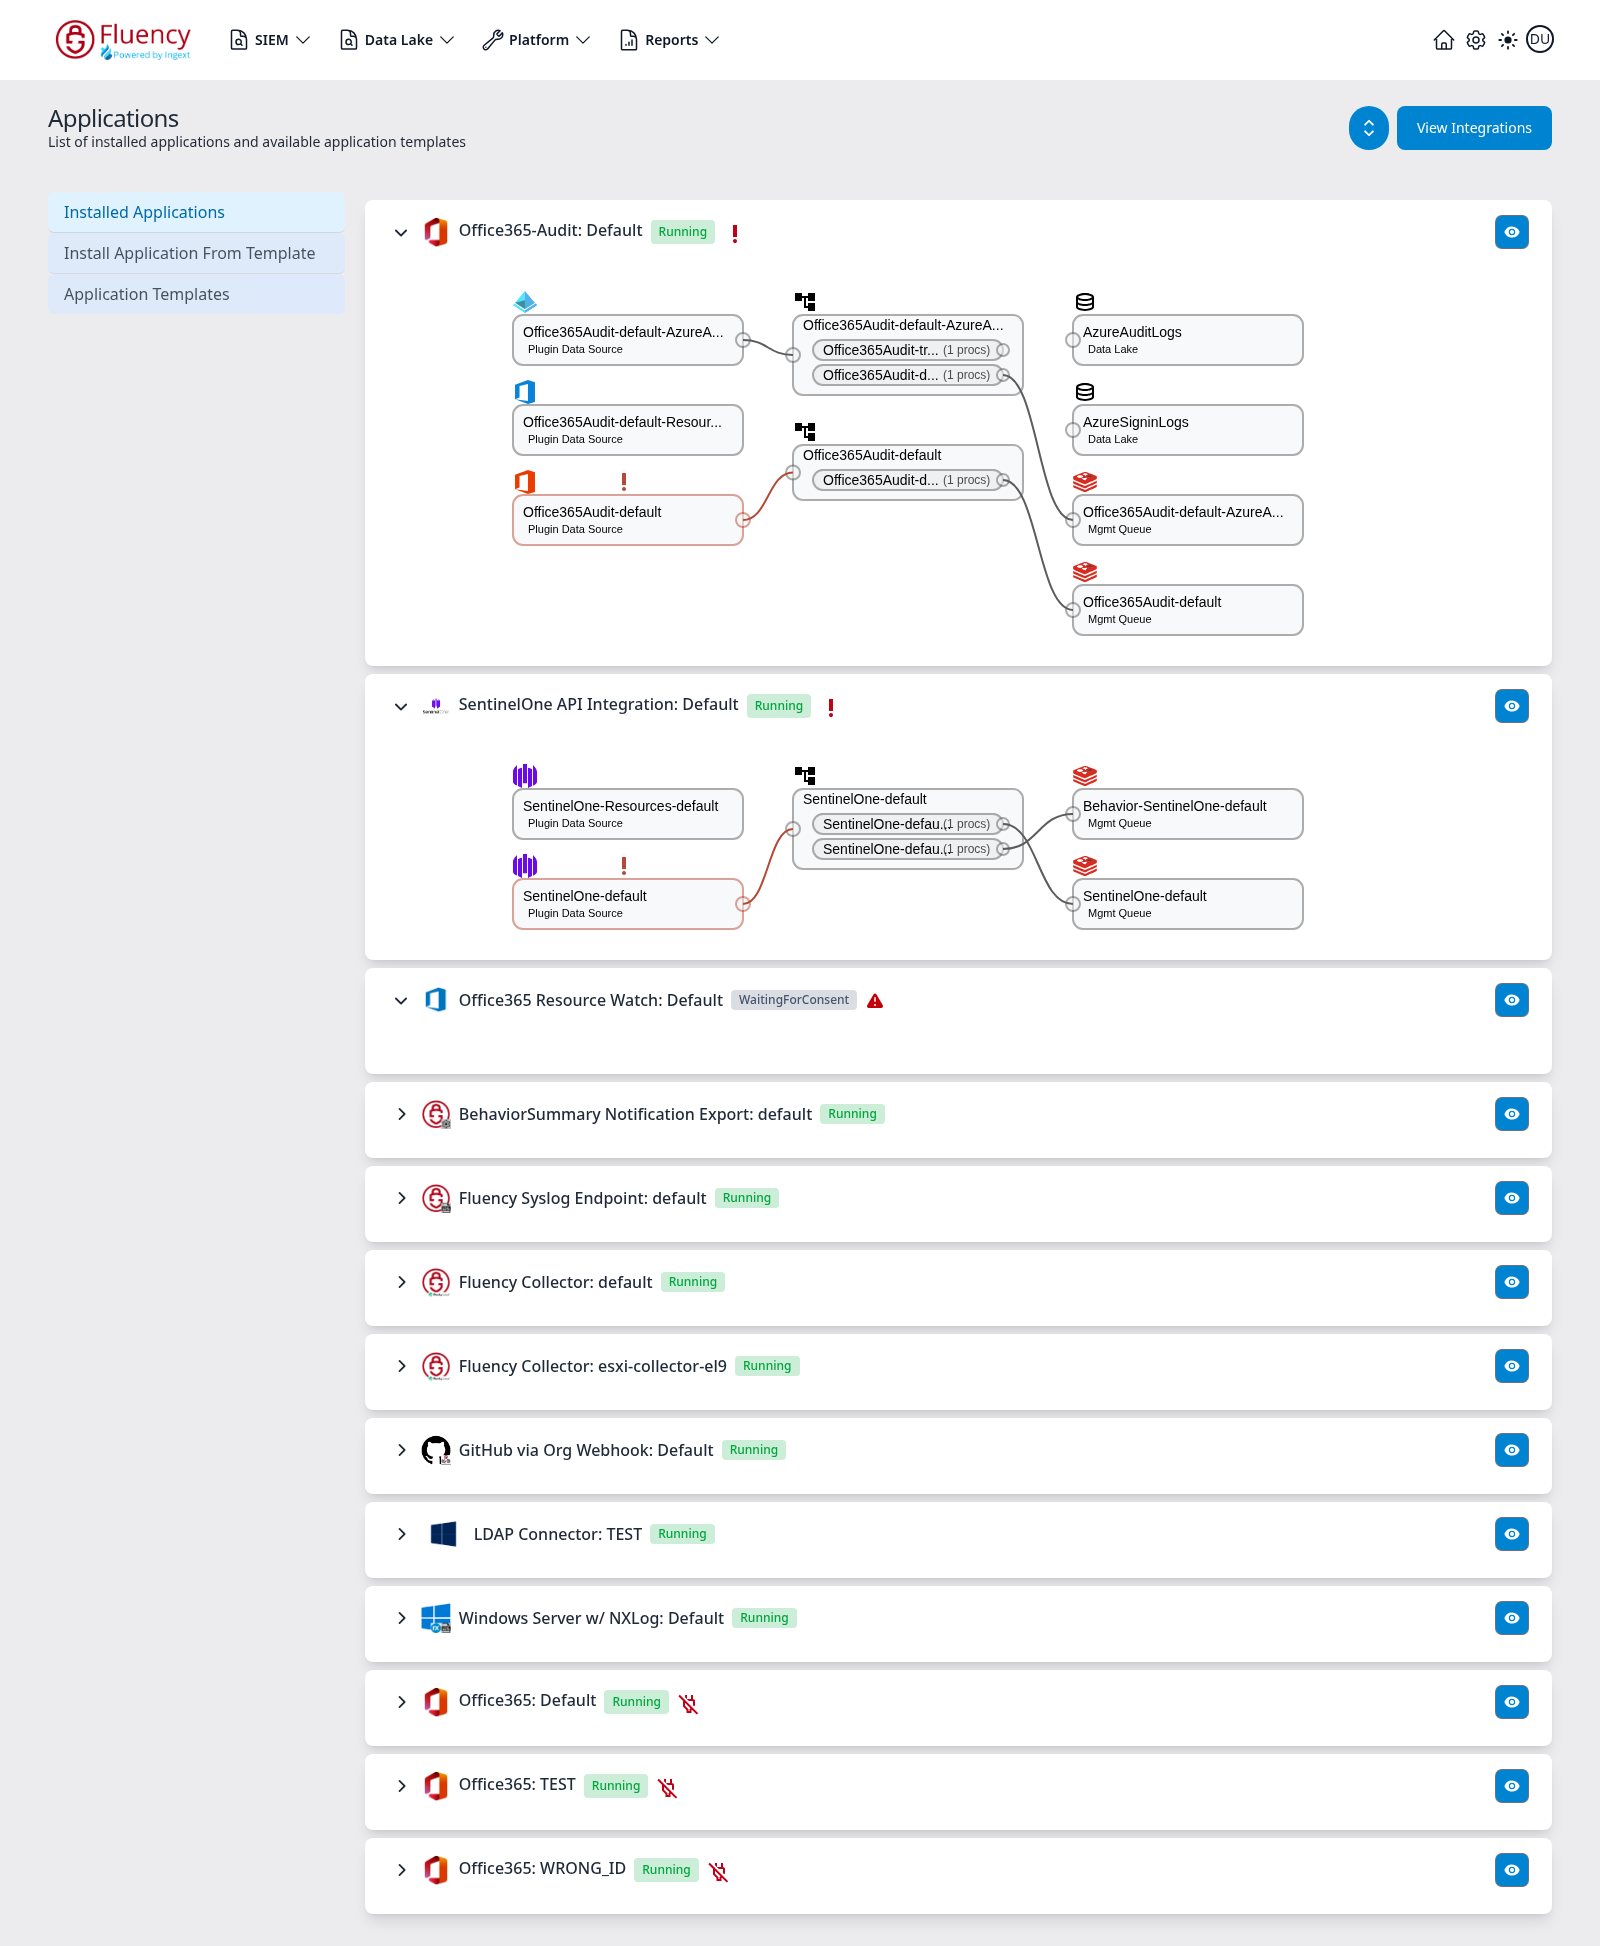
Click the blue eye button at the right edge of the card to open its details panel. On an aborted application the Details section carries an Error Message in red explaining why it stopped — a data-lake index name conflict, for example:
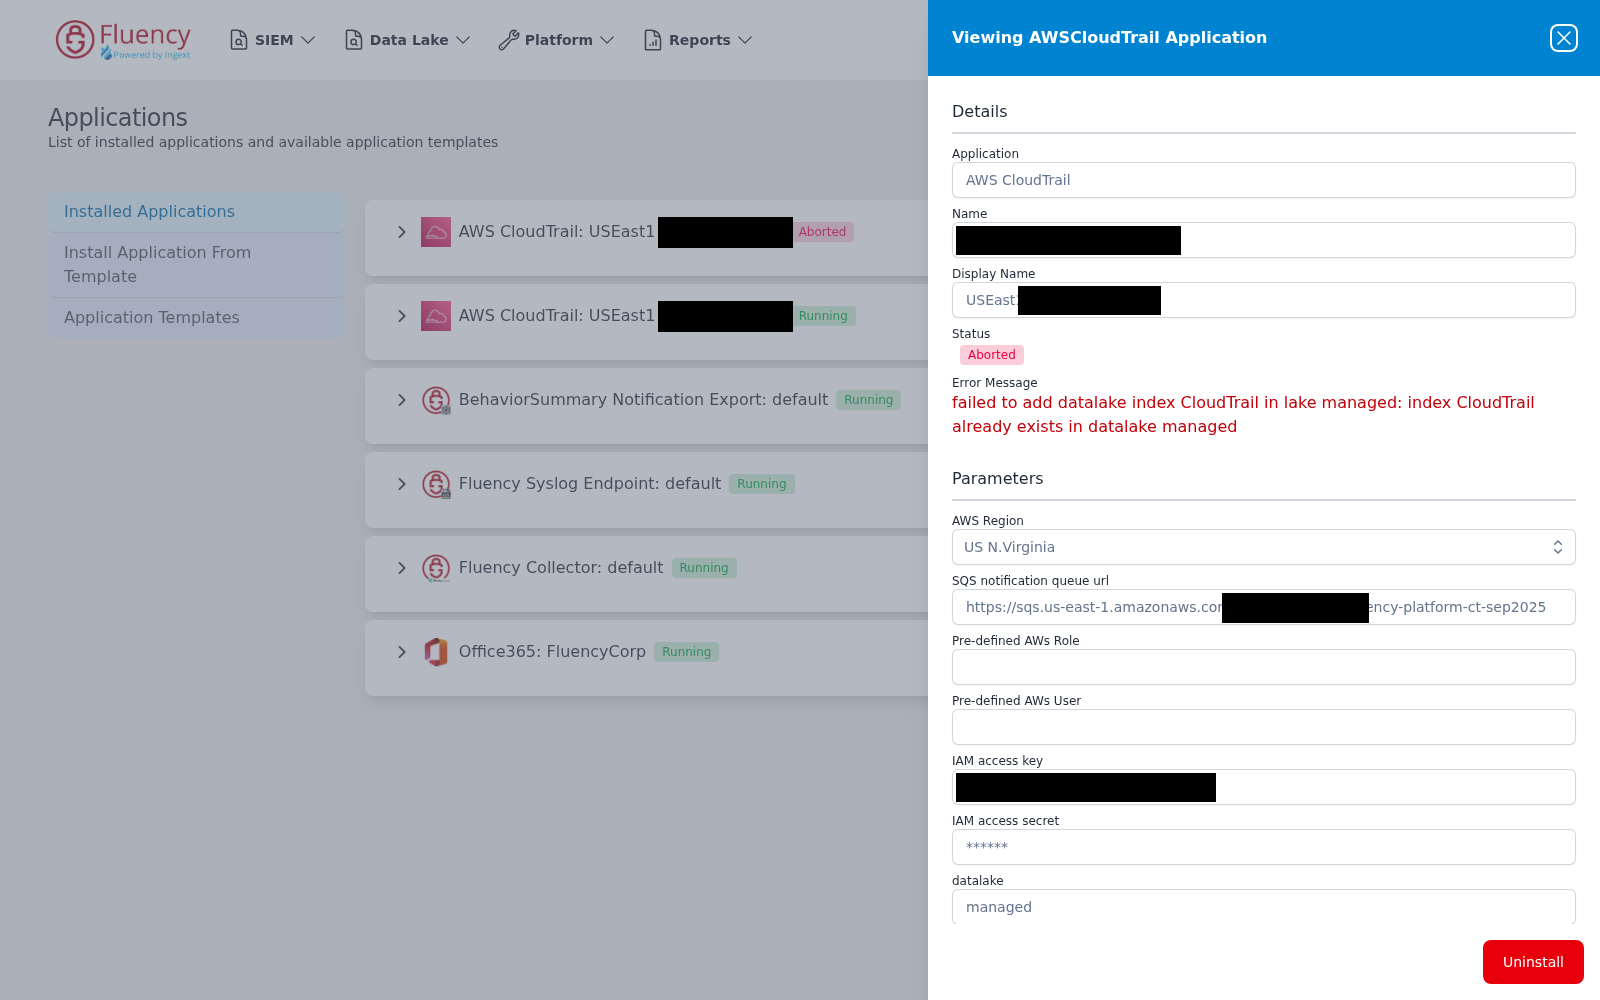
The panel also shows the Parameters the application was installed with (secrets masked) and the Actions the install performed, so you can confirm the values in play without reinstalling. Parameter values are read-only; to change one, uninstall the application and install it again.
Lake Write
Queue Length
Data Lake → Management (/dataLake/management) shows one panel per lake with a status card for each index in it. Every card gives the index name and its schema, an activity sparkline of recent ingest, Last Merged and Last Imported timestamps, and a Queue Length counter when events are waiting to be imported. Non-zero and stable is normal under load; non-zero and rising means the write side is not keeping up or is failing.
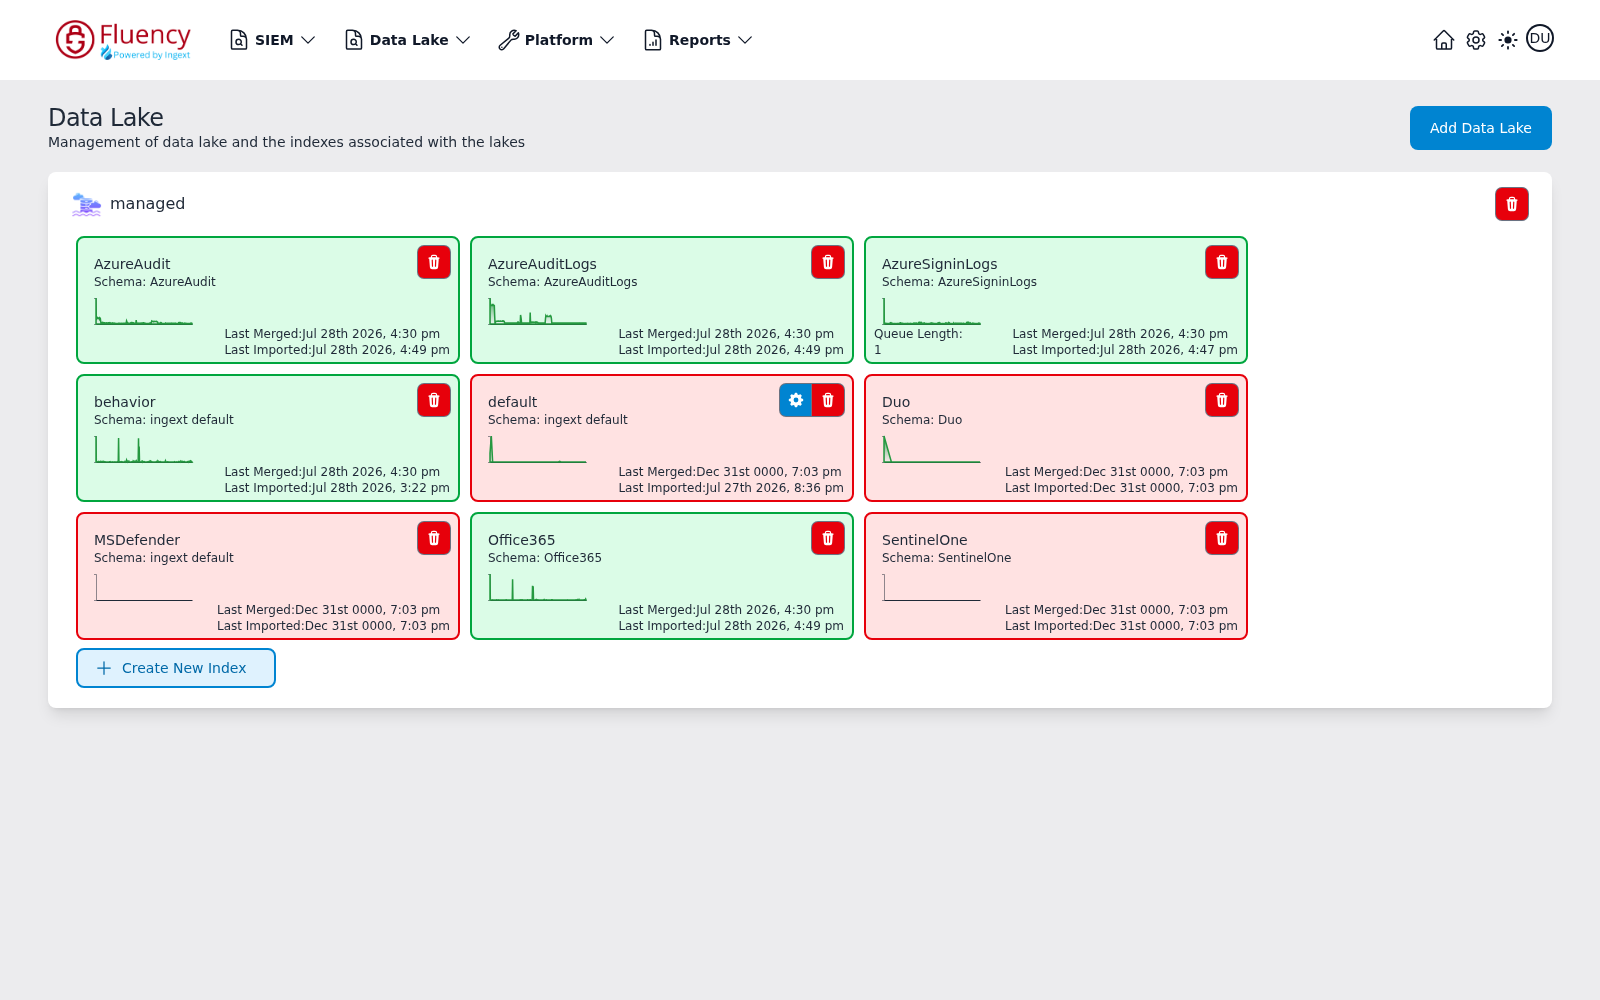
Card colour reflects merge state, not import state: a card is green once the index has been merged, and red while its Last Merged value is still the zero-date placeholder Dec 31st 0000. A red card with a real Last Imported timestamp means data is arriving and has simply not been merged yet — not that nothing arrived. Read the two timestamps, not the colour.
Lake Tasks
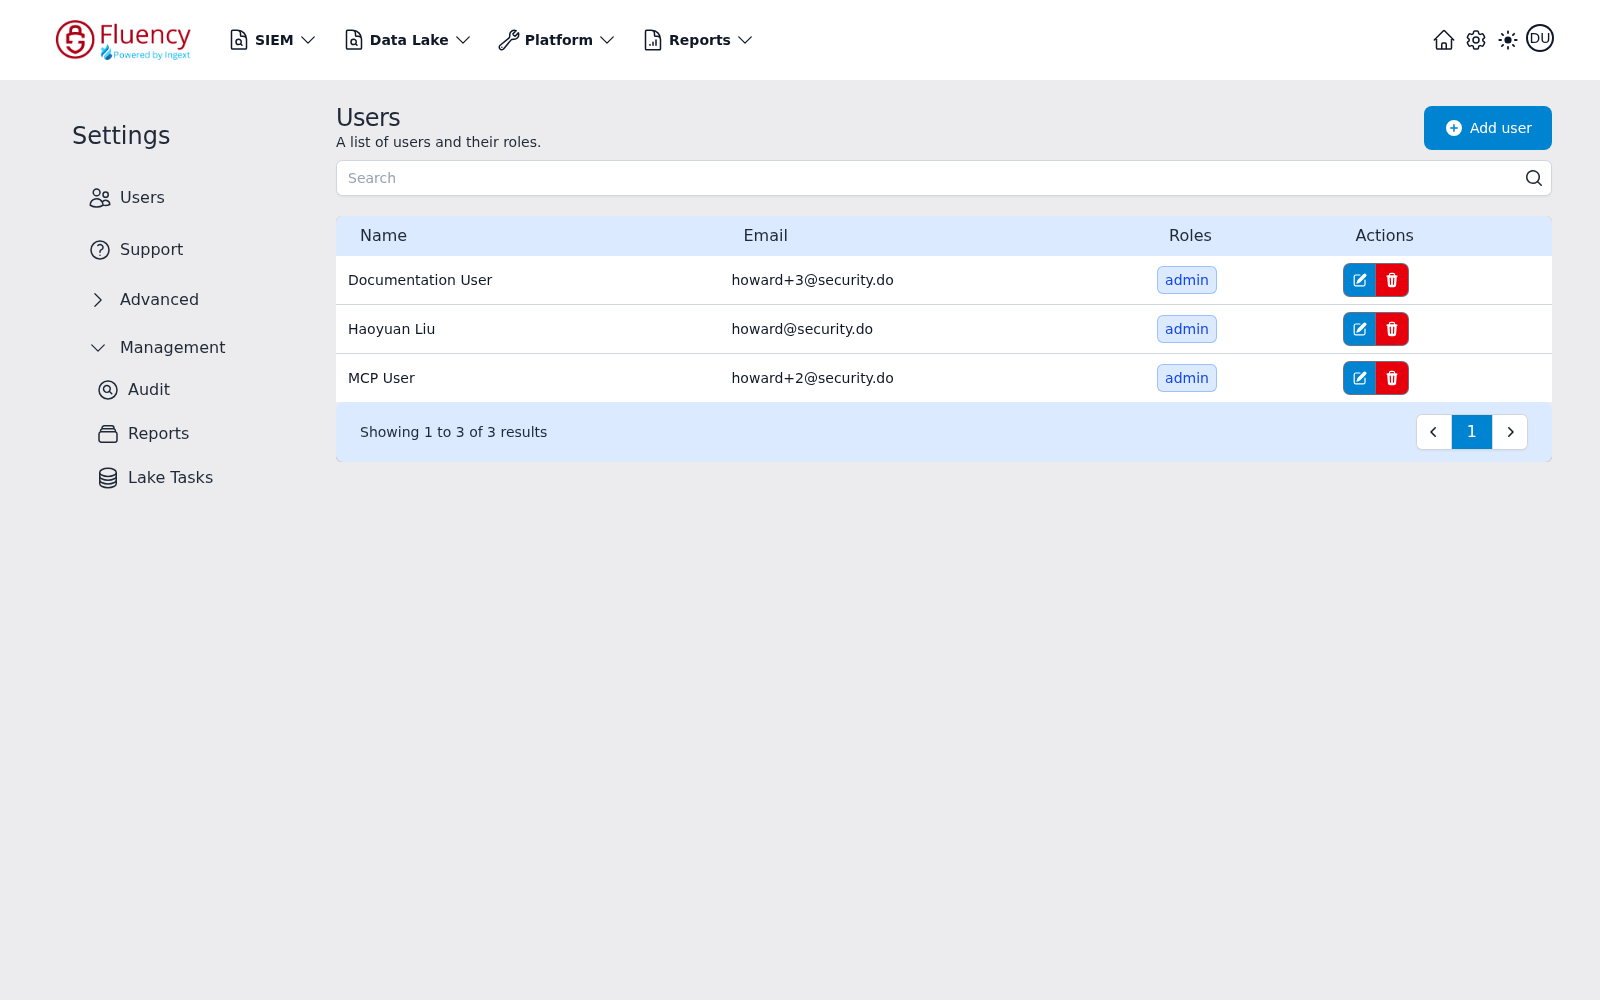
Checking Settings → Management → Lake Tasks for storage-side work that has failed or stalled. Lake Tasks sits in the Settings sidebar under the Management group, alongside Audit and Reports; the group is collapsed by default and expands in place when clicked.
You Are Looking in the Wrong Place
The layer everyone forgets, and a surprisingly large share of "missing data" cases.
Wrong Index
Searching the default index when the data landed in a per-source one. The index the search runs against is set by the leftmost control in the search bar on Data Lake → Search; click it to see the managed indexes configured for your organization and switch between them — managed-default plus a per-source index such as managed-Office365 or managed-CloudTrail.
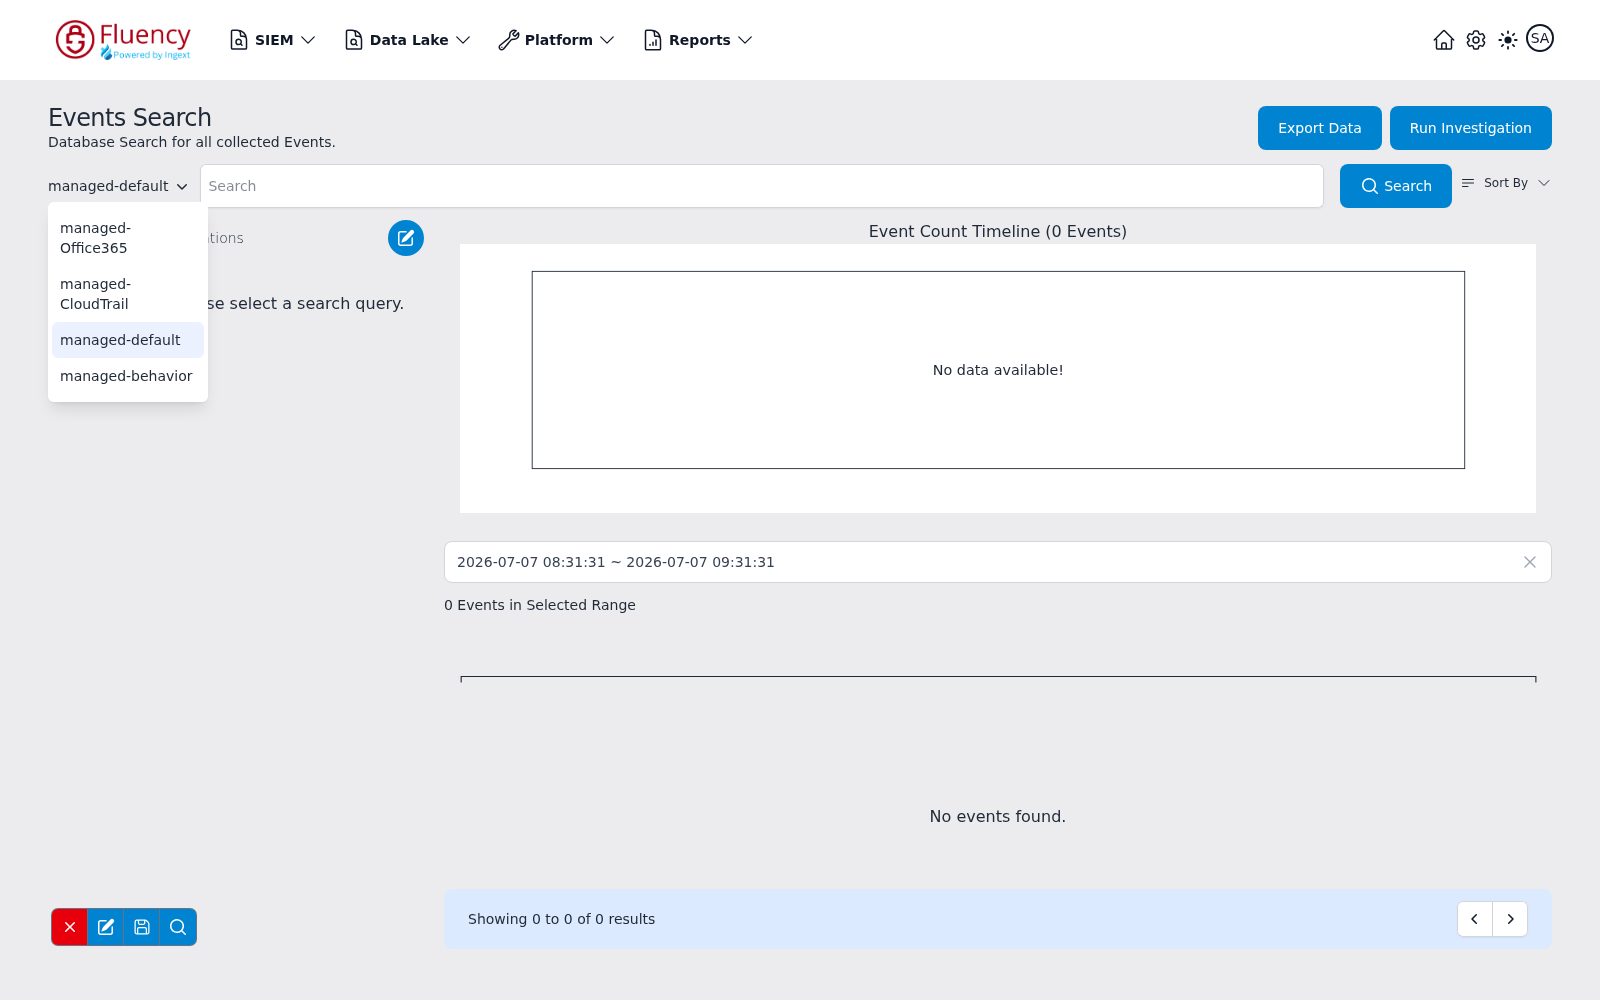
Picking a different index re-runs the search against it immediately, and also switches the facet panel to that source's facet configuration.
Wrong Time Range
Data present but outside the selected window — including the case where source timestamps are wrong, so events land far from "now". The Time Adjustment parser recipe is the fix for that.
Related
- Troubleshooting — the method and the diagnostic surfaces
- Data Collection — how each transport is meant to be configured
- Integrations — per-vendor integration setup
- Platform → Applications — application status and error messages