Search and Performance
Search problems come in two flavors that look unrelated but share a root cause: a search that returns nothing, and a search that returns everything at great expense. Both usually mean the search is pointed at the wrong data — the wrong index, the wrong window, or an unnecessarily wide scan. This page covers diagnosing empty results, controlling investigation cost, and working within query limits.
Searches Returning Nothing
Work down from the cheapest check to the most expensive.
Is the Data There at All?
The first bisect: drop all filters and search a narrow recent window on the target index. If that returns nothing, this is an ingest problem — go to No Data Arriving. If it returns rows, the problem is in the query.
Index Selection
The index selector — the leftmost control in the search bar on Data Lake → Search — determines what is searched at all. Data that landed in a per-source index will not appear in a search of the default index. Click the selector to list the managed indexes configured for your organization: managed-default plus a per-source index such as managed-Office365, managed-CloudTrail, or managed-behavior.
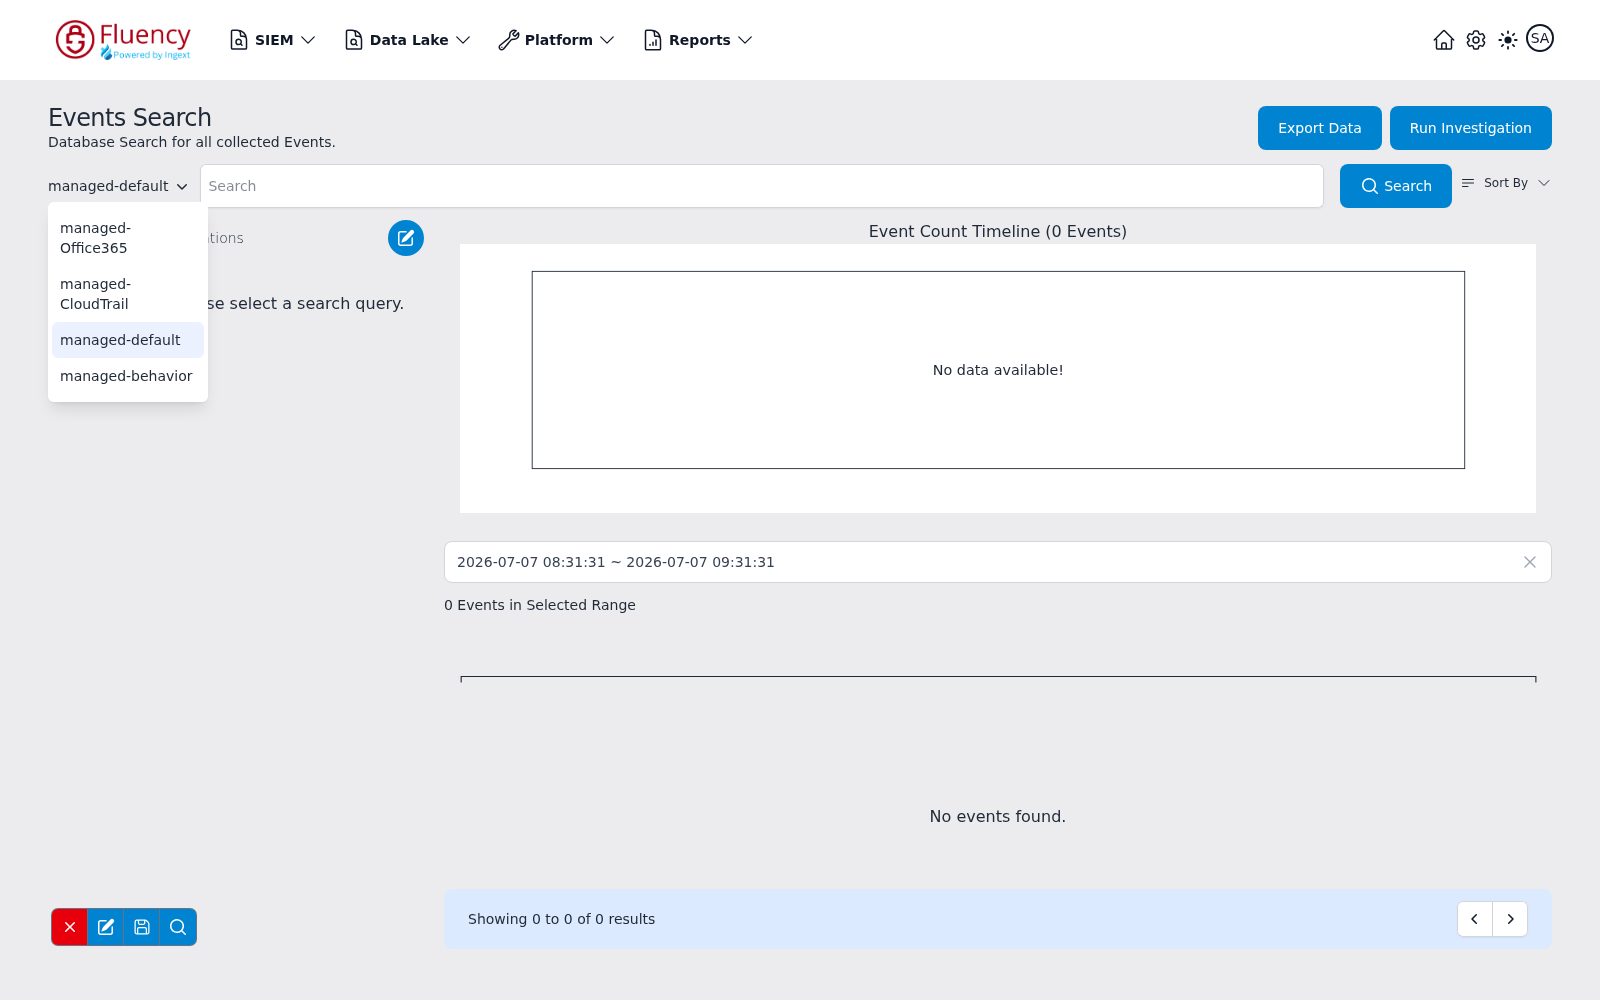
Picking a different index re-runs the search against it immediately and switches the facet panel to that source's facet configuration. The full set of indexes and which lake each belongs to is on Data Lake → Management, where every index in a lake appears as its own card. Data Lake → Management shows every index in every lake, which is how you work out where a given source writes.
Time Range
The most common cause of an empty result. The obvious case is too narrow a window. The subtle one is that an event's timestamp is the source's, not its arrival time, so a source with clock skew or a wrong timezone lands outside the window you are looking at — the Time Adjustment recipe is the fix.
Facet Filters Still Applied
Facet selections left over from a previous search silently narrow the current one. Active selections are the ones highlighted in the Facet Search Configurations panel, and the configuration currently loaded is named at the top of it. To clear them, use the facet toolbar at the bottom left of the Facet Search Configurations panel on Data Lake → Search — four small icon buttons: a red X (tooltip Reset Facet), a pencil that edits the configuration's fields, a floppy disk that saves the current setup as a named configuration, and a magnifier (tooltip Search) that re-runs the search with the current facet setup. The red X discards loaded facet data and selections and returns the panel to the selected configuration's facet groups with zero counts.
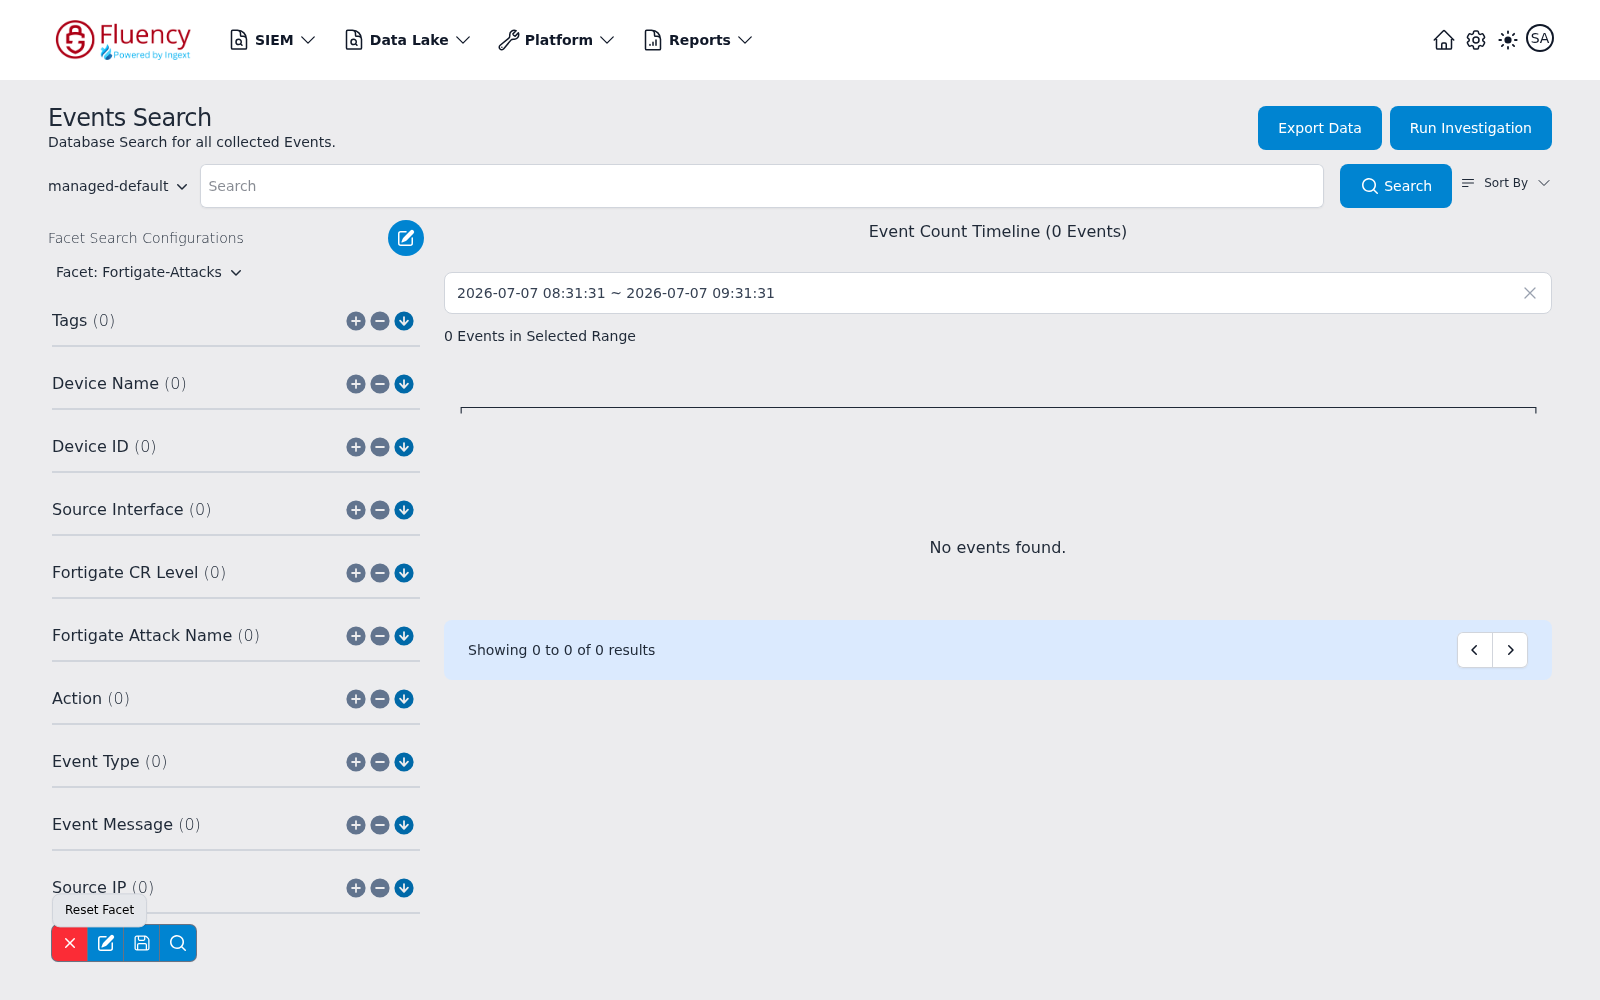
See Facets.
Searches That Cost Too Much
Where Cost Comes From
Cost follows bytes scanned, not rows returned. Everything else follows from that: narrow the scan, not the output.
Reading the Cost Estimate
Run Investigation, in the header of Data Lake → Search, opens the Investigation Search dialog, which previews the scope and cost of running the current search as an investigation before you start it. Its Search Preview section shows the time range to be searched, the Search Query the investigation will run, and then Total Event Count, Size of Search, Estimated Search Time, Archive Files Count, and Search Cost — the last an estimated dollar figure.
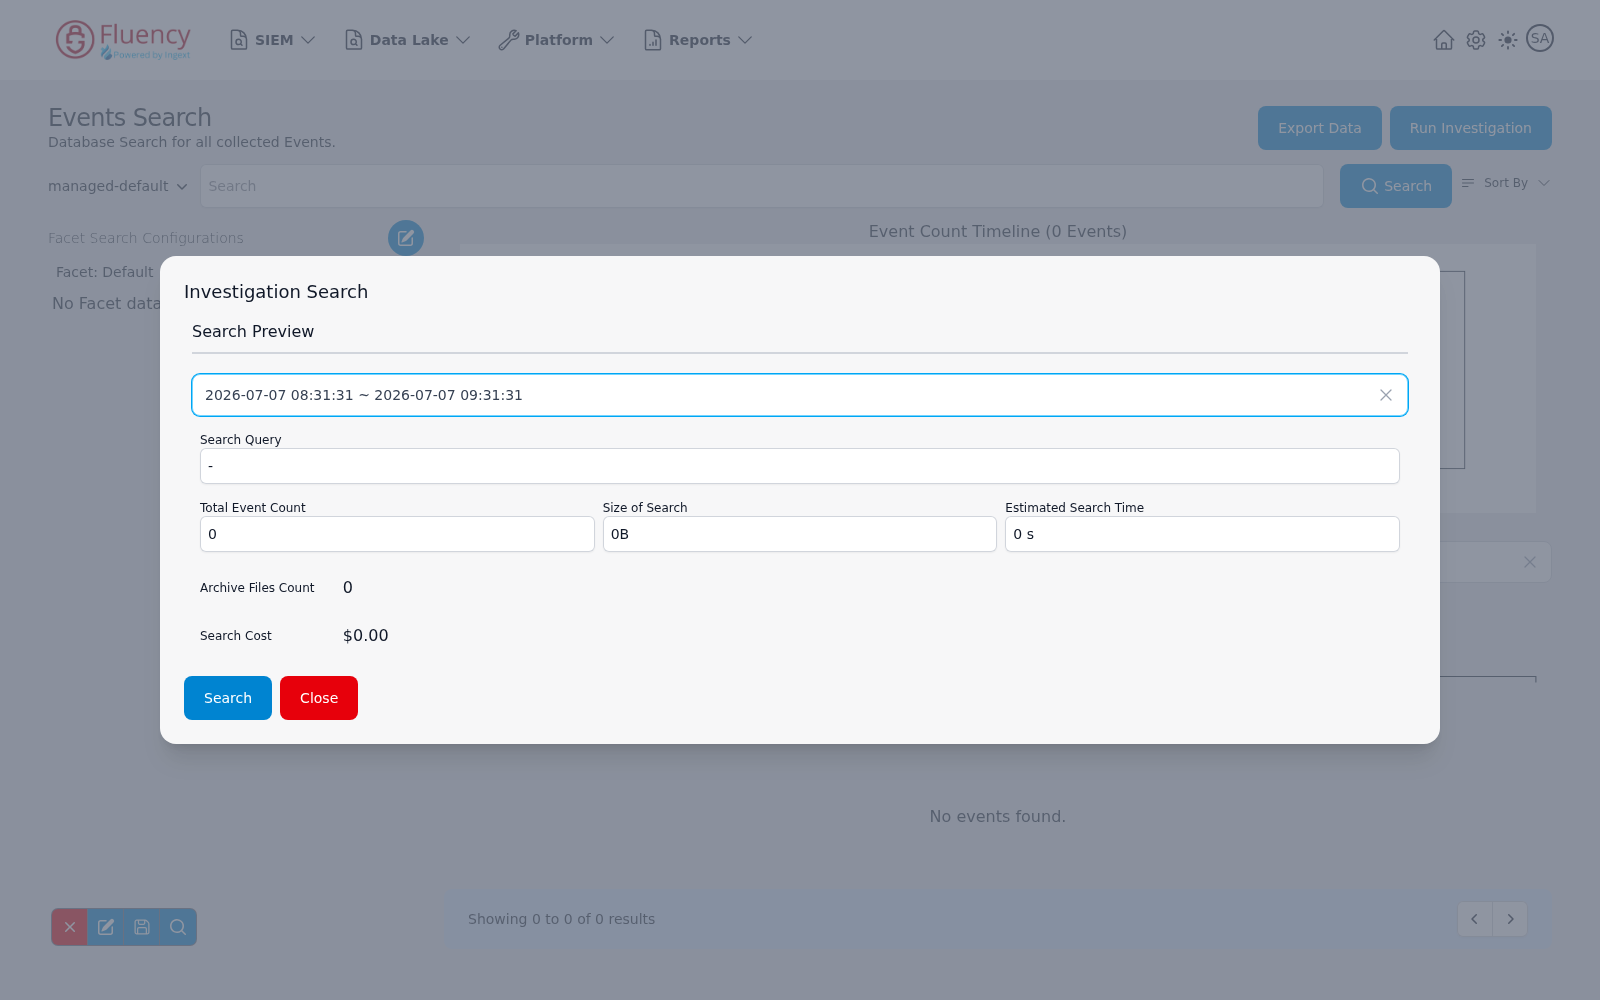
Search starts the run; Close dismisses the dialog without running it, which makes this a free estimate. Open it every time, not only when a search feels large.
Reducing the Scan
The techniques that actually help, in order of effect: shrink the time range, select a specific index, filter on indexed fields before free-text matching, and avoid leading wildcards.
Archive Searches
Archive Files Count in the same preview is the number of archive files a search will cover. Read it next to Size of Search and Search Cost rather than on its own — the three move together, and a count above zero is the signal that the run reaches beyond the immediately searchable data. Narrowing the time range is the control that brings it down.
Tracking Spend
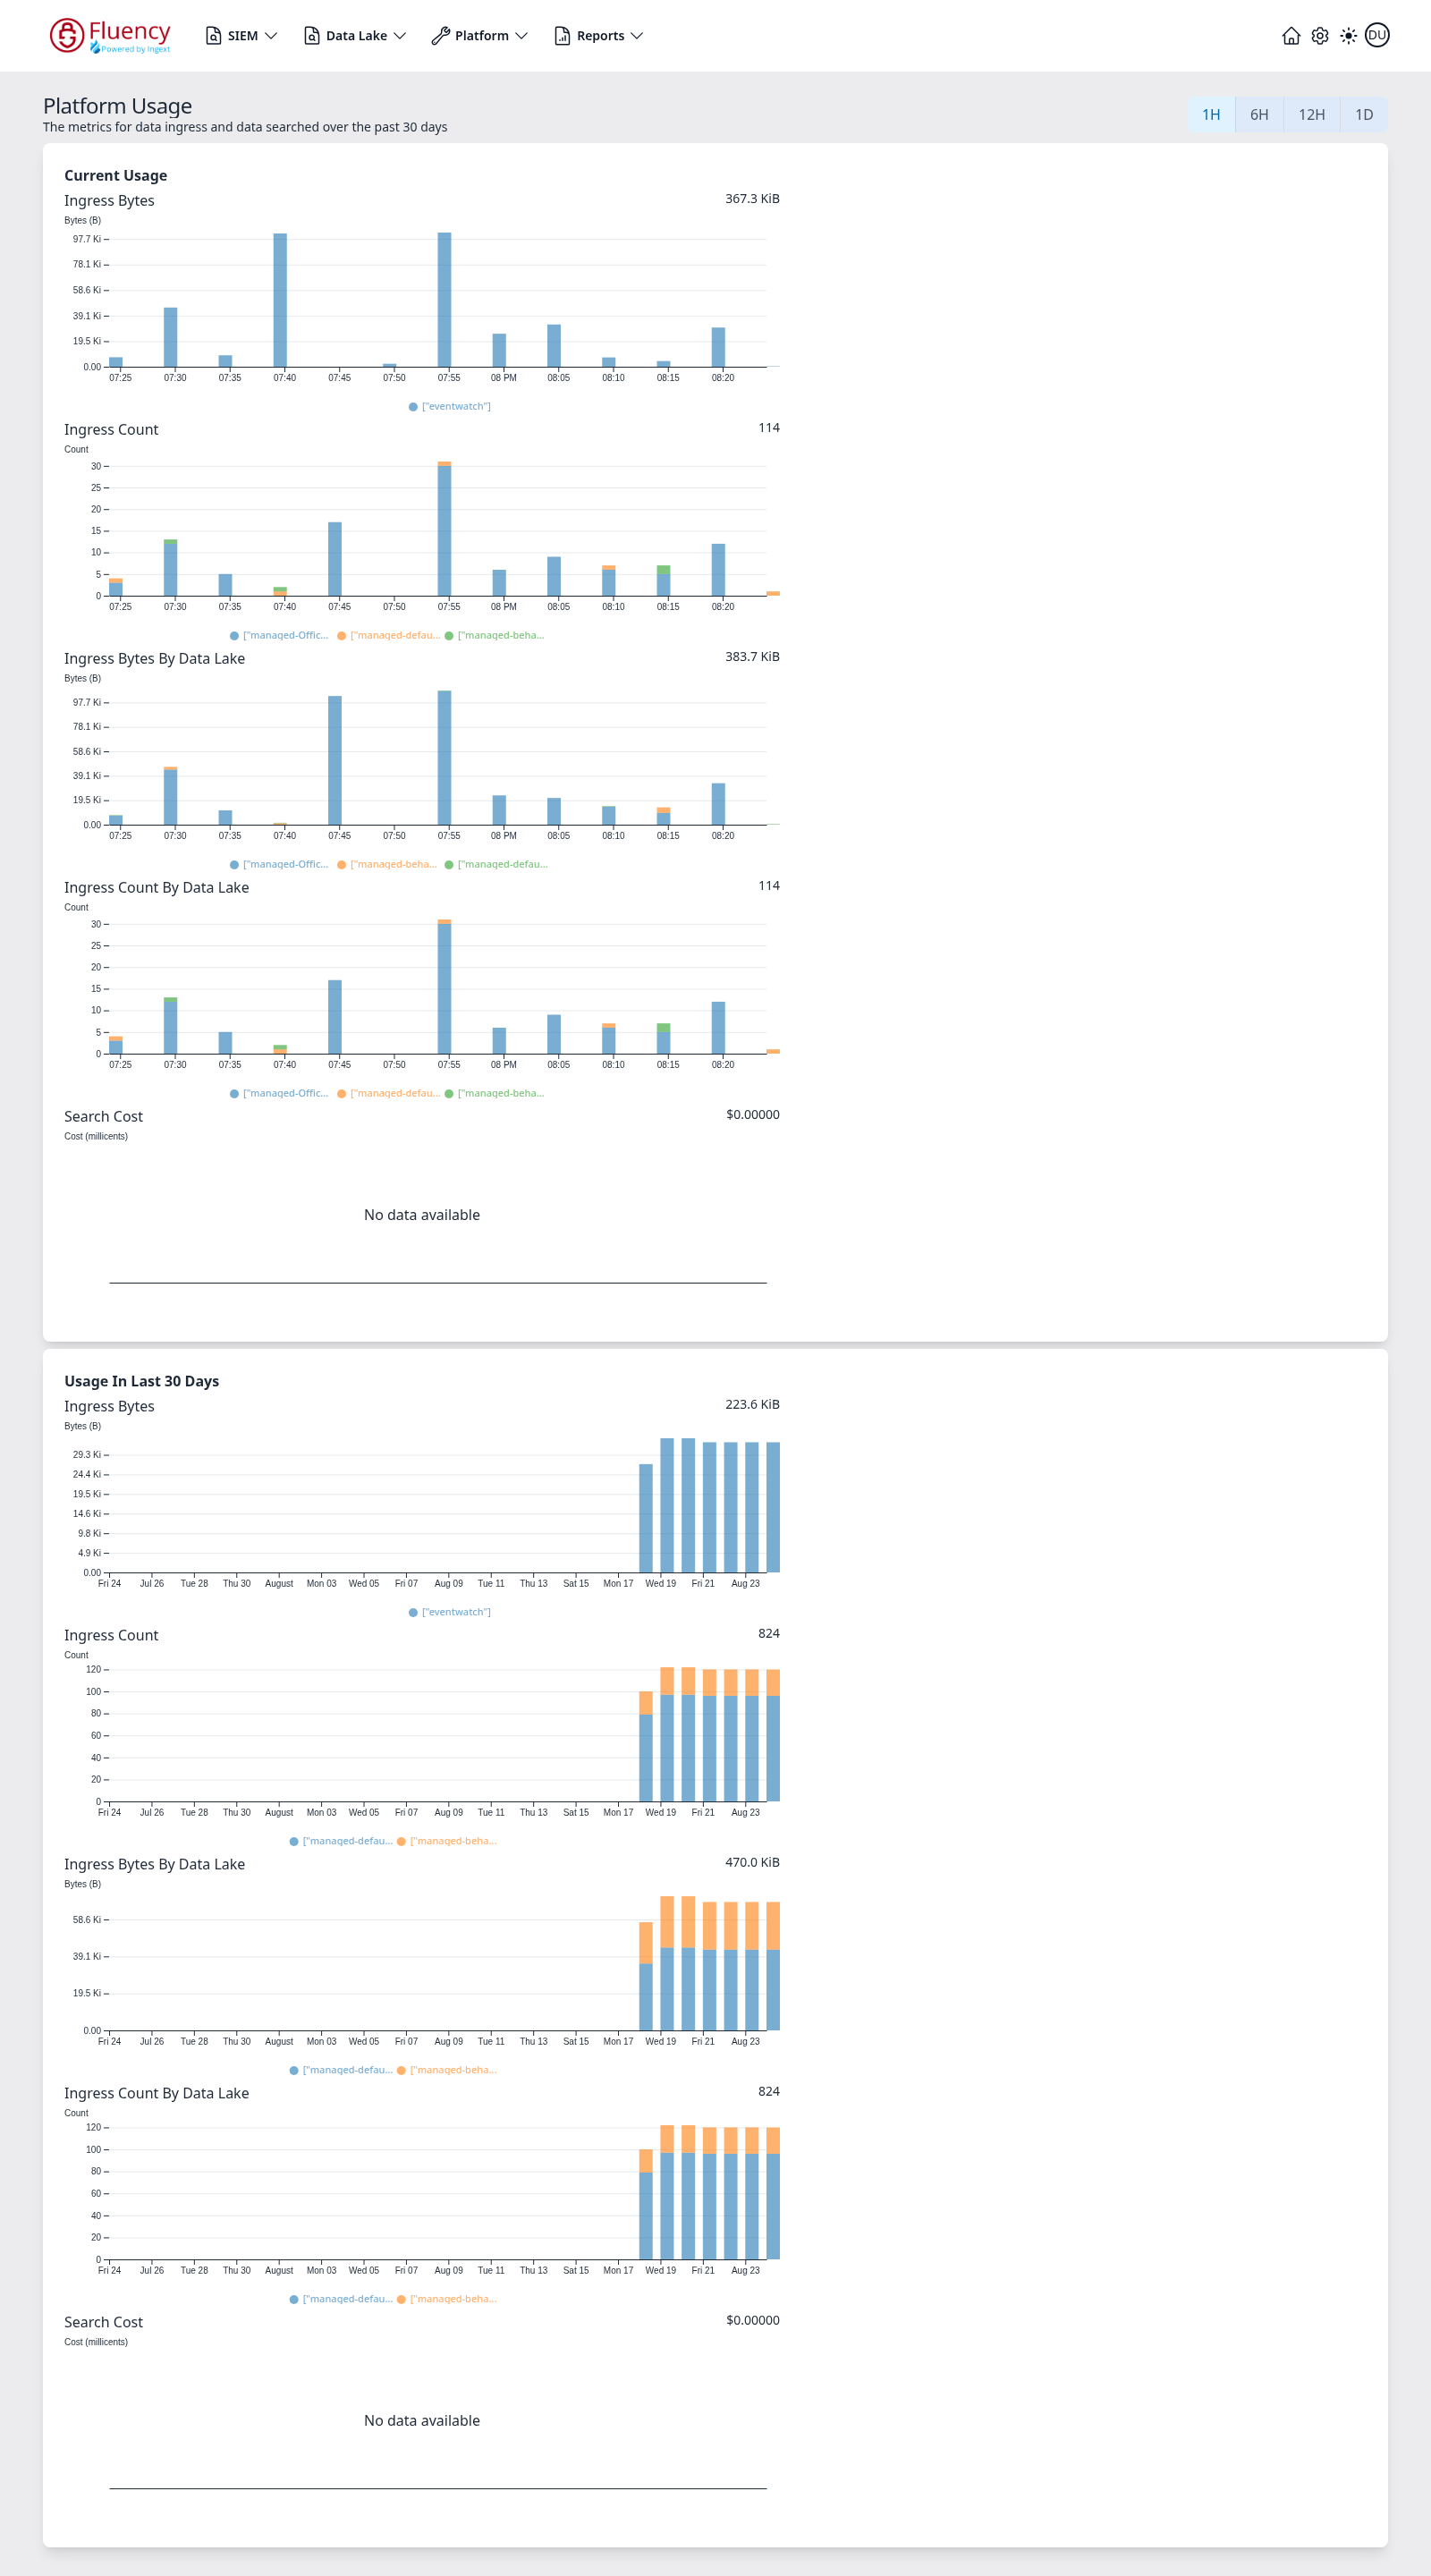
Watch Search Cost — the last of the five charts in each panel on Platform → Usage (/platform/usage) — to see whether search cost is trending up and which period is responsible. The 1H, 6H, 12H, and 1D buttons in the upper-right corner set the window for the Current Usage panel, while the Usage In Last 30 Days panel below it holds the same charts over a fixed thirty days; hovering a bar gives the series name, the Time of the interval, and the Value.
Related
- Troubleshooting — the method and the diagnostic surfaces
- No Data Arriving — when the data was never stored
- Search — how searching is meant to work
- Data Lake → Search — the search page, control by control
- Platform → Usage — ingress and search volume charts