Installed Applications
Installed Applications is the view the Applications page opens on. It lists every application installed on this platform, one card per application, and is where you check that a source is running and see what it built.
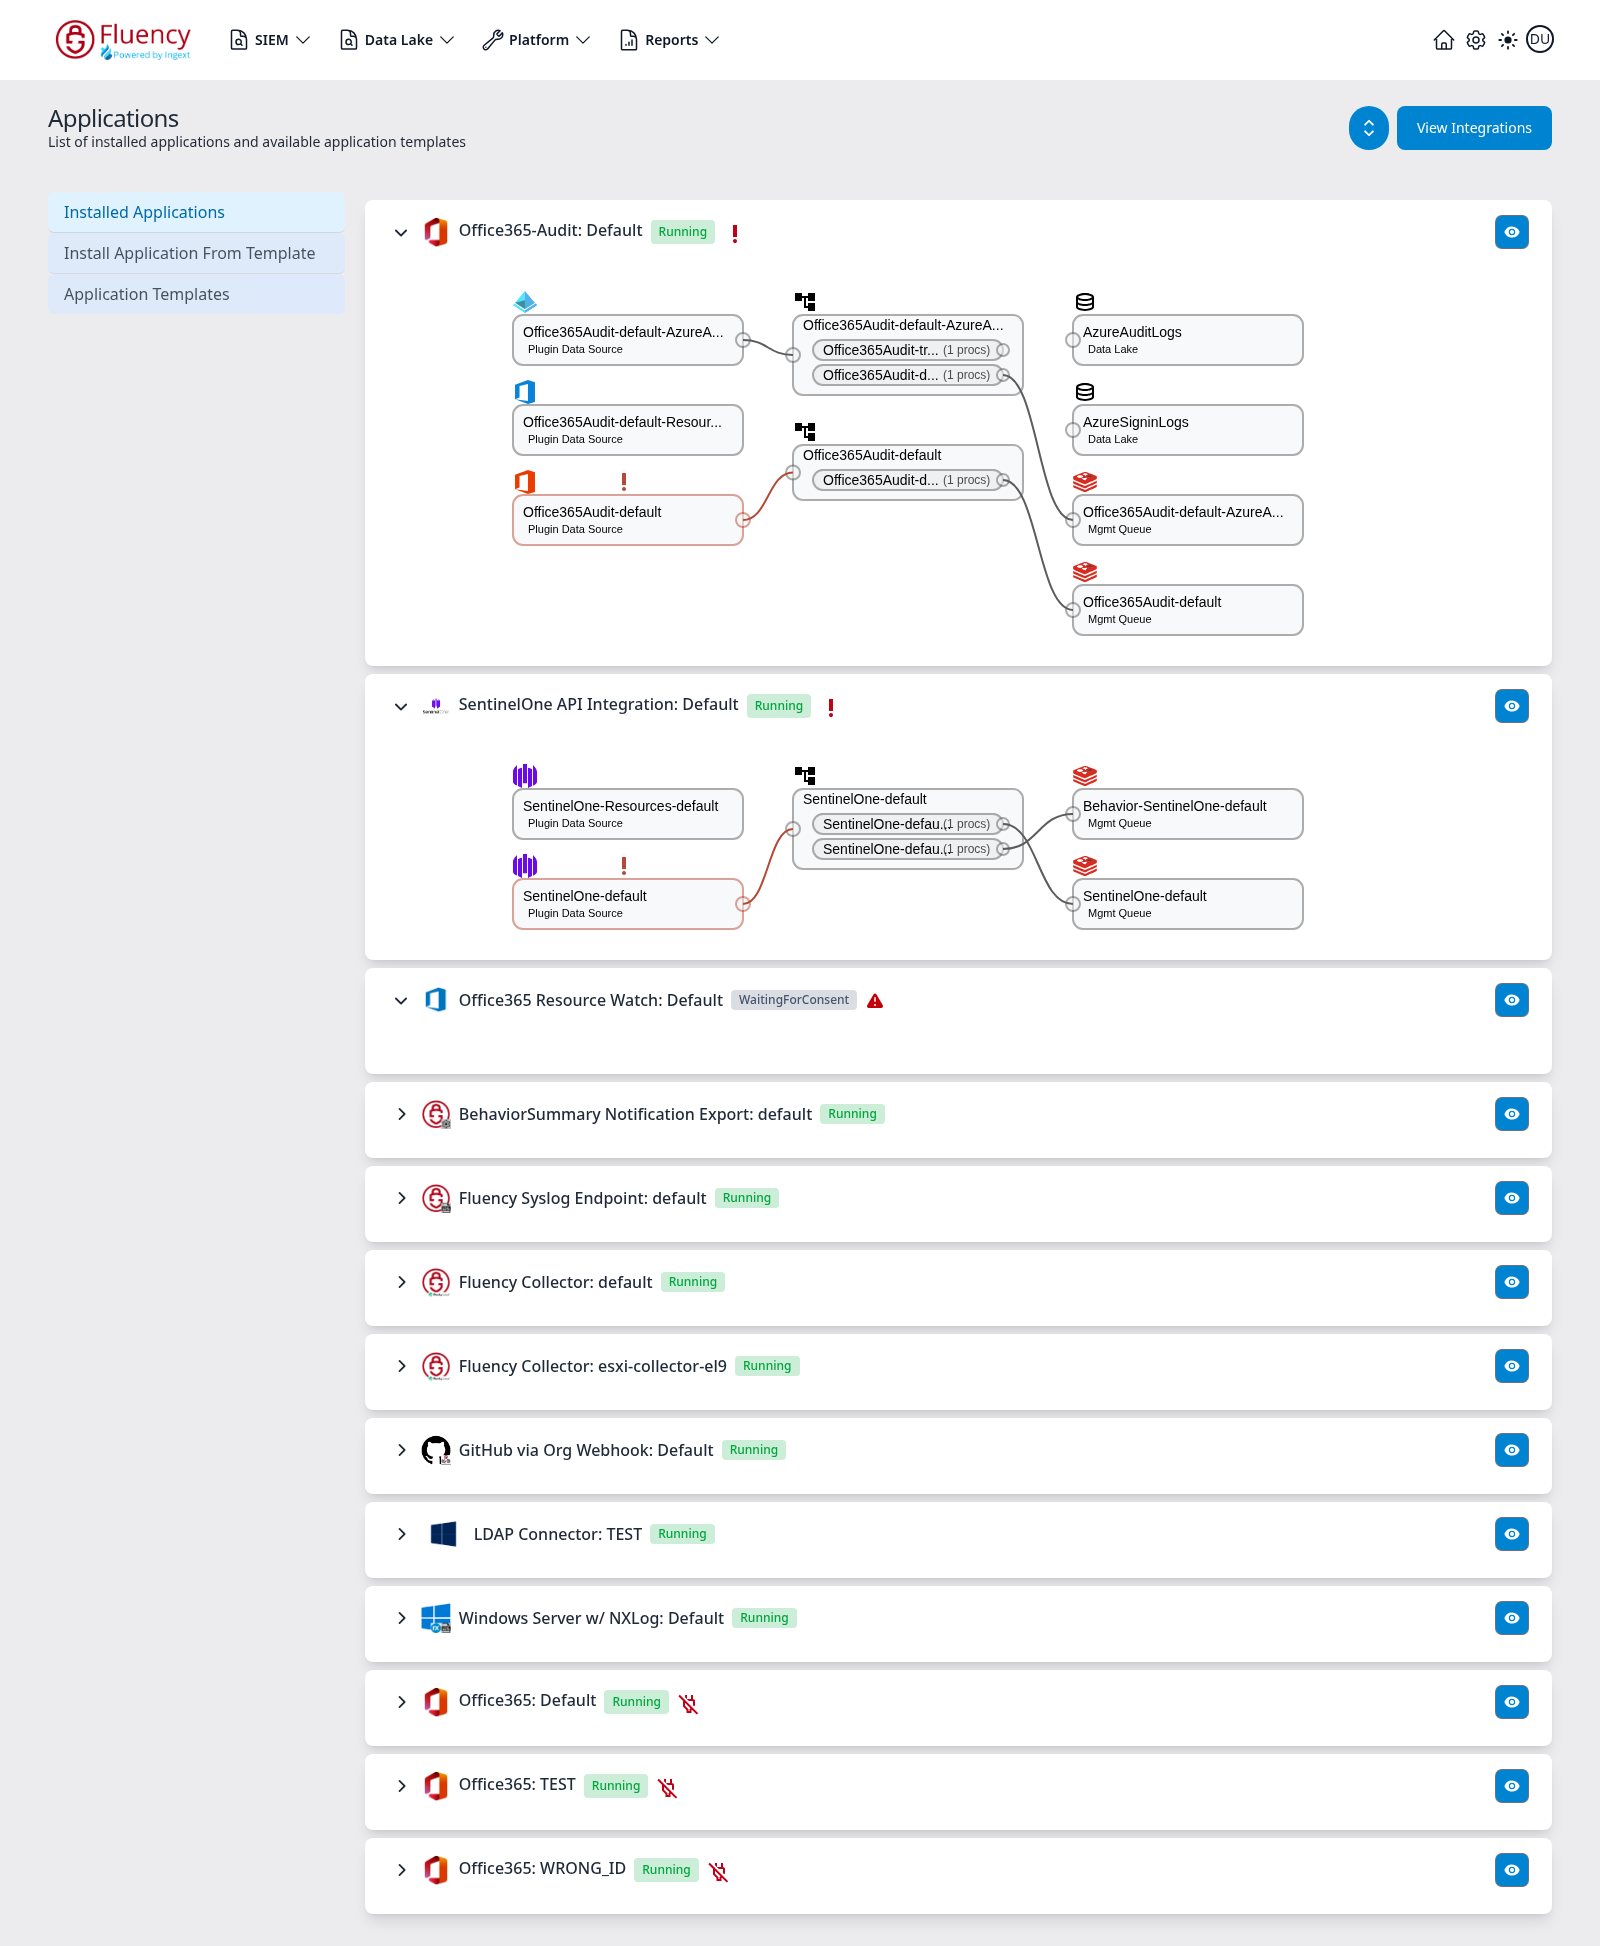
Application Cards
Each installed application appears as a card. Collapsed, the card is a single row containing:
- An arrow at the left edge — pointing down when the card is expanded, right when it is collapsed. Clicking it toggles the card.
- The application's icon and name, in the form application type: instance name — for example
SentinelOne API Integration: Default,Office365-Audit: Default, or a platform component such asFluency Collector: default. Because the instance name is chosen at install time, the same application type can appear several times with different names —Fluency Collector: defaultandFluency Collector: esxi-collector-el9are two instances of one template. - A status badge — Running (green) for a healthy application, Aborted (red) for one that has stopped on an error, WaitingForConsent (grey) for one whose credential is an administrator consent request that has been sent but not yet granted.
- A marker in red after the badge on some applications, described below.
- A blue eye button at the right edge, which opens the application's details panel.
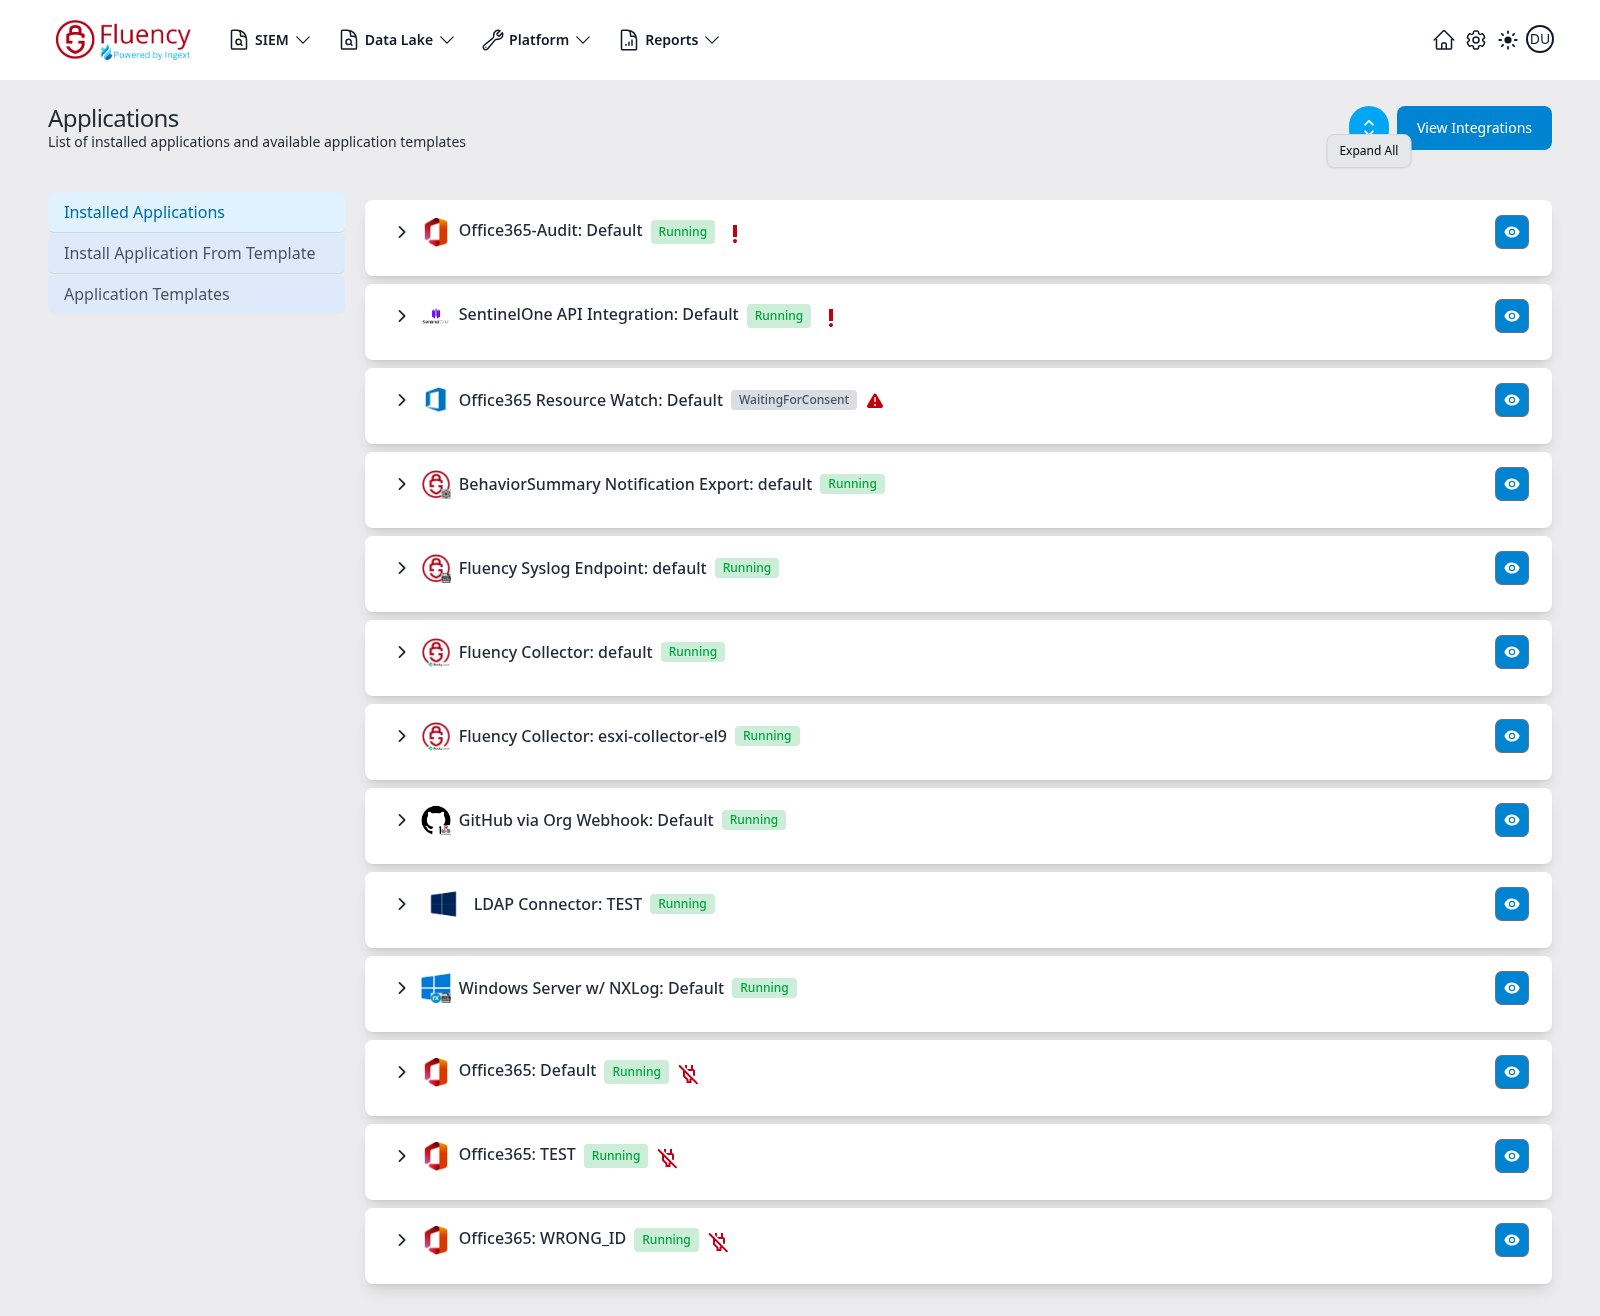
The round chevron button in the page header expands or collapses every card at once — see Expand All / Collapse All.
Markers
Three markers appear after the status badge across these captures, and they do not mean the same thing:
| Marker | What it marks |
|---|---|
| Red exclamation mark (!) | A component that is not healthy even though the application as a whole is still running. It matches a red-outlined node in that application's pipeline diagram — the Office365-Audit and SentinelOne API Integration cards each carry one, against a red-outlined Plugin Data Source. |
| Red warning triangle | The application itself needs attention rather than one of its objects. It sits beside the WaitingForConsent badge on a card that has no pipeline yet — see Waiting for consent. |
| Red struck-through plug | A disconnected data source. The same icon is repeated inside the diagram on the Plugin Data Source node itself, whose outline stays grey — idle rather than in error — so it marks a source that is not connected rather than a component that has failed. The three Office365 applications carry it while their badges still read Running. |
The collapsed view is the quickest way to read them all at once, because every card is one row and nothing is hidden behind a diagram:
The Pipeline Diagram
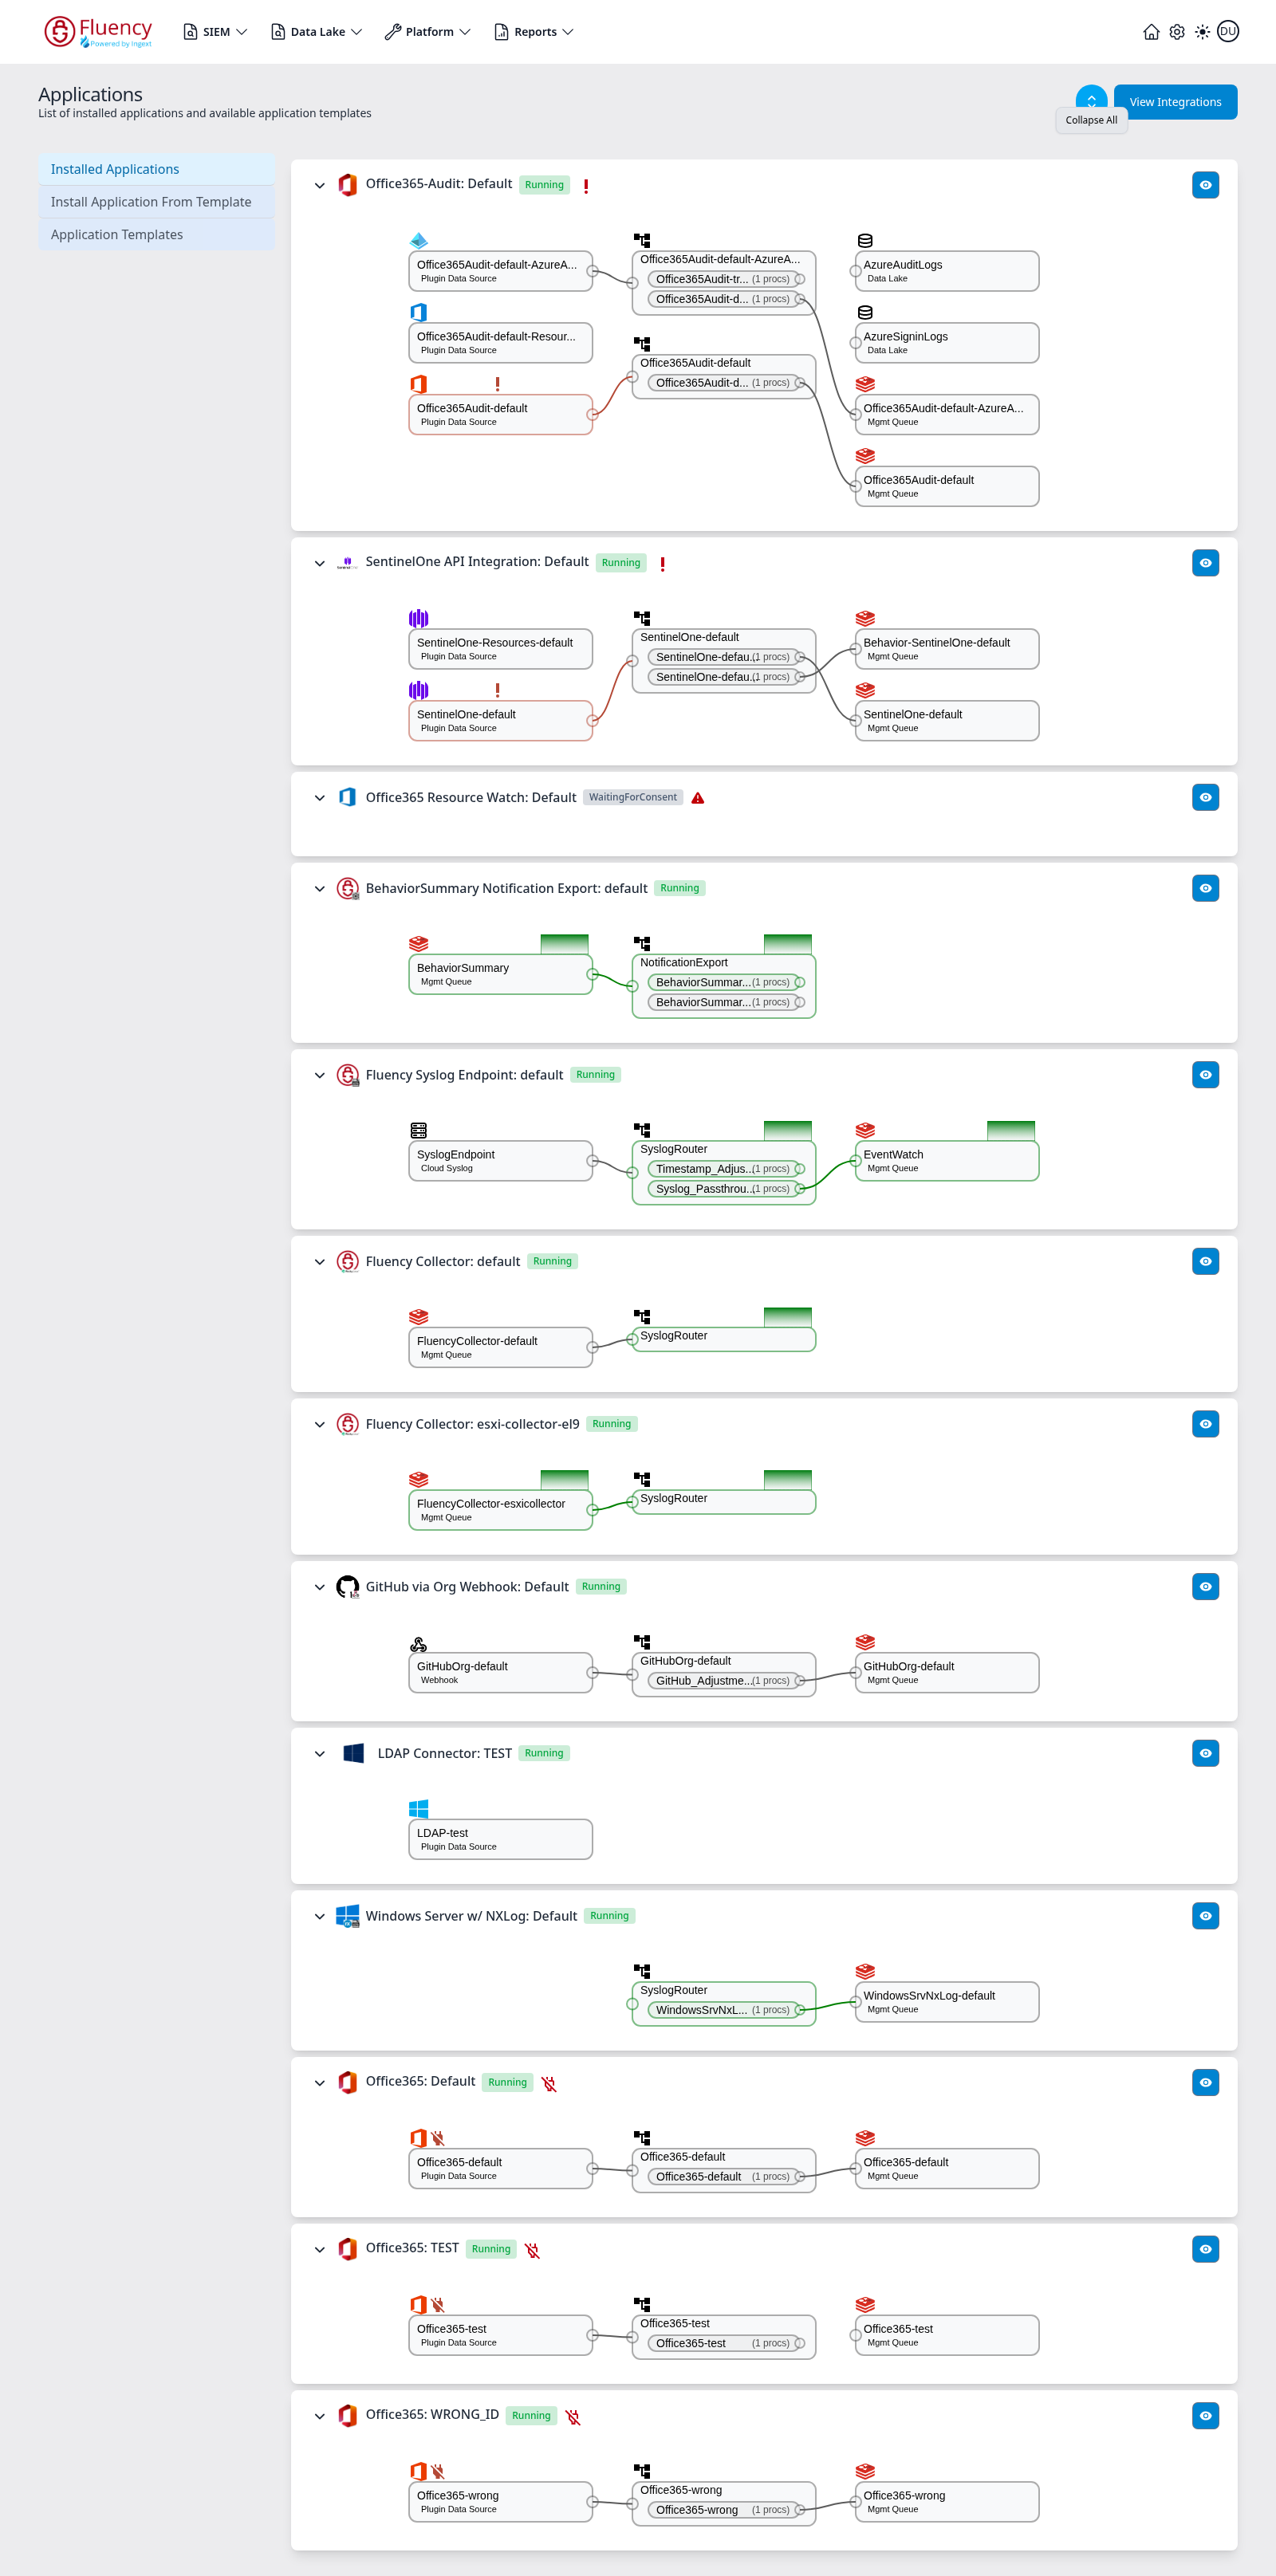
Expanding a card reveals the pipeline the application installed, drawn left to right from source to destination. Each node is a labelled box with its object name on the first line and its object type on the second, and most nodes carry a small throughput sparkline above them showing recent volume.
The node types that appear in these captures are:
| Node type | What it is |
|---|---|
| Plugin Data Source | A source fed by an integration plugin — an API poller or a push endpoint. |
| Webhook | An HTTP endpoint the vendor posts to, created by the install and addressed by the Webhook URL in the application's Outputs. GitHub via Org Webhook is the template that builds one. |
| Cloud Syslog | The platform's syslog ingest endpoint. |
| (router) | An unlabelled box holding one or more pipes; each pipe shows its name and a processor count such as (1 procs). |
| Mgmt Queue | A management queue the pipeline writes to, such as EventWatch or Behavior-SentinelOne-default. |
| Data Lake | A data-lake index the pipeline writes to, such as AzureAuditLogs. |
Outlines and connectors are colour-coded: green where data is flowing, grey where the path is idle, and red on a node that is in error — the same condition flagged by the red ! next to the application name. A node can also carry the red struck-through plug that marks a disconnected source; that one is drawn on the node's icon and leaves the outline grey, because an unconnected source is idle rather than failing.
A card can expand to nothing at all. Office365 Resource Watch: Default is WaitingForConsent, and in the expand-all capture below its body is empty: until the consent is granted there is no pipeline to draw. That is the expected look of the state, not a rendering fault — see Waiting for consent.
One template can install more than one source. SentinelOne API Integration builds two plugin data sources — SentinelOne-default for the event feed and SentinelOne-Resources-default for the host roster — into one router with two pipes, and Office365-Audit builds three sources, two routers, two data-lake indexes and two management queues from a single install.
The capture below has every card expanded, so each application's diagram is visible at once:
Application Details Panel
Clicking the eye button on a card opens a panel over the right side of the page, titled Viewing followed by the application's internal type name and the word Application — Viewing SentinelOne Application, Viewing CloudSyslog Application, and so on. That internal name is often shorter than the display name shown in the list and in the panel's own Application field. Close the panel with the X in its title bar.
Every version of the panel opens with a Details section and ends with a red Uninstall button in the lower-right corner, which removes the application. Between them the panel shows whichever of these sections apply to the application:
| Section | Contents |
|---|---|
| Details | Application (the template this was installed from), Name (the internal instance name), Display Name, and a Status badge carrying the same value as the card's. When the status is Aborted, an Error Message follows in red. |
| Parameters | The values the application was installed with, under the same labels as the template's setup form. Secrets are masked. |
| Outputs | Values the installation produced rather than consumed — a collector's security token, or the Webhook URL a push template's sender must be pointed at. Each has a copy button at the right edge of the field. |
| Actions | The pipeline objects the installation created. |
The fields in Details, Parameters, and Outputs are read-only; to change a parameter, uninstall the application and install it again.
The setup form keeps datalake and datalake index name in a collapsed Advanced Configurations section. The details panel makes no such distinction: it lists them inline with the rest, in the order the template declares them. So this panel — not the setup form — is where you read back which lake and index an application is actually writing to.
Actions
The Actions list is a plain record of what the install did, one line per object created. The verbs seen across these captures are:
- Add Data Source / Add Integration — the source end of the pipeline.
- Add Router and Add Pipe to Router — the router and each processing pipe inside it.
- Add Router Connection to Data Source — wiring the router to the source.
- Add Data Sink and addDatalakeIndex — the destinations.
- addResourceGroup and addCollector — supporting objects, where the template needs them.
- Sent Invitation — not an object at all, but the record that an admin-consent request was mailed. It is the whole Actions list on an application that is still waiting for consent.
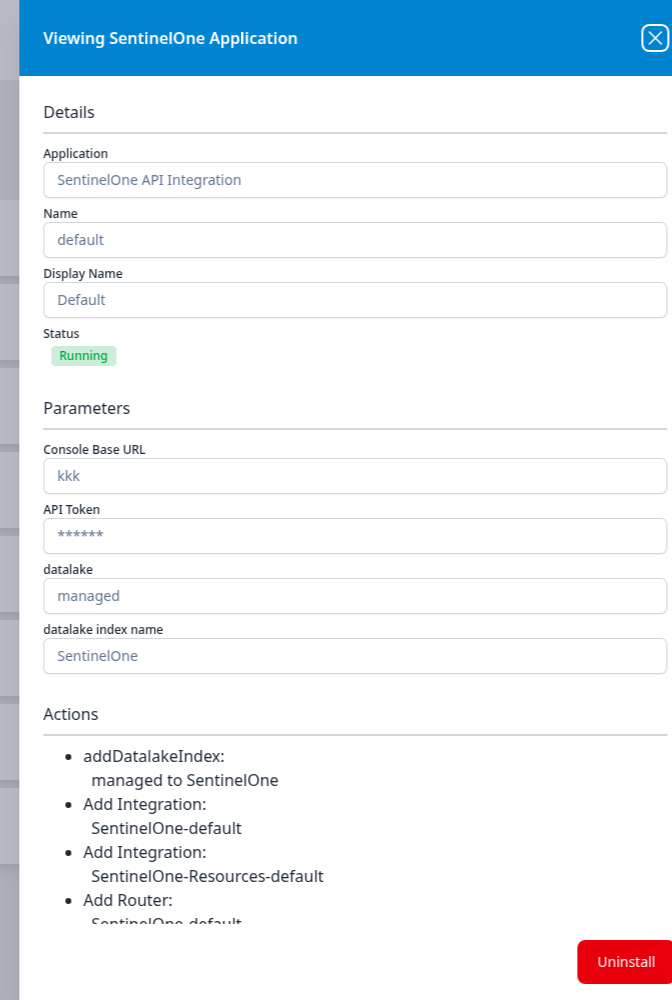
With parameters and actions
The most common shape. The SentinelOne panel shows the two credentials it was installed with, then the lake and index that came from Advanced Configurations, then the objects it created — including the two Add Integration lines for the event feed and the resource dump:
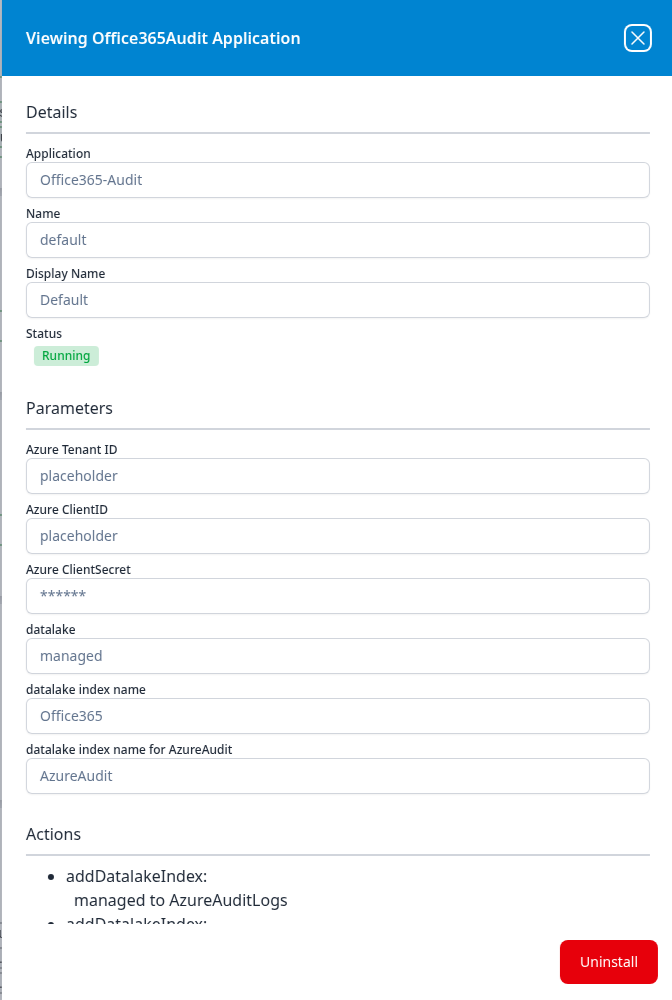
An Office365-Audit application is the same shape with a longer parameter list — the Azure tenant and client credentials plus the data lake and the two index names it writes to:
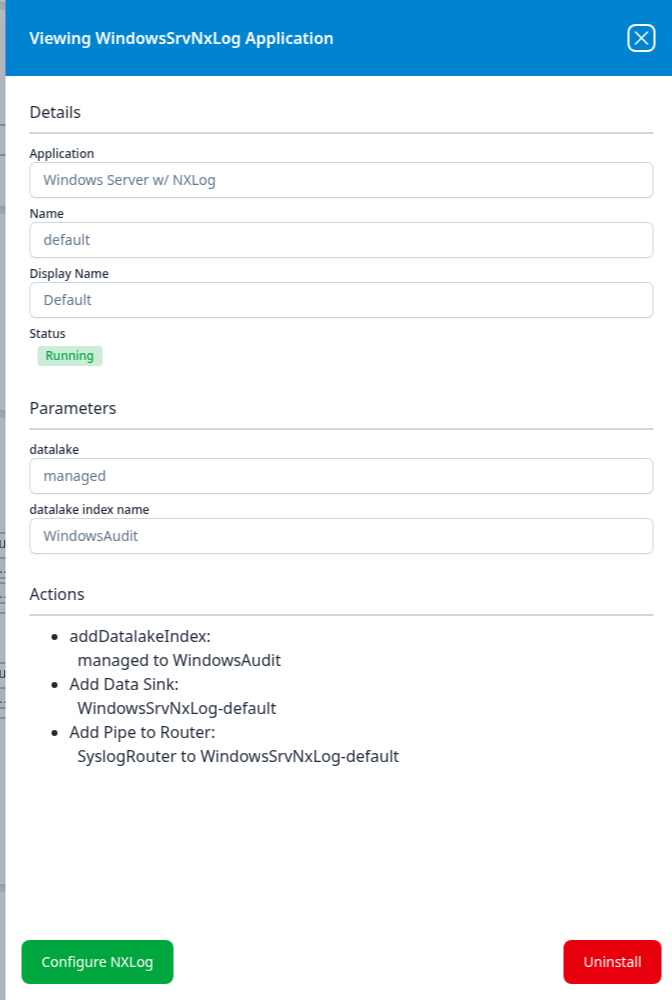
A syslog template's panel is the minimal version of this shape: Windows Server w/ NXLog takes no credentials at all, so its Parameters section holds nothing but the destination.
The LDAP Connector panel is the one to read when you want to see how a password is treated. Its Parameters list ends with a Password row shown as asterisks — masked, but present — and its Actions list opens with Add Integration: LDAP-test, naming the integration this install created:
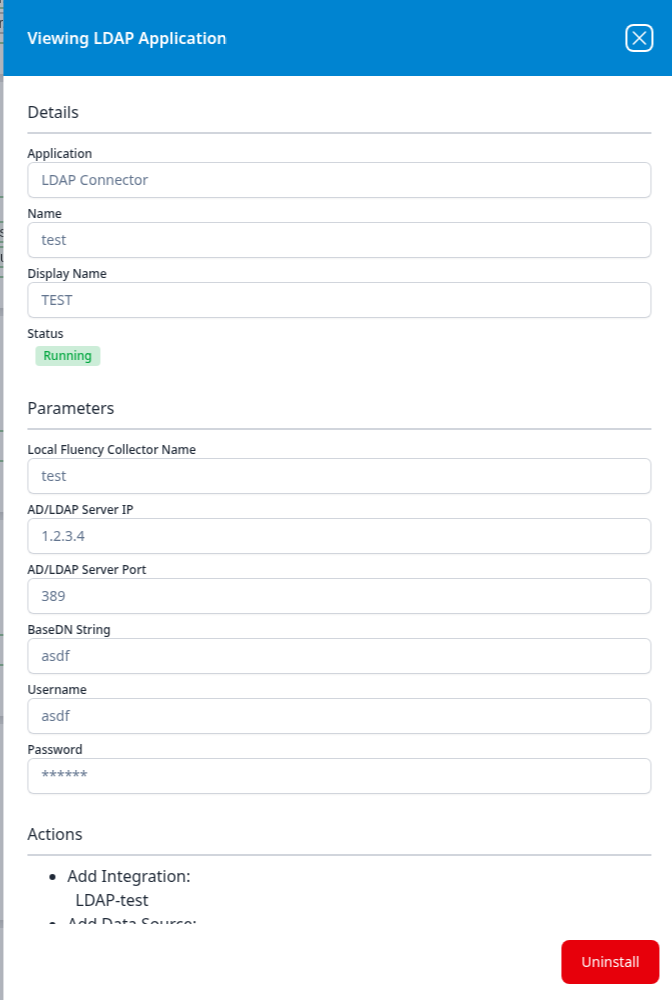
That is worth holding against the same integration's dialog on the Integrations page, which lists every one of those fields except the password. The install record keeps the secret masked; the connection record leaves it out.
Actions only
Templates that take no parameters produce a panel with no Parameters section. The BehaviorSummary notification export is one of these — its panel goes straight from Details to the router, the two pipes, and the data source it created:
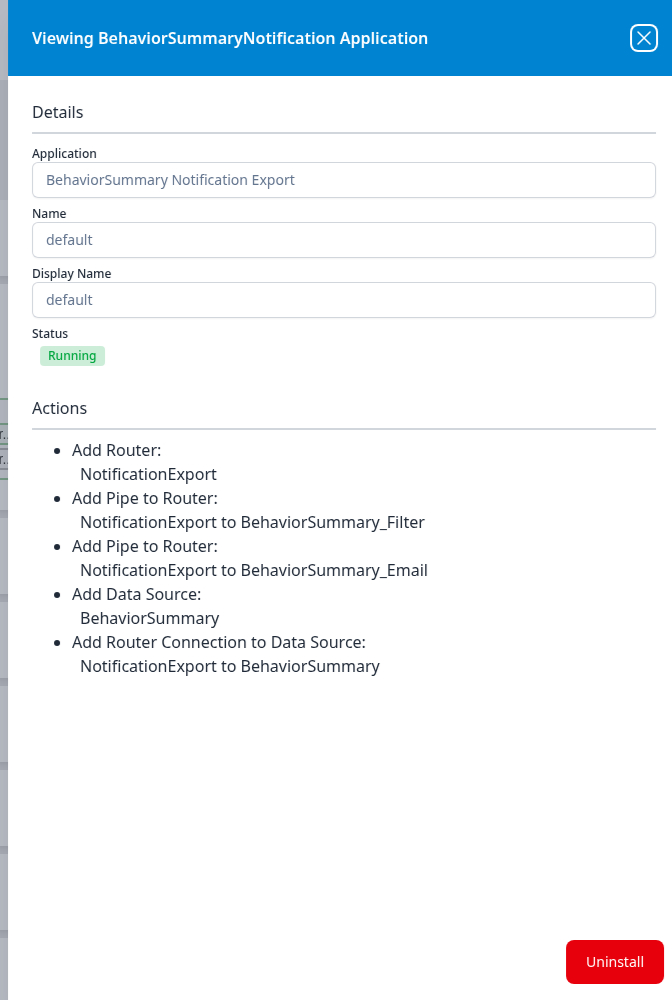
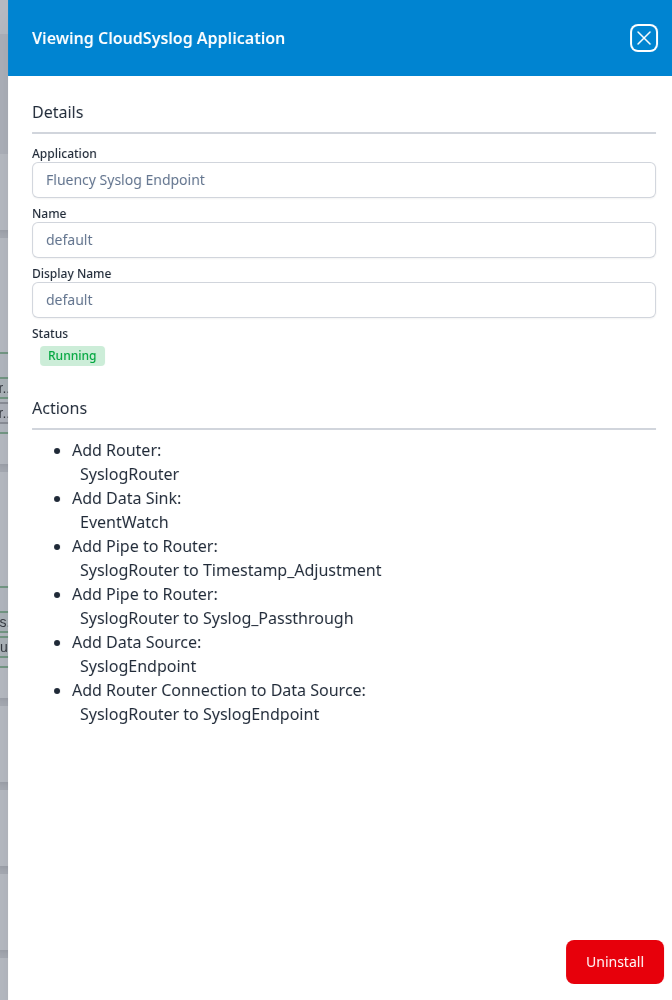
The Fluency Syslog Endpoint panel is the same shape, and its Actions list is worth reading: the SyslogRouter and the EventWatch sink it creates are the objects that every On-Premise IT application then attaches a pipe to.
With outputs
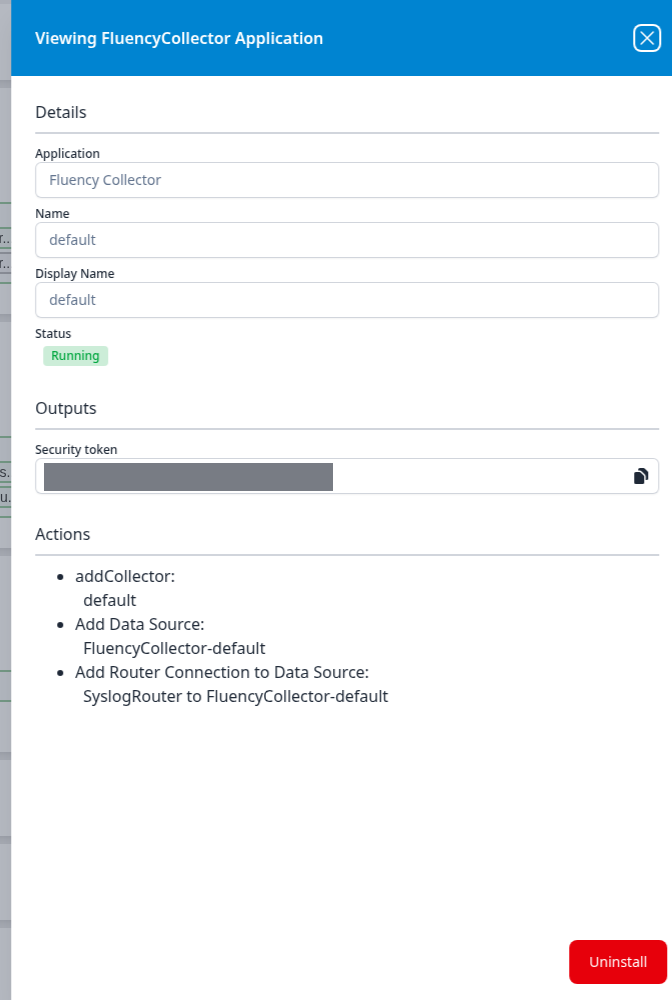
A Fluency Collector application adds an Outputs section holding the Security token the collector authenticates with, with a copy button at the right edge of the field. Use that token when registering the collector.
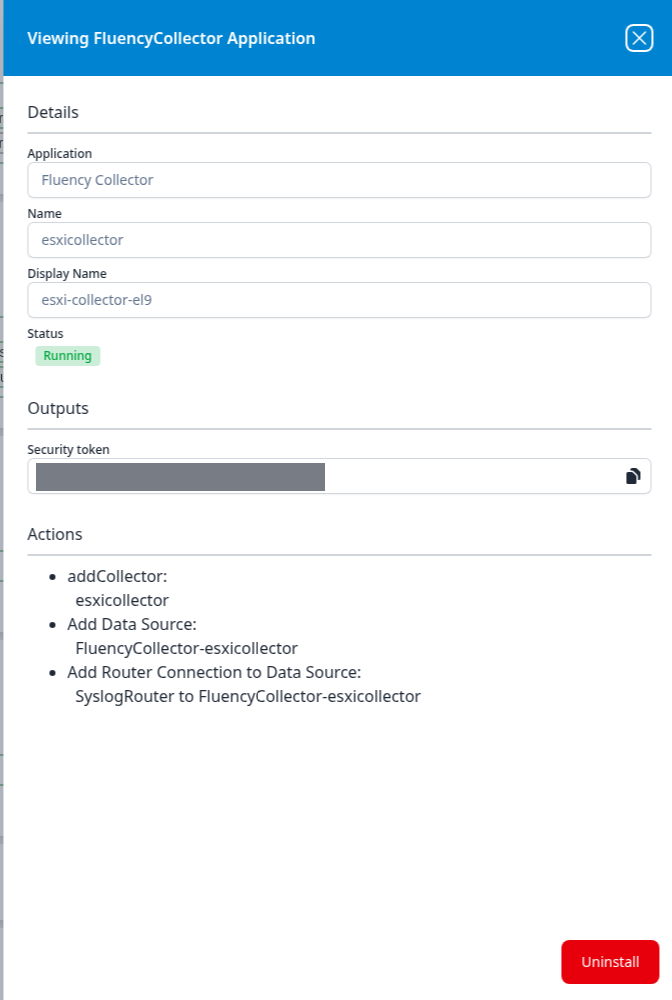
Each instance gets its own token, so a second collector installed from the same template has a different value in the same field:
The HEC templates — Bitdefender EventPush, Bitdefender SecurityTelemetry HEC, Coro via HEC, HEC Input Passthrough and Zsaler NSS — use Outputs the same way, for the HEC URL and HEC Security Token the sending product posts to.
GitHub via Org Webhook is the clearest case of an output that has to be carried back to the vendor. It takes one parameter — a Security Token you choose — and produces one output, the Webhook URL the platform will listen on. Neither half of the integration works until that URL and that token are entered in GitHub's organisation webhook settings, so this panel is where the install is finished rather than where it is checked.
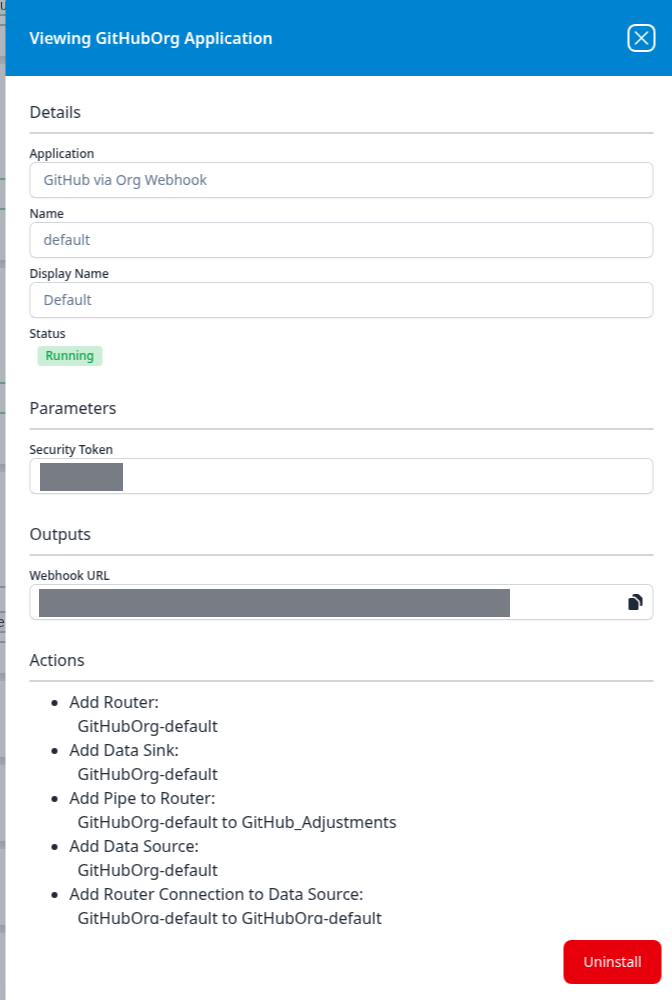
The corresponding node in the pipeline diagram is a Webhook rather than a Plugin Data Source: nothing is polled, and the pipeline only moves when GitHub posts.
Template-specific actions
A few templates add their own button to the panel footer, to the left of Uninstall. Windows Server w/ NXLog has a green Configure NXLog button, which is where the agent-side configuration for that instance comes from; the capture is above. Templates without such a button show Uninstall alone.
An aborted application
When an application has stopped on an error, its status badge reads Aborted and the Details section carries an Error Message in red explaining why. In the capture below an AWS CloudTrail application failed because its data-lake index name was already taken in that lake:
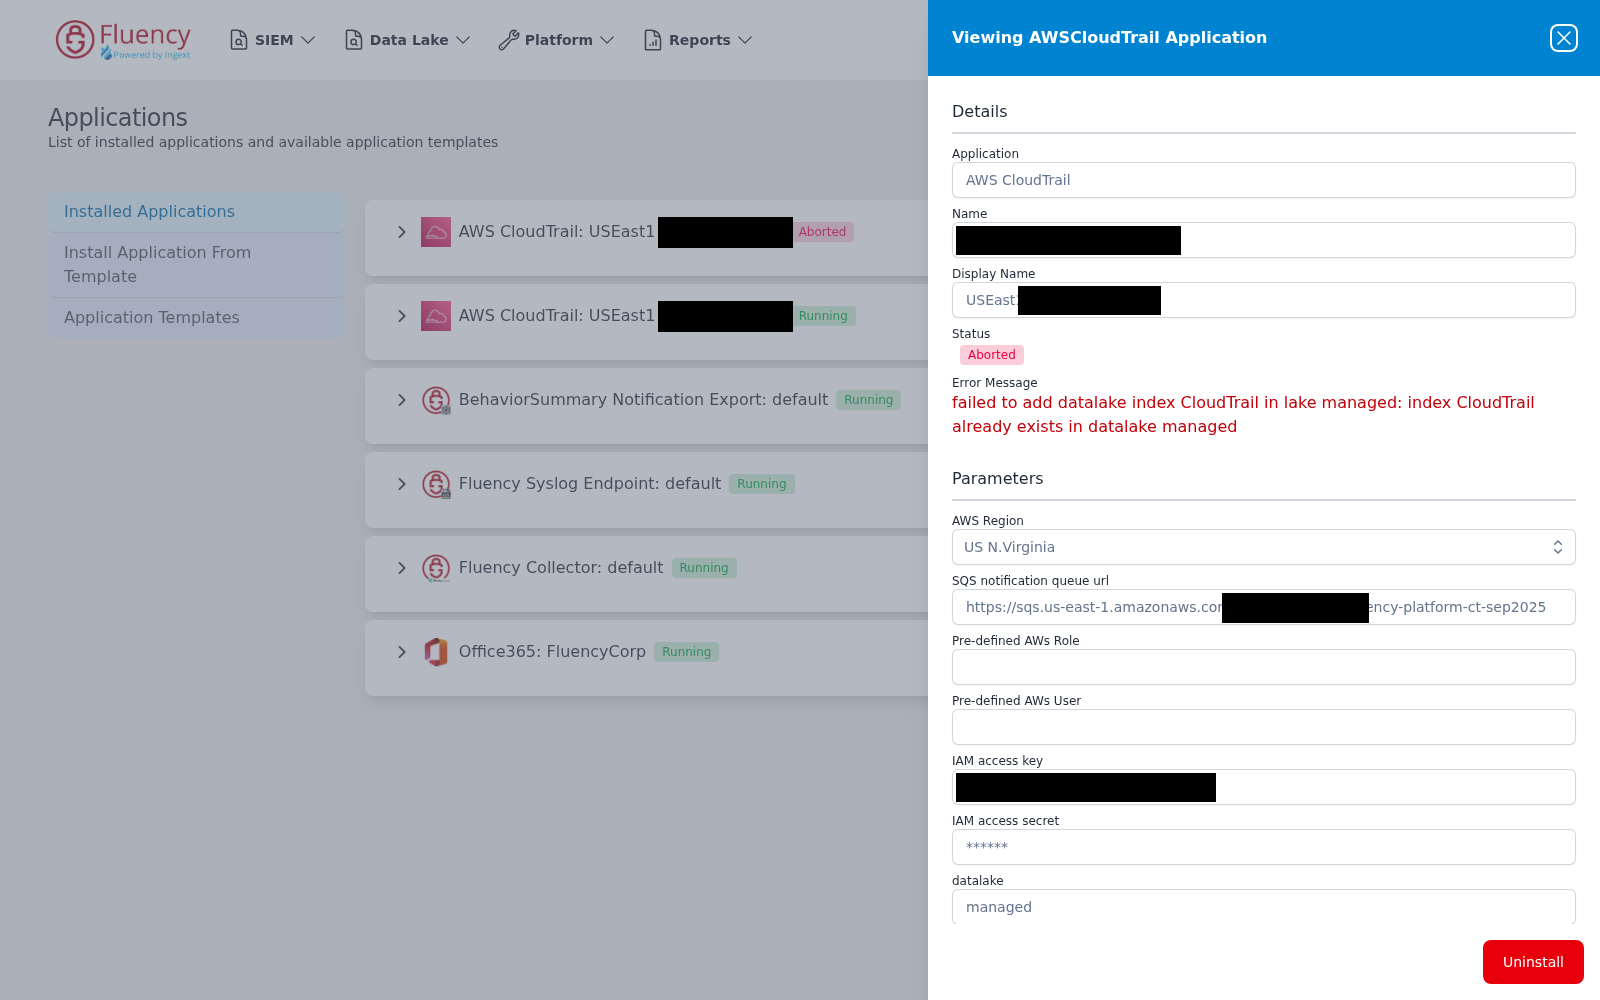
This is the first place to look when one source stops while the others keep running — see No data arriving.
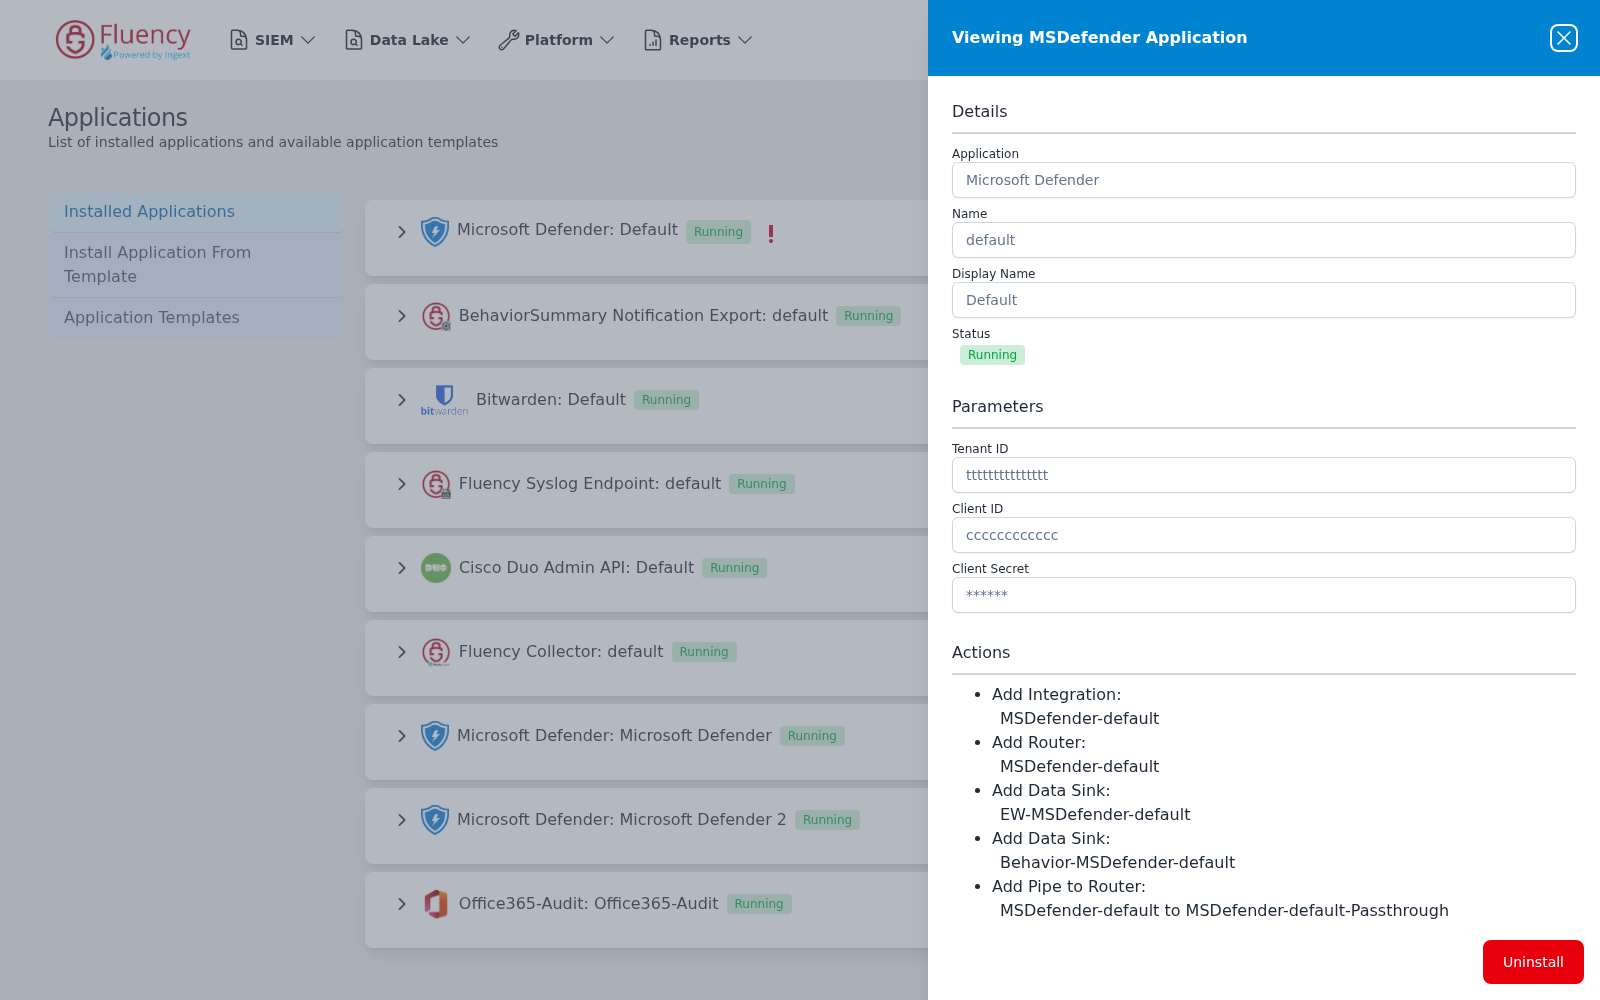
An earlier Microsoft Defender install shows the same shape running normally, with the three Entra application credentials it was given:
Waiting for consent
The Microsoft templates that can be authorised by an administrator granting consent — the ones with Enable Admin Consent Mode? ticked — install immediately but do not connect to anything until the consent comes back. Until it does, the application sits in a state of its own: a grey WaitingForConsent badge, a red warning triangle beside it, and a card that expands to nothing because there is no pipeline yet.
The panel says the same thing in more detail. Enable Admin Consent Mode? reads true, admin email address holds the address the request was mailed to, the Azure Tenant ID and Azure ClientID fields are empty because no client credential was supplied, and Actions holds a single Sent Invitation line with the invitation's identifier instead of a list of pipeline objects:
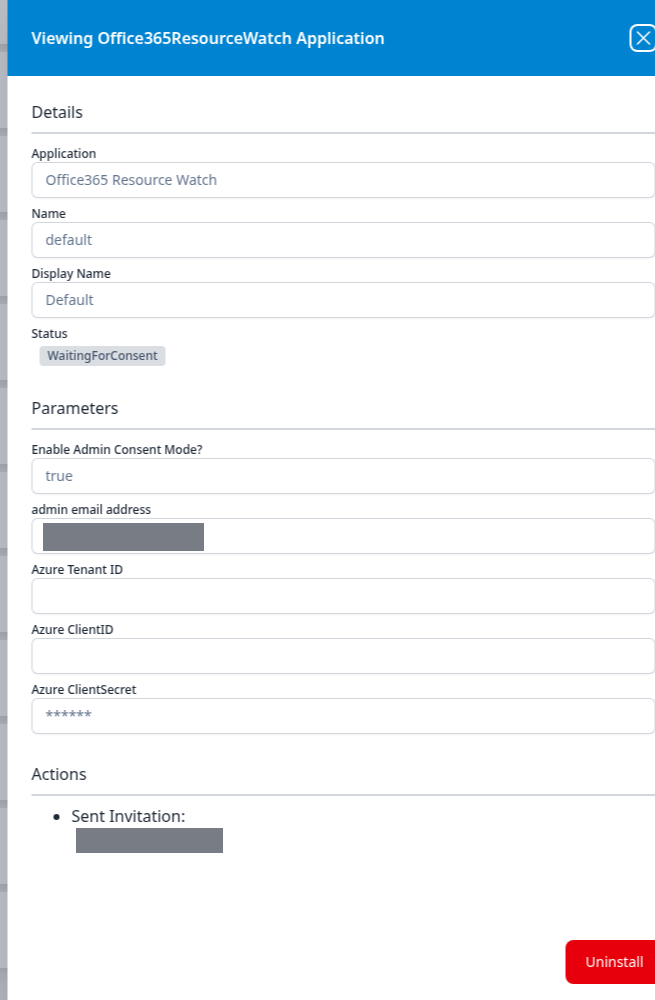
Nothing else was built: there is no Add Integration line, and no tile for this application appears under Existing Integrations. An application in this state is waiting on a person, not on the platform. The integration-level equivalent is the Send Invitation configuration method, which likewise asks for an administrator's address and nothing else.
A disconnected source
The three Office365 applications in these captures read Running and carry the red struck-through plug. The marker is on the card and on the Plugin Data Source node inside the diagram; the panel does not repeat it — its Status reads Running like any other. So the card is where you notice a source is not connected; the integration of the same name on the Integrations page is where its connection settings can be read back and corrected.
The pair of panels below is also the clearest illustration of how a conditional parameter reads back. Enable Admin Consent Mode? appears here as a value field rather than the checkbox it is on the setup form, and which credential set is filled follows from it. With consent mode true, Admin Email address carries the address and the Azure fields are empty:
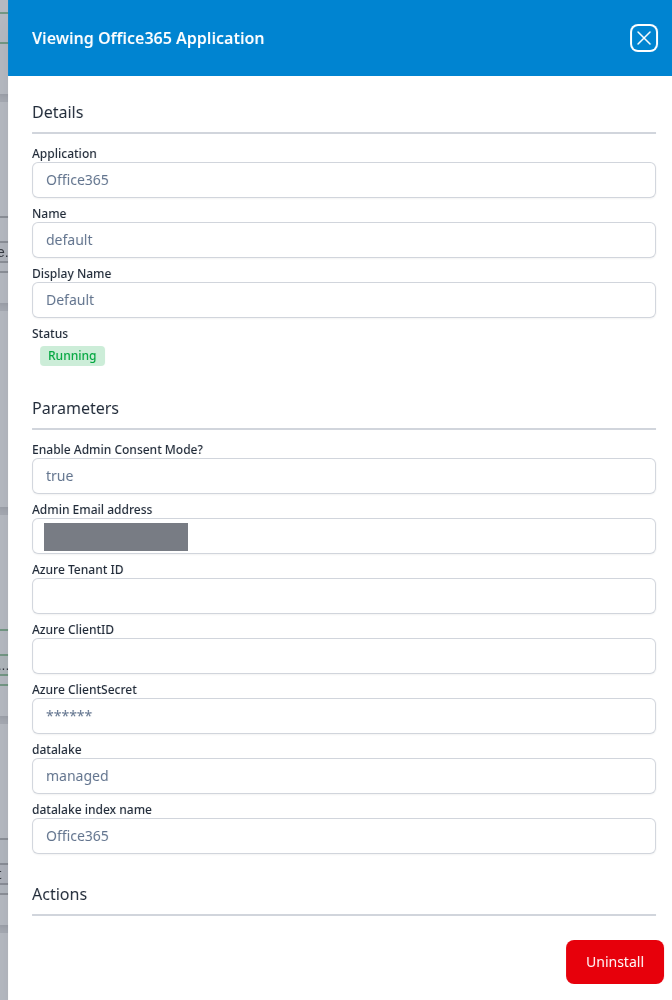
With it false, the address is empty and Azure Tenant ID and Azure ClientID hold the registered application's identifiers instead — the same template, the same panel, the other branch:
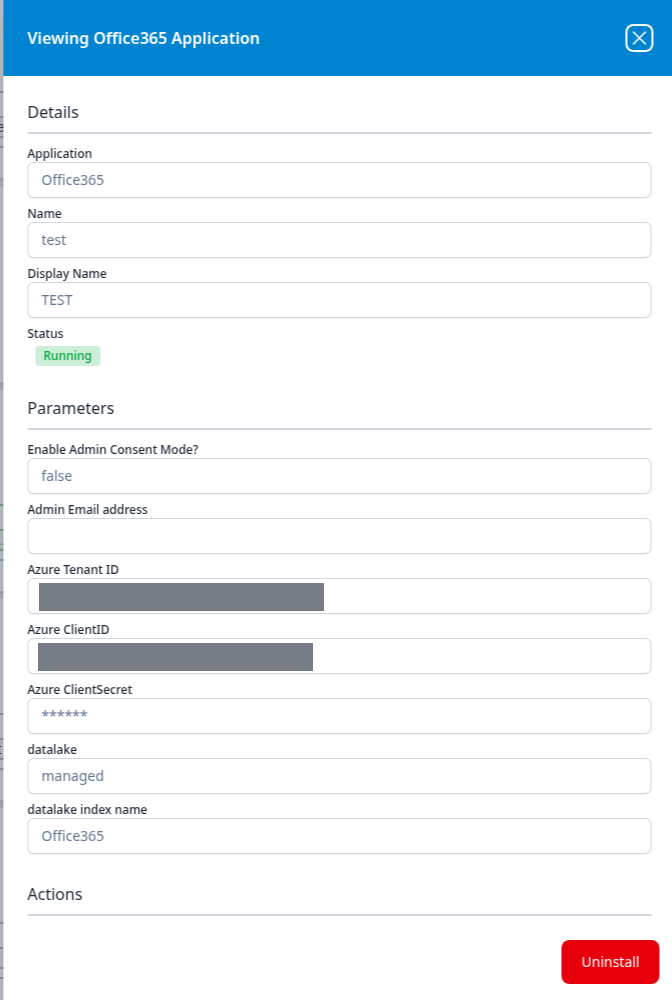
Both write to the same datalake index name, Office365, which is the default this template ships with — see Advanced Configurations for what that costs when two installs keep it.
Integrations behind an application
Where the Actions list says Add Integration, the object it created is also listed on the Integrations page, under Existing Integrations — SentinelOne-default, SentinelOne-Resources-default, LDAP-test, the three Office365Audit-default… entries and the three Office365-… entries in these captures all came from an application install. That page is where an integration's connection settings can be edited without reinstalling the application around it; the View Integrations button in this page's header goes straight to it.