Symantec Endpoint Protection Manager
Symantec Endpoint Protection Manager (SEPM) is the on-premises console for Symantec Endpoint Protection. Every managed client reports to it — malware detections and the action taken, intrusion-prevention and firewall decisions, device and application control blocks, behavioural (SONAR) detections, policy changes and client health — and SEPM holds all of it in its own database. Its External Logging feature is how that reaches anything else: SEPM forwards the log types you select to a syslog server as they are written.
Collecting it centrally is what makes a SEPM detection comparable with everything else. A risk detection on one laptop is a ticket; the same detection on nine laptops within an hour, correlated with the firewall and identity telemetry around it, is an incident — and SEPM's own console will not tell you that.
The template sits in the catalog's Endpoint Management category because the telemetry is endpoint telemetry, but the transport is syslog and the shape of the work is the same as the On-Premise IT templates: point the server at a listener, install the template, and the template supplies the parser. ManageEngine is filed the same way for the same reason.
Before you begin
A SEPM administrator account. External Logging is configured per site, under the server properties, and needs a system administrator.
A decision about which logs to export. SEPM's log filter lets you select management-server logs and each client log type independently. Exporting everything from a large estate is a great deal of data, much of it operational rather than security-relevant — see Choosing what to export.
A route from the SEPM server to the listener. SEPM sends from the management server itself, not from the clients, so it is one host that needs to reach the syslog listener rather than the whole estate.
Part 1 — Symantec Endpoint Protection Manager
1. Open the site's external logging settings
In the SEPM console, go to Admin → Servers, select the Local Site (or the site whose logs you are exporting), and choose Configure External Logging.
2. Enable transmission to a syslog server
On the General tab, set the Update Frequency and the Master Logging Server — the management server that will do the sending, which matters when the site has more than one.
On the Syslog Server tab, enable transmission of logs to a syslog server and fill in:
| Field | Value |
|---|---|
| Syslog Server | The listener's host name or address — the cloud syslog endpoint's per-tenant domain, or the collector appliance. See Syslog configuration. |
| UDP/TCP | The protocol the listener you chose is listening with. |
| Port | The port allocated to you on Platform → Administration → Syslog Ports, or the collector's listener port. Do not assume 514. |
| Log Facility | SEPM's default is fine unless your own convention says otherwise. |
3. Choose what to export
On the Log Filter tab, select the log types to send. See Choosing what to export below for which ones earn their volume.
Apply the change. SEPM begins forwarding at the update frequency you set — it is a periodic export rather than a per-event stream, so allow one interval before expecting anything.
Choosing what to export
The client logs are where the security value is, and they are not equally valuable:
- Risk and Proactive Threat / SONAR — malware and behavioural detections. Export these; they are the reason to do this at all.
- Security and Traffic — intrusion prevention and the client firewall. Export these where the client firewall is enforced; they are high volume where it is in monitor mode.
- Application and Device Control — blocks on executables and removable media. Low volume, high signal.
- System and Client Management — client health, definition updates, policy application. Useful for spotting clients that have stopped protecting themselves, but the bulk of it is routine.
- Packet — full packet logging. Very high volume; export it only for a specific reason and for a bounded period.
Management-server logs — administrative logins to SEPM, policy changes, replication — are separate from the client logs and worth having whatever else you select. They are the record of who changed the protection posture.
Part 2 — Fluency
Syslog configuration
The SEPM server sends to a syslog listener: either the cloud syslog endpoint or a local collector appliance. The two destinations use different ports. The cloud endpoint has a per-tenant domain and a block of ports allocated to your account: Platform → Administration → Syslog Ports shows the domain, the port range, and which protocol listens on which port — read the numbers off that page rather than assuming a standard one. A collector appliance listens by default on UDP/514, TCP/514, TLS on 6514 and TLS RFC 6587 on 7514, and each of its listeners can carry a Customer Tag that attributes the records arriving on it. See Syslog Import for the protocol options and Syslog Ports for the listener configuration.
Because everything comes from one management server rather than from every endpoint, TCP to the cloud endpoint is practical here in a way it is not for a fleet of appliances — one host, one route, one firewall rule.
Install the Application
Go to Platform → Applications → Install Application From Template and choose Symantec EPM Syslog from the Endpoint Management category, then press Install. The template takes no parameters: it supplies the parser and builds the pipeline, and the transport is configured on the syslog listener rather than on the form. There is no source to add, no processor to attach, and no sink to wire by hand.
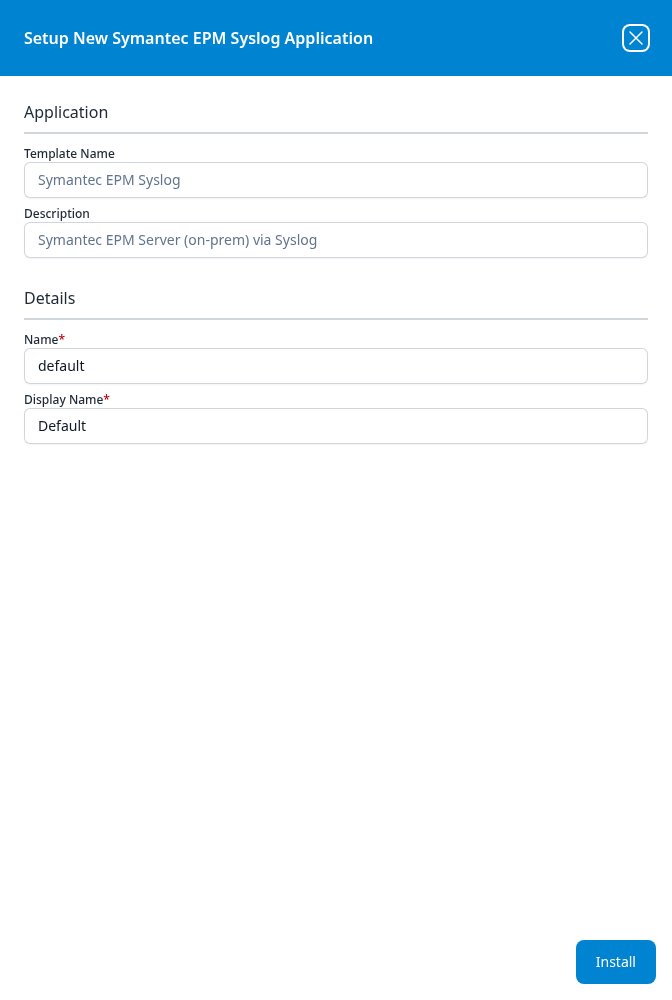
Unlike most templates, Symantec EPM Syslog takes no datalake or datalake index name parameter — the destination is fixed by the template rather than chosen on the form, so there is nothing here to collide with another application. To see where the data actually lands, open the installed application's details panel with the blue eye button and read its Actions list, which records every object the install created.
The application then appears in the Installed Applications view, where its badge reads Running once the pipeline is up.
Confirm it is running
Two delays stack before the first record can arrive: the client reports to SEPM, and SEPM forwards on its Update Frequency. Allow at least one full interval of the value you set in step 2 before concluding anything is wrong.
The reliable way to produce a record you can find is a detection you caused deliberately — the EICAR test file on a managed client generates a Risk log entry within seconds, and it should reach the lake one export interval later. Confirm the same event is visible in SEPM's own Monitors → Logs view for the same window: if SEPM has it and the lake does not, the problem is the export; if SEPM does not have it either, the problem is between the client and SEPM and has nothing to do with this integration.
See Confirm data is arriving for the general procedure.
Troubleshooting
| Symptom | Likely cause | Fix |
|---|---|---|
| Nothing arrives at all | External Logging enabled but the syslog server, port or protocol does not match the listener | Re-check the Syslog Server tab against Platform → Administration → Syslog Ports |
| Nothing arrives, and the settings look right | The SEPM server has no route to the listener, or an outbound rule blocks it | Test from the SEPM host itself, not from a workstation |
| Some log types arrive and others never do | The missing types are not selected on the Log Filter tab | Re-open Configure External Logging → Log Filter |
| Records arrive in bursts rather than continuously | Expected — this is a periodic export, not a stream | Lower the Update Frequency if the delay matters |
| A site's logs stop after a server change | The Master Logging Server was the server that was replaced or taken out of service | Reset it on the General tab |
Related
- Endpoint Management — other endpoint products.
- ManageEngine — the other syslog-transport template filed in this category.
- Syslog Import and Syslog Ports — the transport and listener.
- Install Application From Template — this template's entry in the catalog reference.
- Integration Matrix — which ingress method each product supports.