ManageEngine
ManageEngine's endpoint and IT operations products — patch management, endpoint central, and the service desk among them — emit their audit trails as syslog. That trail records administrative actions on managed endpoints: software pushed, patches applied, configurations changed, remote sessions opened. Because those are the same actions an attacker with management-console access would take, the feed is worth collecting even where the products are purely operational.
ManageEngine-side Setup
Enable syslog forwarding in the product's own configuration and point it at the listener described below. Note that the ManageEngine suite does not share one logging configuration — patch management, Endpoint Central and the service desk are each configured separately, so repeat this for every product you want collected. Follow ManageEngine's documentation for the product in question.
Syslog Configuration
The server sends to a syslog listener: either the cloud syslog endpoint or a local collector appliance. The two destinations use different ports. The cloud endpoint has a per-tenant domain and a block of ports allocated to your account: Platform → Administration → Syslog Ports shows the domain, the port range, and which protocol listens on which port — read the numbers off that page rather than assuming a standard one. A collector appliance listens by default on UDP/514, TCP/514, TLS on 6514 and TLS RFC 6587 on 7514, and each of its listeners can carry a Customer Tag that attributes the records arriving on it. See Syslog Import for the protocol options and Syslog Ports for the listener configuration. Either TLS listener presents a certificate the sending device has to trust: the Download CA (ca.crt) button on the Syslog Ports page supplies it, and without it the handshake fails with nothing logged on the platform side.
Install the Application
Go to Platform → Applications → Install Application From Template and choose Manage Engine from the Endpoint Management category. Despite the category, this is a syslog integration — the template supplies the parser, and the transport is configured on the listener rather than in the form. Both parameters are required:
| Parameter | Notes |
|---|---|
| datalake | Pre-filled managed. |
| datalake index name | Pre-filled ManageEngine. |
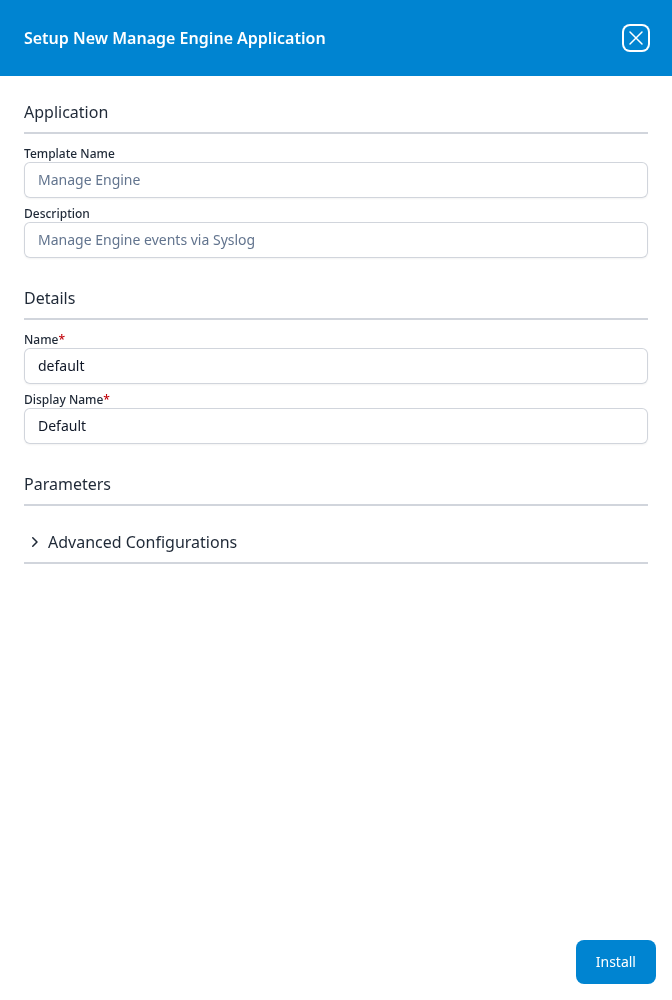
Press Install. The application then appears in the Installed Applications view, where its badge reads Running once the pipeline is up.
Validating the Data
Perform an action that produces a known audit entry — pushing a patch or opening a remote session — and search for it in the ManageEngine index. Confirm the server hostname and timestamp are correct.
Related
- Endpoint Management — other endpoint products.
- Syslog Import and Syslog Ports — the transport and listener.
- Time Adjustment — for device timestamps sent in local time.