Navigation
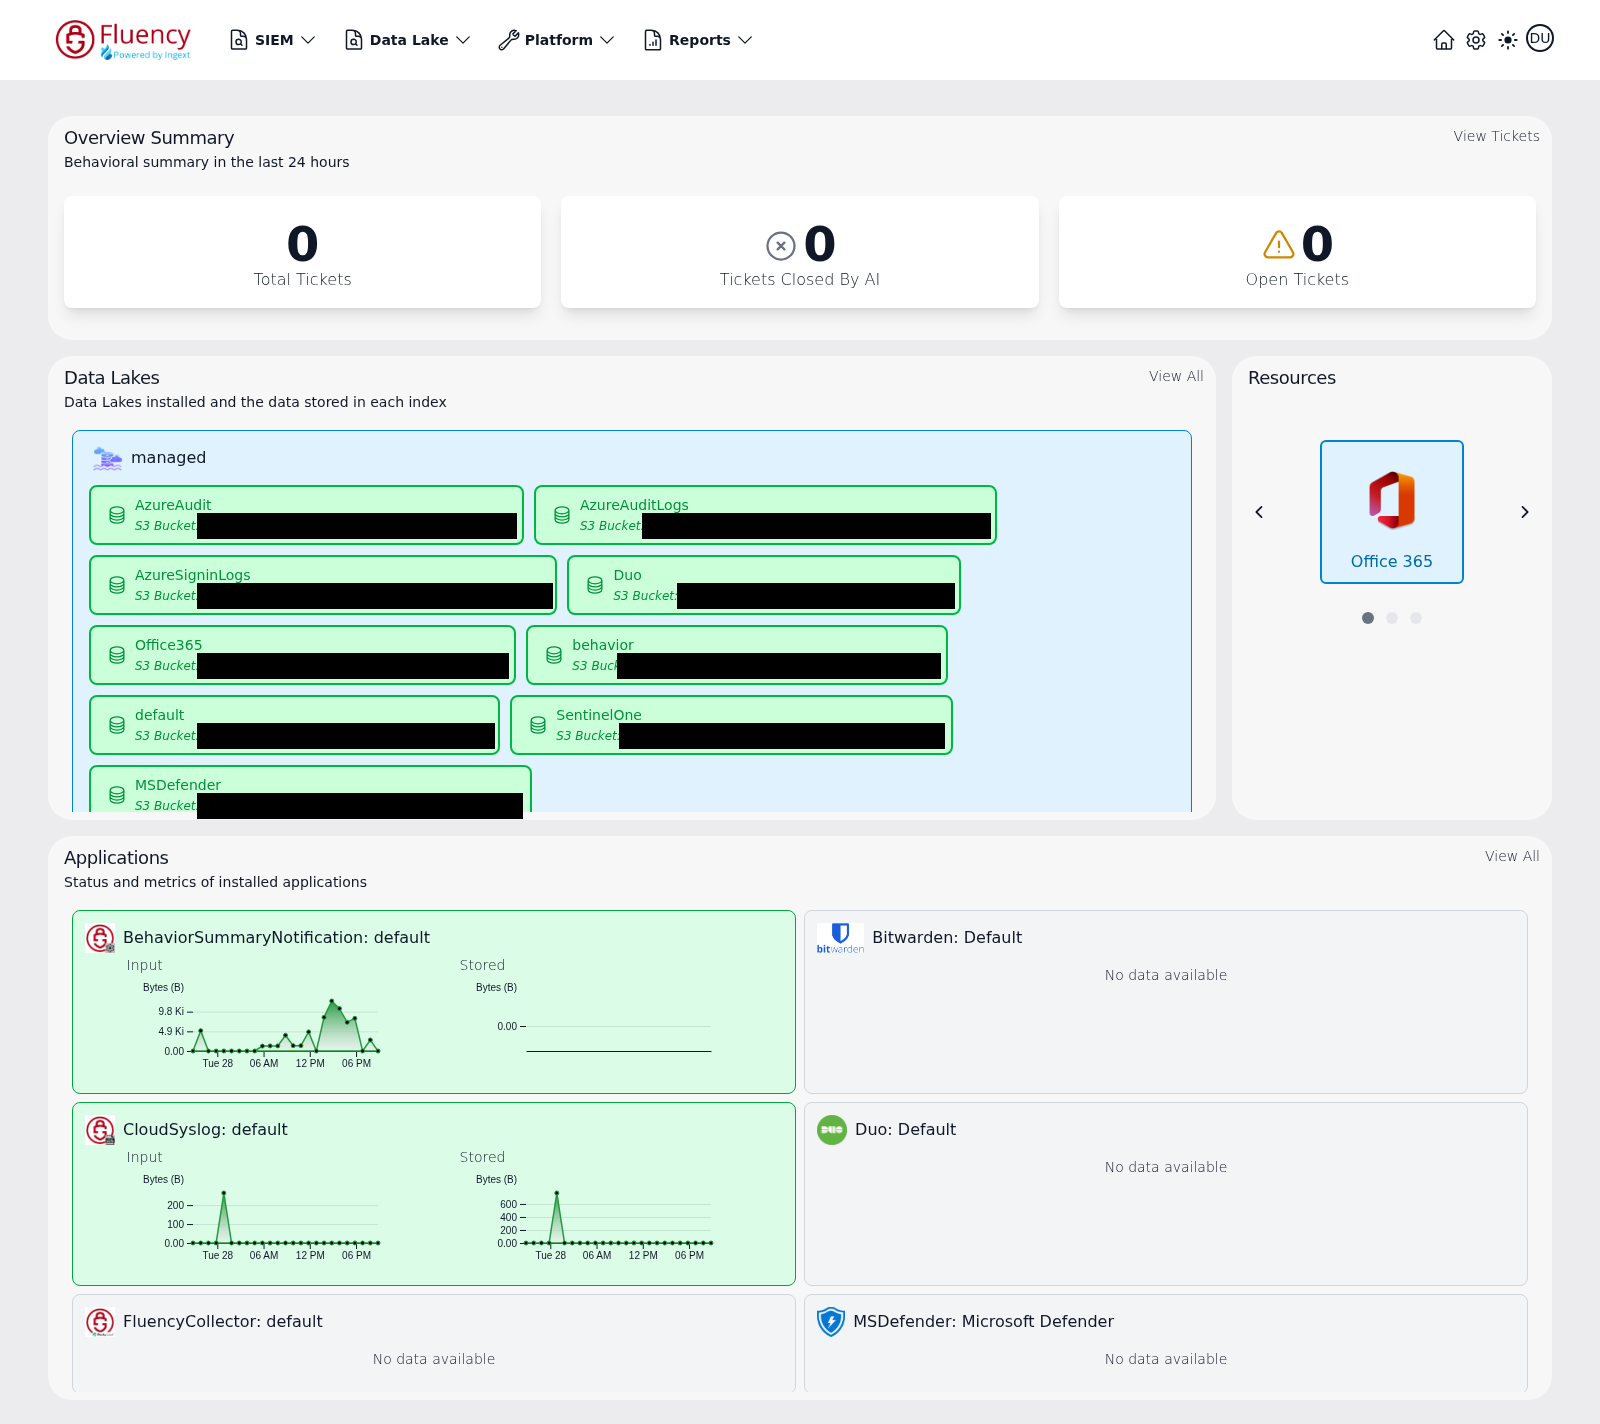
Navigation in the Fluency web interface is done through the navigation bar across the top of the screen. Every page shares the same bar, and each menu in it groups the pages of one functional area.
For a page-by-page reference of the interface — what each page shows, and what every button, menu, and dialog does — see the Page Functionality section.
The Navigation Bar
From left to right, the navigation bar contains:
- Fluency logo — returns to the Home dashboard.
- SIEM — behavioral detection and triage: summaries, timelines, rules, and entity tables.
- Data Lake — searching stored events, investigations, and managing data lake indexes and schemas.
- Platform — the data pipeline: applications, configuration, integrations, processors, usage, assets, and platform administration.
- Reports — report dashboards, report processors, and scheduled reports.
On the right side of the bar are the Home icon, the Settings (gear) icon, a light/dark theme toggle, and the account avatar whose menu reaches your own Profile.
SIEM
The SIEM menu contains the pages used to review detections and manage detection logic:
- Overview Summary — a dashboard of behavioral activity: ticket counters for a chosen time range and a filterable list of the underlying ticket records. This is the primary entry point for reviewing Behavior Alerts.
- Behavior Summary — search and review the aggregated behavior summaries built for each entity over a date range.
- Behavior Timeline — a chronological view of behavior events, with a risk-score chart and per-event alerts and attributes.
- Resources — the resources (users, devices, and other entities) observed by the system.
- Behavior Rules — view, create, and manage behavior detection rules, and the Behavior Filters that act as their exceptions.
- EntityInfo Tables — manage the entity information (lookup) tables used to enrich events.
Data Lake
The Data Lake menu contains the pages used to search stored events and manage where and how event data is stored:
- Search — the database search across all collected events, with facets, a count timeline, data export, and investigation runs.
- Investigations — the history of investigation searches run against the data lake.
- Management — add and manage data lakes and their indexes.
- Schemas — create and manage the schemas that describe stored data.
- KQL Query Builder — an interactive KQL query builder for data lake indexes.
- KQL Search History — saved KQL search runs, each reopening its stored results.
Platform
The Platform menu contains the pages used to operate the data pipeline:
- Applications — install and monitor the applications that bring data into the pipeline. Three views share the page: Installed Applications (what is running, with each one's pipeline diagram), Install Application From Template (the catalog of 65 templates you connect a new source from), and Application Templates (the template library as a table).
- Configuration — a live diagram of the pipeline's sources, routers, and sinks. New components can be added and configured from here.
- Integrations — manage integrations with external services.
- Processors — the FPL (Fluency Programming Language) processors that parse and transform events; FPL Receivers, Packers, Actions, and Rules are also found here.
- Usage — charts of data ingress and search volume for the account.
Two sub-menus group additional Platform pages:
- Assets — Assets Search (the asset inventory) and Metrics Alerts (tickets raised by platform metrics alerts).
- Administration — Resource Sync, Collectors, Syslog Ports, and Notifications.
Reports
The Reports menu contains the pages used to build and schedule reports:
- Dashboard — the report dashboards in the account, grouped into Scheduled and On-Demand reports.
- Processors — create and manage the FPL report processors and review their execution history.
- Scheduler — schedule reports, run them on demand, and review their run history.
Settings
The Settings (gear) icon opens the account administration hub at /settings/team. It opens on the Users area — a searchable table of the account's users with Name, Email, Roles, and Actions columns and an Add user button — and its sidebar menu also provides Support, Advanced (GitHub, AWS Roles, Permissions), and Management (Audit, Reports, Lake Tasks) areas.
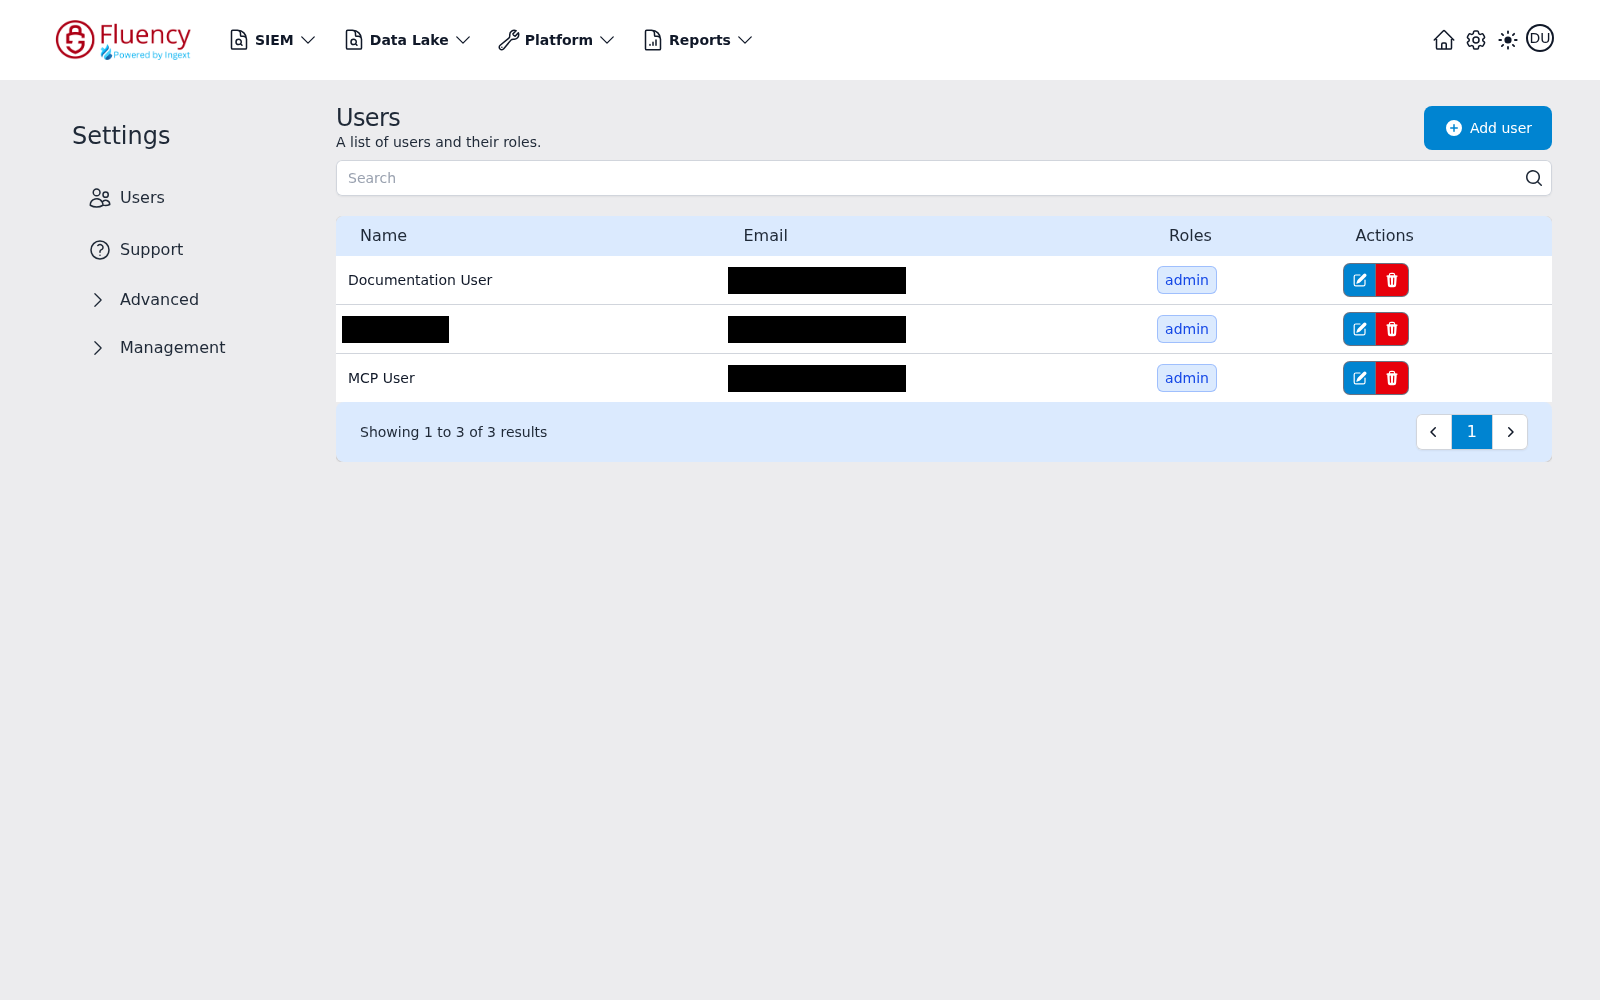
Advanced and Management are expandable groups: a collapsed group shows a right-pointing chevron, and clicking it expands the group in place without leaving the page. The two entries most often needed are Advanced → Permissions, which holds the API Tokens, Roles, API Policies, and Data Policies tabs, and Management → Audit, the log of user activity in the portal.
For the full walkthrough of each area, see Page Functionality → Settings.
The account menu
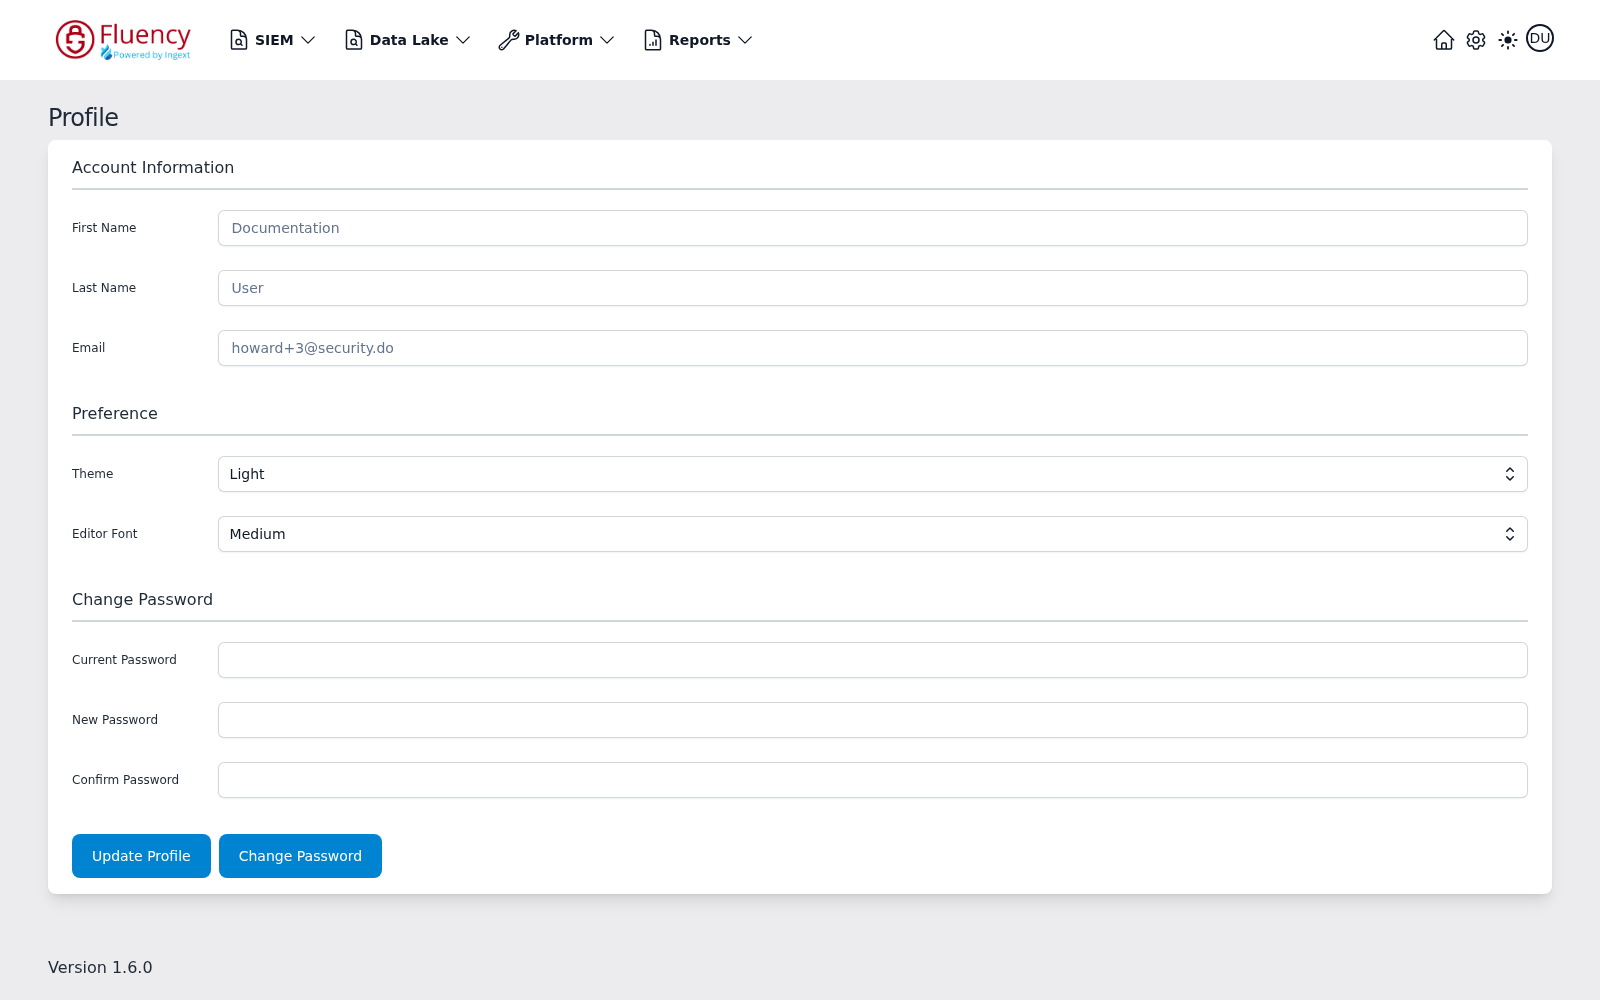
The account avatar at the far right of the bar is a separate menu from the gear. It leads to your own Profile page (URL path /user/profile), where you set your name and email, your Theme (Light or Dark) and Editor Font preferences, and your password. The application version is printed in the lower-left corner of that page.