Investigate
Data analysis creates the notifications and, in turn, the aggregated cases. This section starts at what happens after a case is created: how an analyst reviews it, works down from the summary into the underlying events, and closes the loop by tuning the rule that fired.
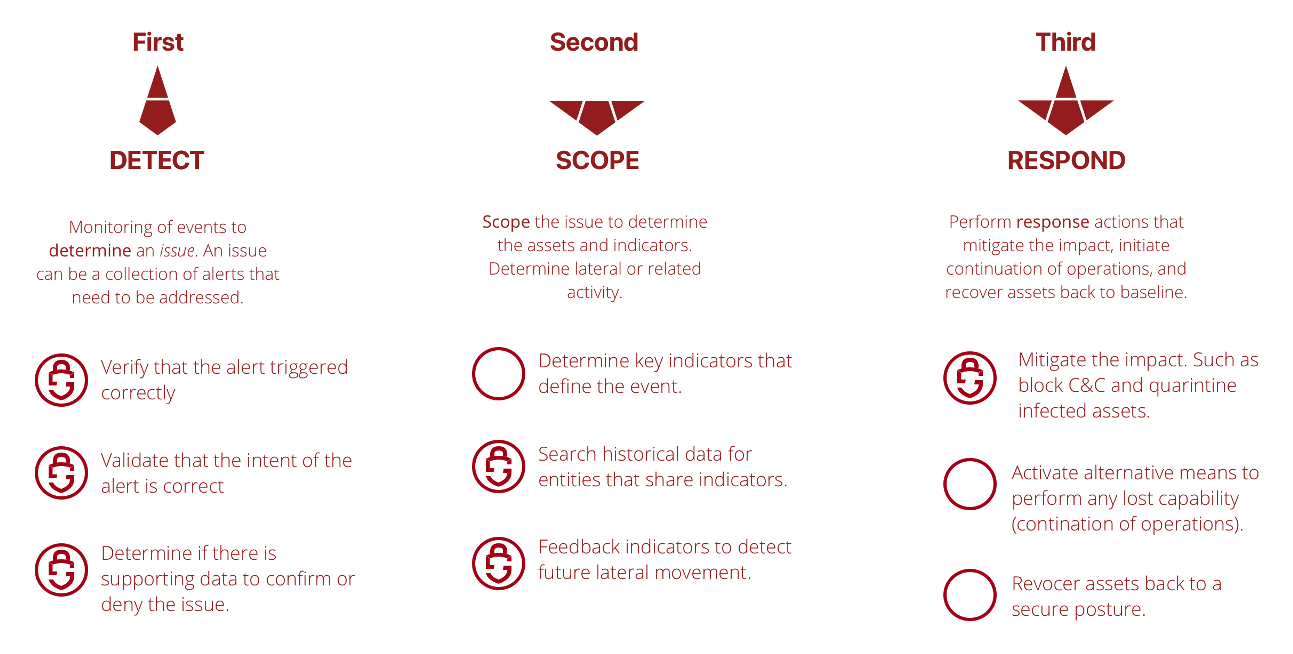
The review workflow
- Overview Summary — the queue of behavior-summary tickets (below).
- Behavior Summary (case) — pre-defined investigations and case status/ticketing.
- Behavior Timeline — the chronological event view for the entity.
- Investigation — event searching in the Data Lake.
In the current interface these pages are found under the SIEM menu (Overview Summary, Behavior Summary, Behavior Timeline) and the Data Lake menu (Search). Flow searching, from the older interface's Network Flows page, is no longer a separate step. See Page Functionality for the current pages.
Overview Summary
Choose the Overview Summary option under the SIEM menu in the navigation bar (/SIEM/overviewSummary). The page is subtitled Overview of Fluency Behavior Summaries.
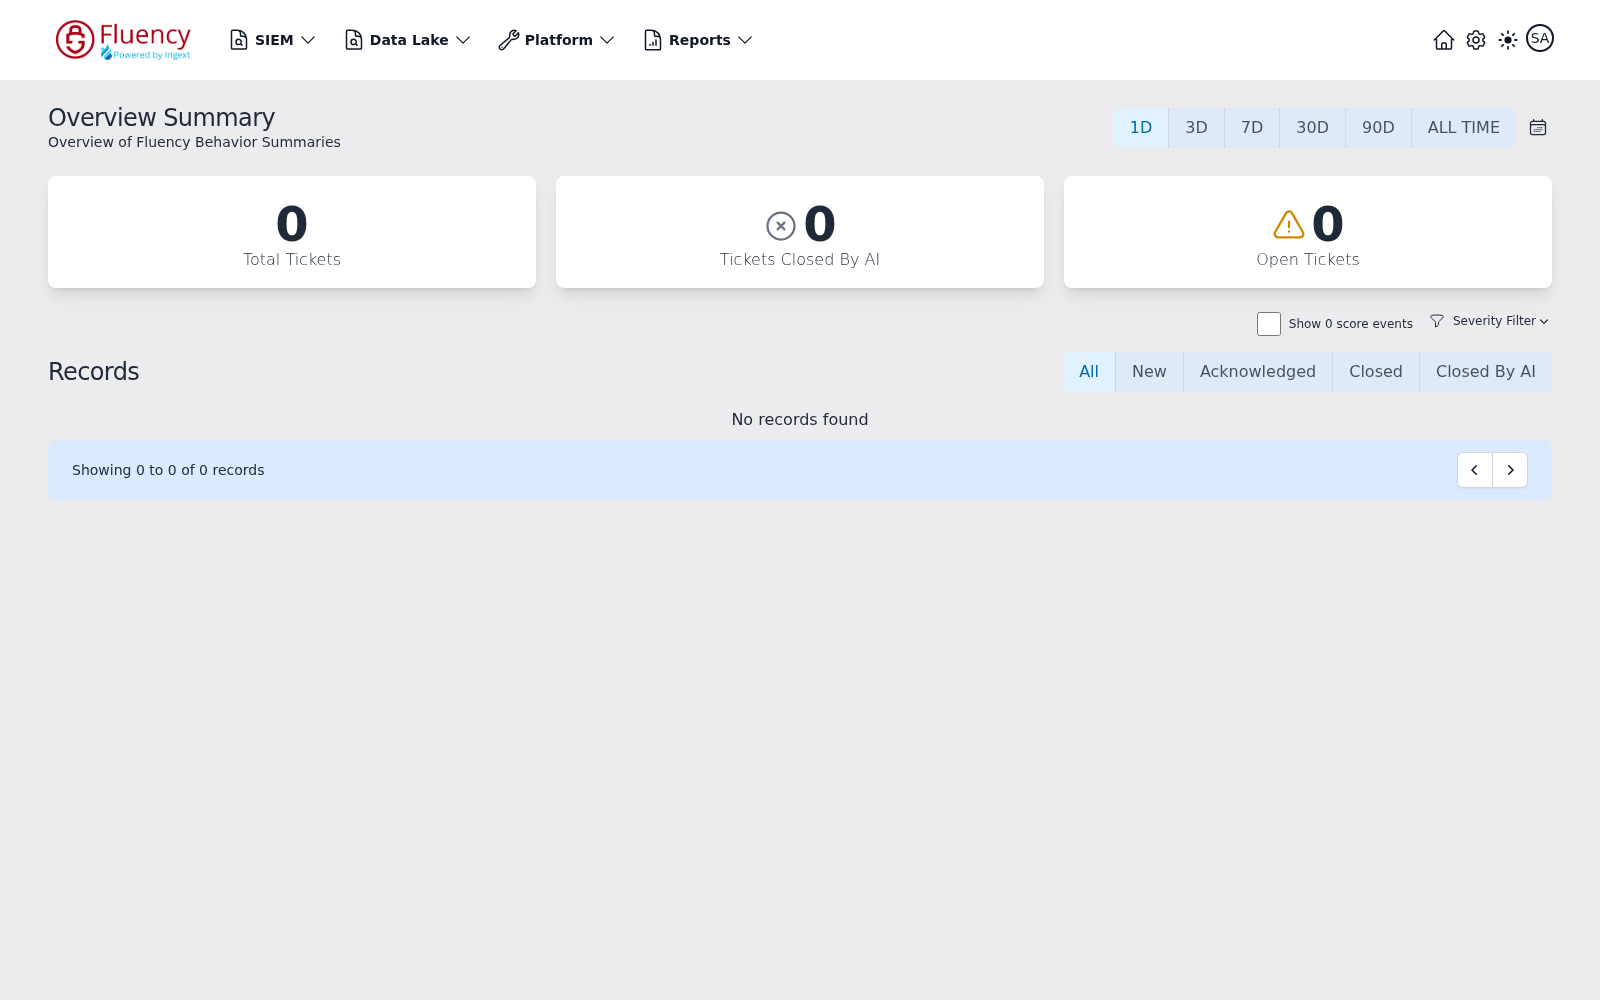
The three counter cards at the top — Total Tickets (all tickets generated in the period), Tickets Closed By AI (tickets resolved automatically, marked with a circled-x icon), and Open Tickets (tickets still awaiting review, marked with a warning-triangle icon) — summarize the behavior-summary tickets listed in the Records section below, for the selected time range.
The time range is set by the button group in the upper right: 1D (the default), 3D, 7D, 30D, 90D, and ALL TIME, with a calendar icon beside ALL TIME for a Custom date range.
Two controls sit between the counters and the records list: a Show 0 score events checkbox, off by default, which includes zero-score events in the list when enabled, and a Severity Filter dropdown.
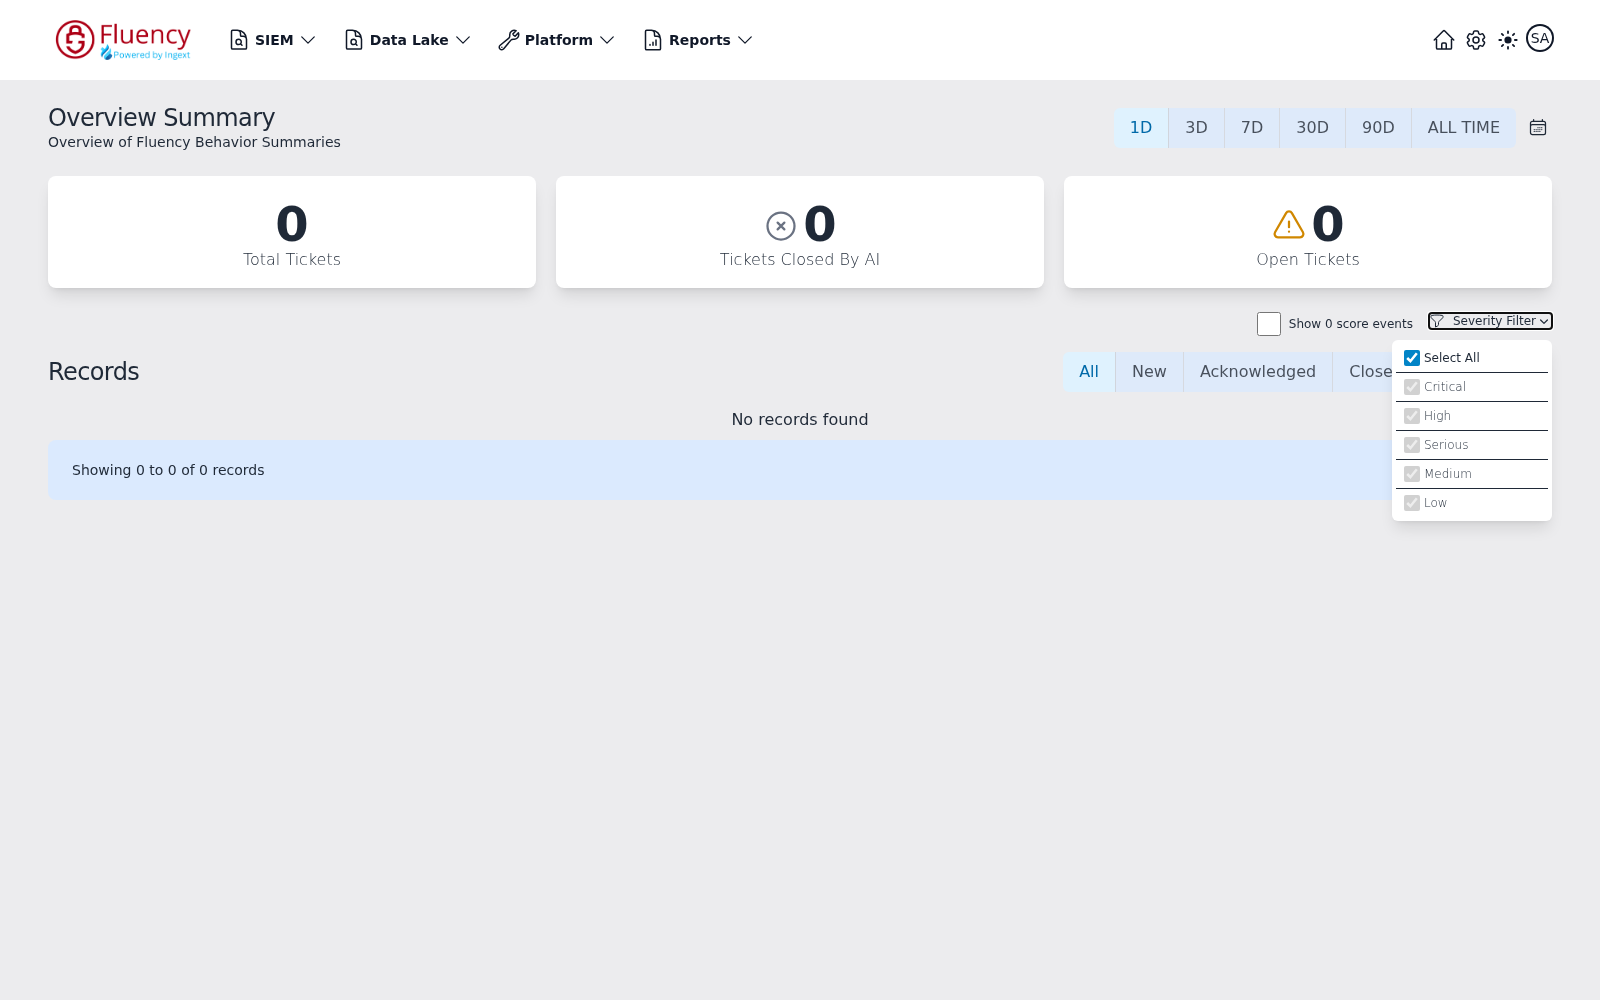
The Severity Filter dropdown holds a Select All checkbox — checked by default, so every severity is included — followed by one checkbox per level: Critical, High, Serious, Medium, and Low.
The Records list itself is filtered by ticket status with the tab bar on its right: All (the default), New, Acknowledged, Closed, and Closed By AI. When nothing matches, the list shows No records found; the footer bar reports the visible range and pages through longer lists.
To see how this table is dug into, continue to Investigating a Behavior Alert.
In this section
- Investigating a Behavior Alert — the worked end-to-end example, from ticket to raw record.
- Behavior Summary — the per-entity case view and its risk scores.
- Behavior Timeline — the chronological event view for an entity.
Related
- Detections — the rules that produce these behaviors.
- Events Search — where step 4 of the workflow above happens.
- SIEM → Overview Summary — the screen reference for the queue.