Metrics
Creating the Namespace
You create namespaces by writing to them inside a processor.
 let dimensions = {
          namespace: "cloudwatch",
          app: "flows",
          action: obj.event.action,
          sender: obj.event.src_ip,
          destination: obj.event.dest_ip
        }

Platform_Metric_Counter("cloudwatch_flow_count", dimensions, 1)
While the namespace is called cloudwatch, the metrics will be called cloudwatch_flow_count.
In this example, there is an object something like:
obj: {
        event: {
            account_id: "999954988160",
            action: "ACCEPT",
            bytes: "1542",
            dest_ip: "18.118.216.36",
            dest_port: "50221",
            end_time: "1726663030",
            id: "38505871963542404529999865800232899601069883806077878278",
            interface_id: "eni-0739b0dca912ae857",
            logStream: "eni-0739b0dca912ae857-all",
            log_status: "OK",
            owner: "999904988160",
            packets: "7",
            parserName: "AWS CloudWatch Network Log",
            protocol: "6",
            src_ip: "10.54.1.244",
            src_port: "3389",
            start_time: "1726663016",
            subscriptionFilters: [
                "passToKinesis"
            ],
            version: "2"
        },
        sourcetype: "cloudwatch",
        time: 1726663138987
    }
You are defining a Pod , which is a holder for that data. You want to make this Pod simple for this keeps the size of the structure down. When you define a dimension for a metric, the objective is that it is focused on the query you are going to ask.
Creating a Table and Histogram
To create a table and histogram, you will tend to use two common functions: Platform_Metric_Sort and Platform_Metric_Sort_Histogram. These functions create the Prometheus queries, execute them, and provide a results object.
function main() {

  let from ="-1h@h"
  let to="@h"

  let groupBy= ["sender", "destination"]
  // let groupBy= "sender"

  let options = {
    metric: "cloudwatch_flow_count",
    from: from,
    to: to,
    select: `action = "REJECT"`,
    groupBy: groupBy,
    sort: "topk",
    limit: 20
  }

  let table = Platform_Metric_Sort(options)

  options.interval= "5m"
  let histogram = Platform_Metric_Sort_Histogram(options)

  return {table, histogram}
}
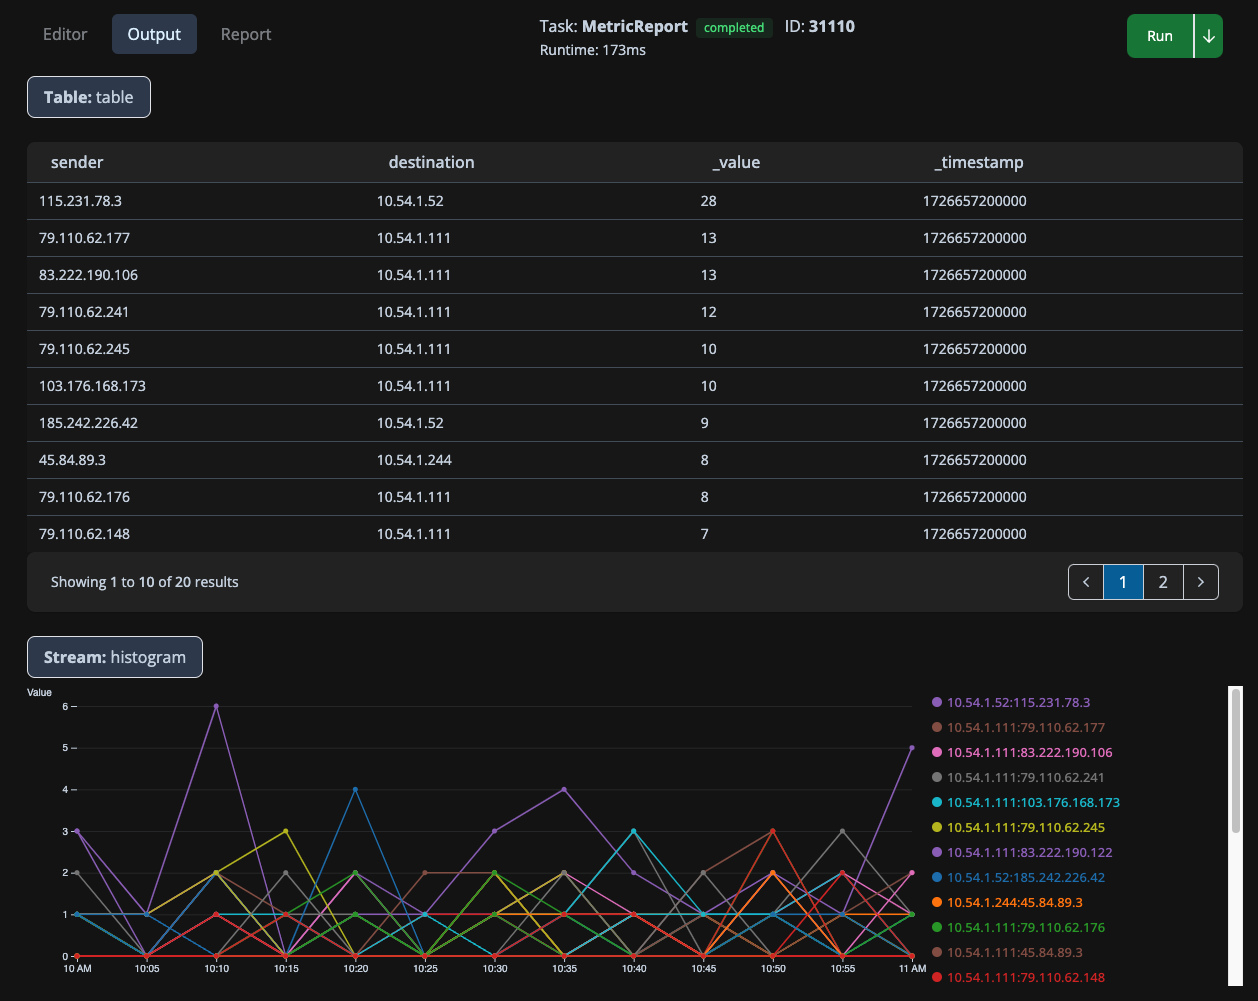
The above code generates an Output like this:
How to Execute a Task/Report
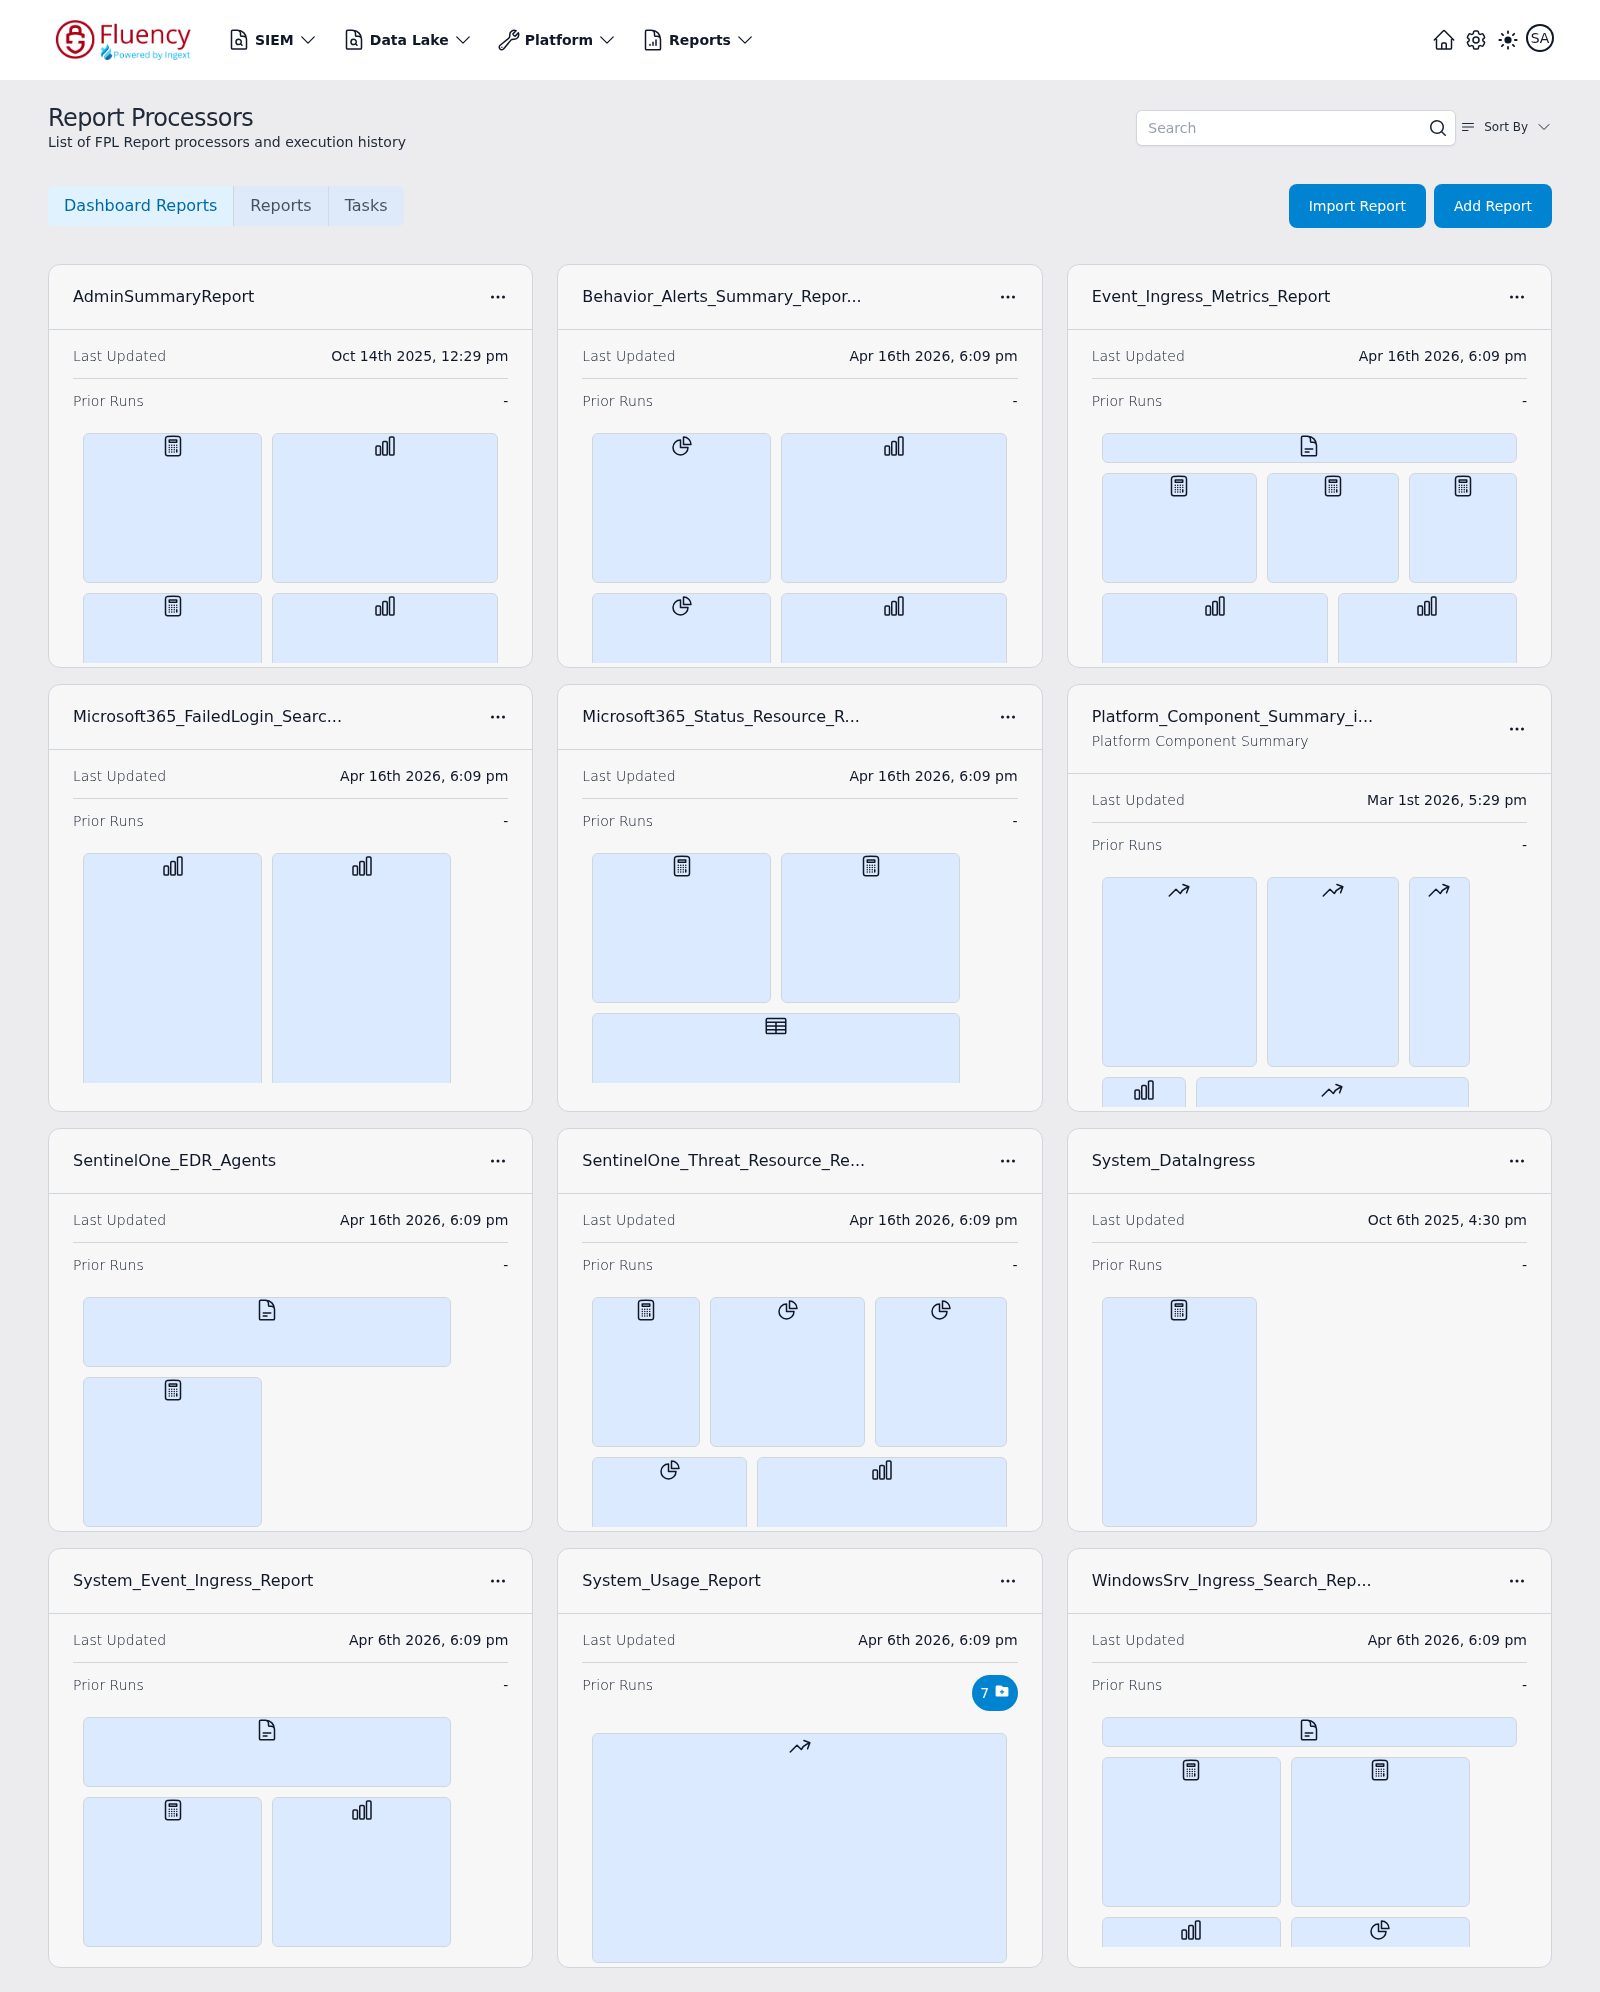
To create Tasks and Reports, navigate to Reports → Processors (/reports/processors), titled Report Processors on screen. A row of category tabs — Dashboard Reports, Reports, and Tasks — filters the card grid, with the Import Report and Add Report buttons at the right end of that row and a Search box and Sort By dropdown in the header above.
To create a new task, click Add Report to open the report editor.
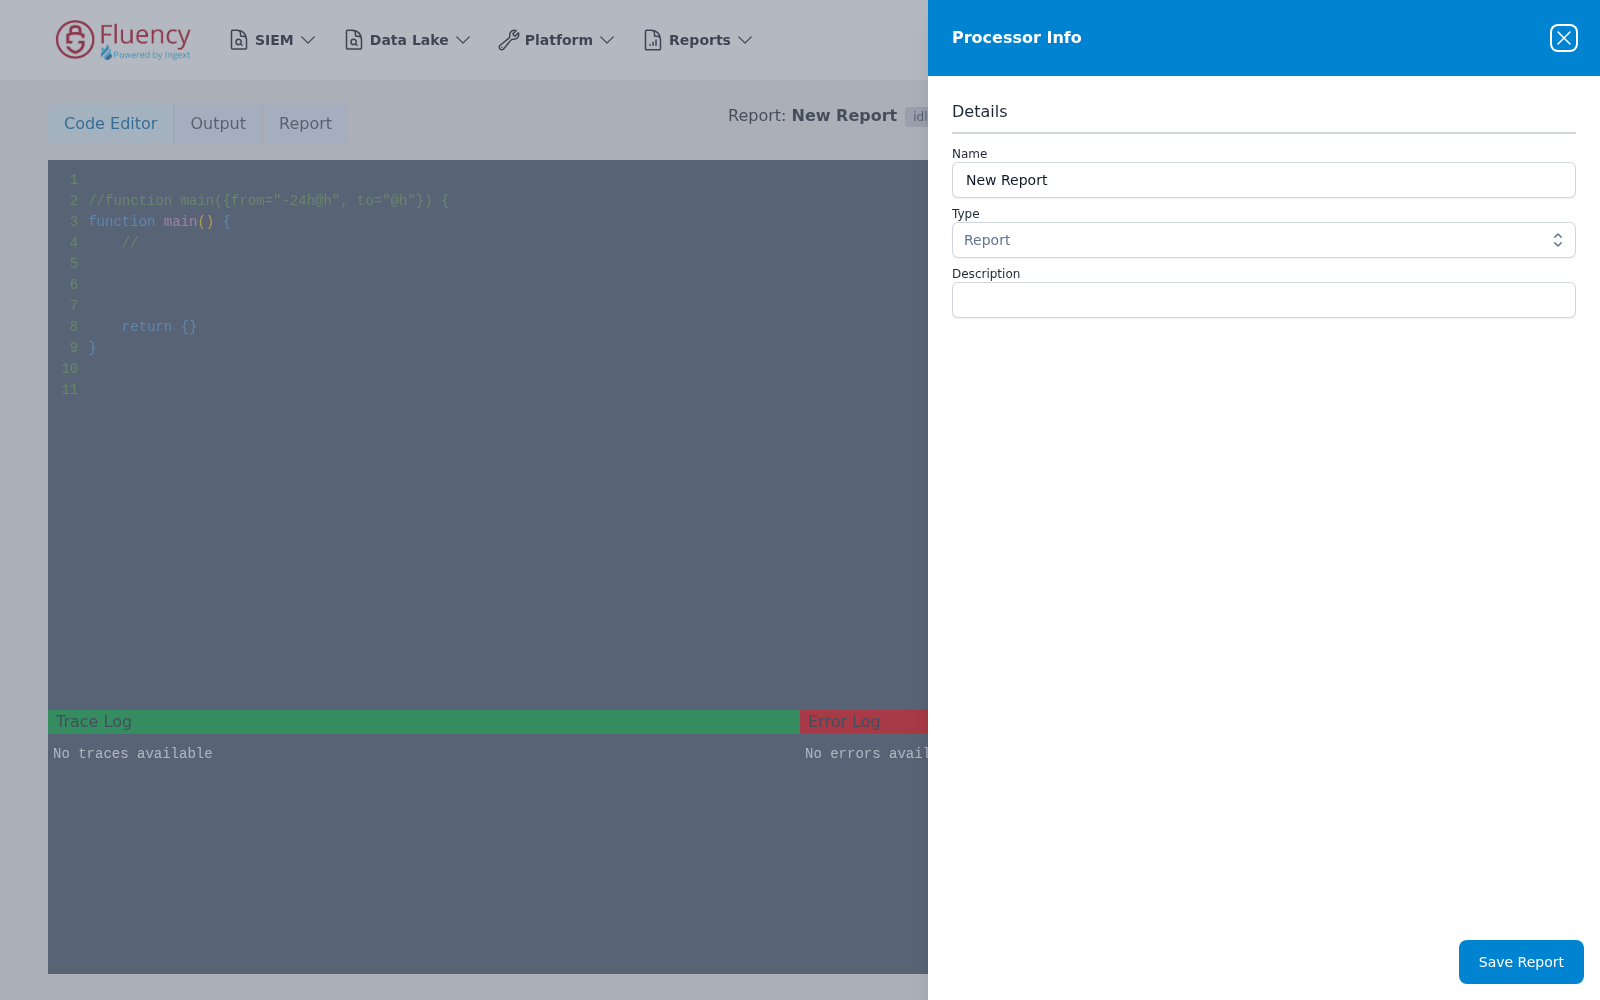
A Processor Info panel opens on the right with a Details form — Name (prefilled with New Report), a Type dropdown (set to Report), and Description. Click Save Report at the bottom of the panel to save the new processor.
New Tasks
You use the report editor to create a new task. It will start with a blank editor. There are three tabs
- Code Editor: Where you place the code
- Output: The values placed in the return of the main code body
- Report: Where you add a presentation layuer to organize how a report looks.
You will place your code in the editor and run it. Any error or printf (console prints) will appear on the bottom of the Edit tab, while the results will appear on the Output tab.
Useful Queries
In these example, you will use the metric of cloudwatch_flow_count
You are going to create your own metric names.
You can write a simple process that queries the metric database and shows the results:
function main() {

  let query = `<PLACE QUERY HERE>`

  let table = Platform_Metric_Query(query, "@m")

  return {table}
}
The remainder of the manual provides some useful queires to use in this code snippet.
For a more complete understanding of queries refer to VictoriaMetricsDocs. While this is the underlying engine, there are many examples by Googling Prometheus queries.
What are the Available namespaces?
Sometimes you are looking at a system that you are not as familiar using. In this case, you can request all namespaces.
group by(__name__) ({__name__!=""})
What are the dimensions of a name space?
You can simply query the and columns will show the dimensions.
topk(5, sort_desc(cloudwatch_flow_count))
or add a time limit
topk(5, sort_desc(cloudwatch_flow_count[5m]))
Count of pods per cluster and namespace
Having a list of how many pods your namespaces have in your cluster can be useful for detecting an unusually high or low number of pods on your namespaces.
sum by (namespace) (cloudwatch_flow_count)
Aggregate request rates
One of the key health indicators you want to measure about a service is how many requests it currently serves. Rate tells you how fast a value is increasing
rate(cloudwatch_flow_count[5m])
But often you care about a particular dimension, or group of dimensions. In this case, you use the ‘sum’ command.
sum by(sender, action)(rate(cloudwatch_flow_count[5m]))
Often, you get rates of zero for attributes with no data. You can remove them by only listing those attributes with a value:
sum by(destination)(rate(cloudwatch_flow_count[5m])) > 0